Products
SentimenTrader Trading Tools
‍
Backtest Engine
My Trading Toolkit
Correlation Analysis
Seasonality
Market Prediction
Indicators & Data API
‍
Proprietary Indicators & Charts
Market Data API
Strategies & Scanner
‍
50+ Trading Strategies
Smart Stock Scanner
Smart Option Scanner
Research Reports
‍
Research Solutions
Reports Library
Free Resources
Simple Backtest Calculator
Simple Seasonality Calculator
The Kelly Criterion Calculator
Sentiment Geo Map
Public Research Reports
Education
Sentiment Indicators
Technical Indicators
Pricing
Company
About
In the News
Testimonials
Client Success Stories
Contact
Log inLoginSign up
< BACK TO ALL REPORTS

Copper/Gold Ratio flashing a favorable sign for metals and miners

Jay Kaeppel
2023-10-16
Given the endless hype surrounding gold - and no net price gain in twelve years - it is easy to ignore the yellow metal at times. However, the recent action of the Copper/Gold ratio suggests that gold, metals, and gold stocks may be worth a closer look.

Key points

  • Gold receives a great deal of attention (and hype) even though it is unchanged over the past three and 12-year periods
  • The Copper/Gold Ratio just crossed a critical threshold
  • Historically, this action has been favorable for gold, metals in general, and gold mining stocks

Copper/Gold Ratio crosses a threshold

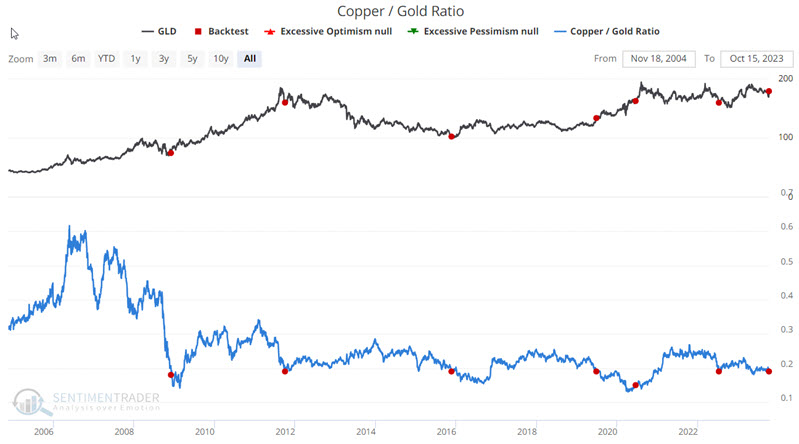
As the name implies, the Copper/Gold Ratio compares the price of copper to the price of gold. It essentially measures the trend in industrial metals versus that in precious metals. Our calculation uses Copper and Gold Continous Futures contracts. 

Let's look at some market action when the Copper/Gold Ratio is below 0.19, excluding overlapping signals in the last year. 

Copper/Gold Ratio versus precious metals

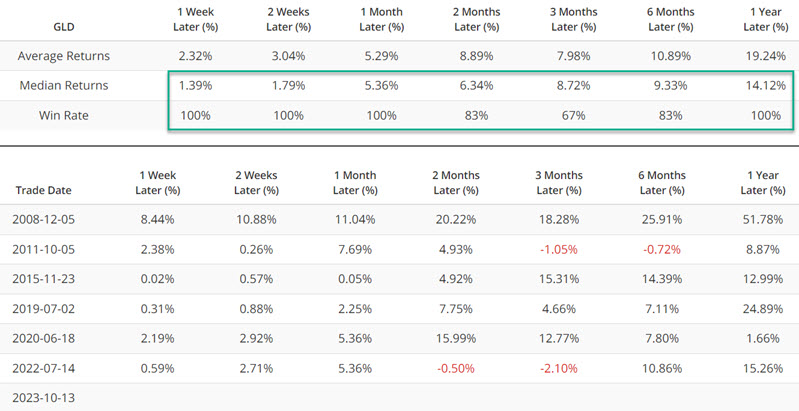
ETFs allow traders to gain exposure to commodities without trading commodity futures. SPDR Gold Shares (ticker GLD) is an ETF that tracks gold futures. The chart below highlights those dates when the Copper/Gold Ratio was below 0.19, excluding overlapping signals with 1-year. The table summarizes GLD performance.

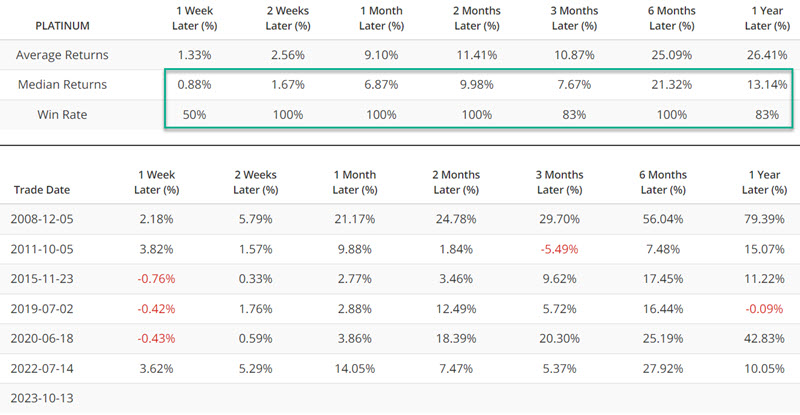
The chart below looks at platinum futures and highlights those dates when the Copper/Gold Ratio was below 0.19, excluding overlapping signals with 1-year. The table summarizes platinum performance.

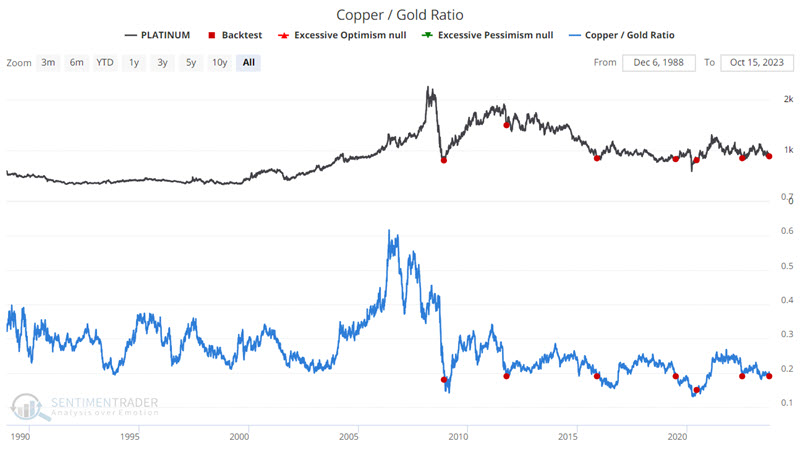
abrdn Physical Platinum Shares ETF (PPLT) is an ETF that tracks platinum futures.

Copper/Gold Ratio versus industrial metals

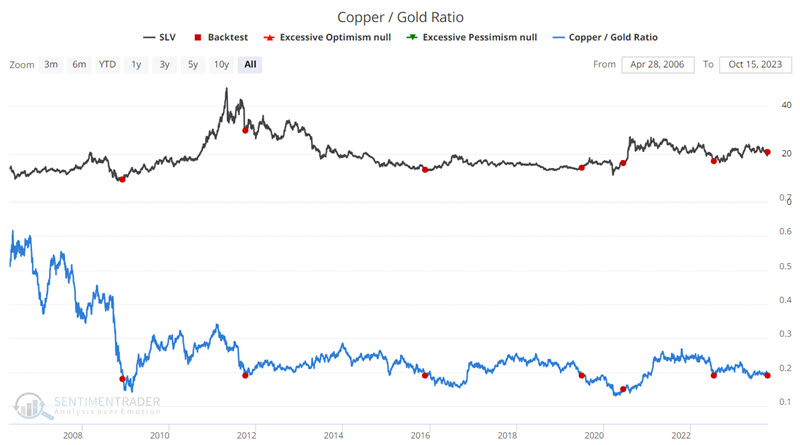
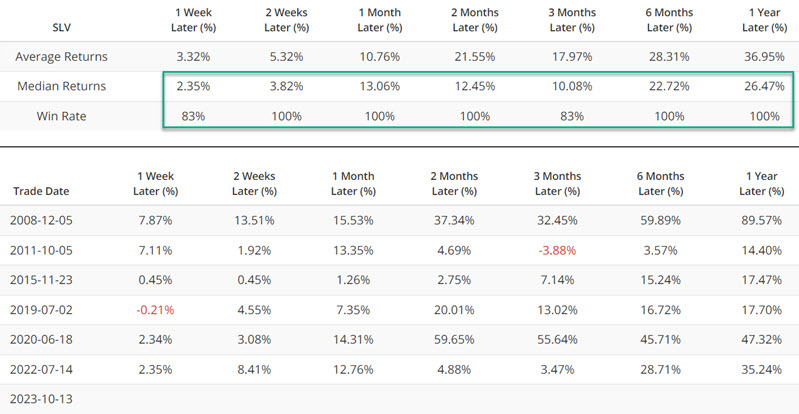
iShares Silver Trust (ticker SLV) is an ETF that tracks silver futures. The chart below highlights those dates when the Copper/Gold Ratio was below 0.19, excluding overlapping signals with 1-year. The table summarizes SLV performance.

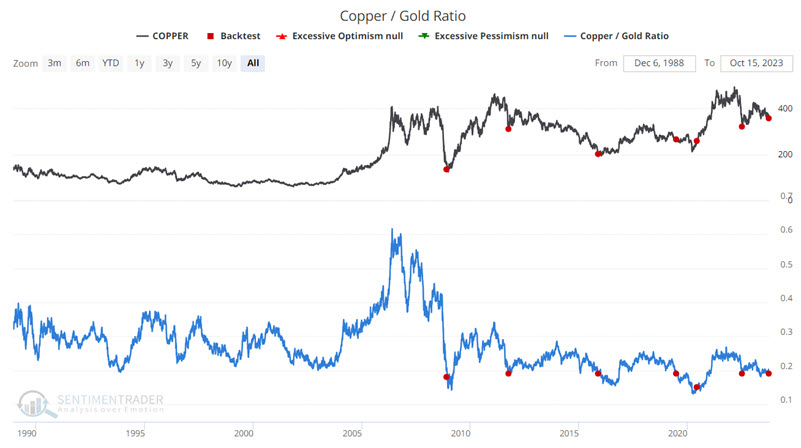
The chart below looks at copper futures and highlights those dates when the Copper/Gold Ratio was below 0.19, excluding overlapping signals with 1-year. The table summarizes copper performance.

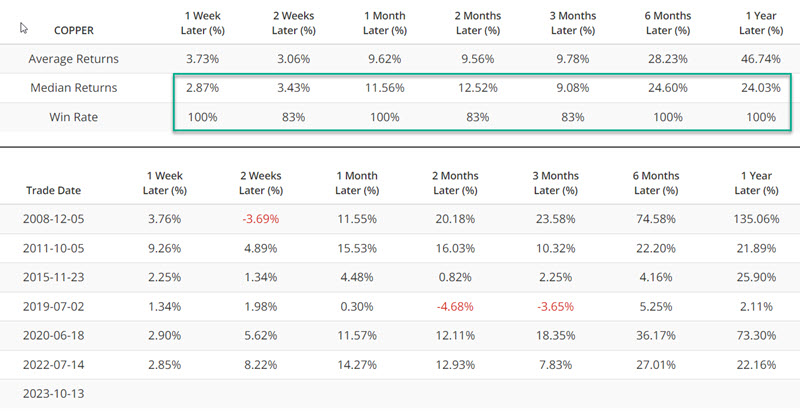
United States Copper Index Fund, LP (CPER) ETF is designed to track the price of copper.

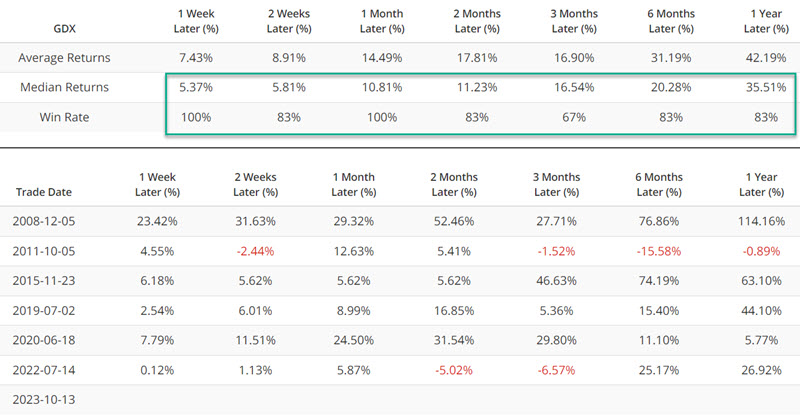
Copper/Gold Ratio versus gold stocks

VanEck Gold Miners ETF (GDX) tracks an index of gold mining stocks. The chart below highlights those dates when the Copper/Gold Ratio was below 0.19, excluding overlapping signals with 1-year. The table summarizes GDX's performance.

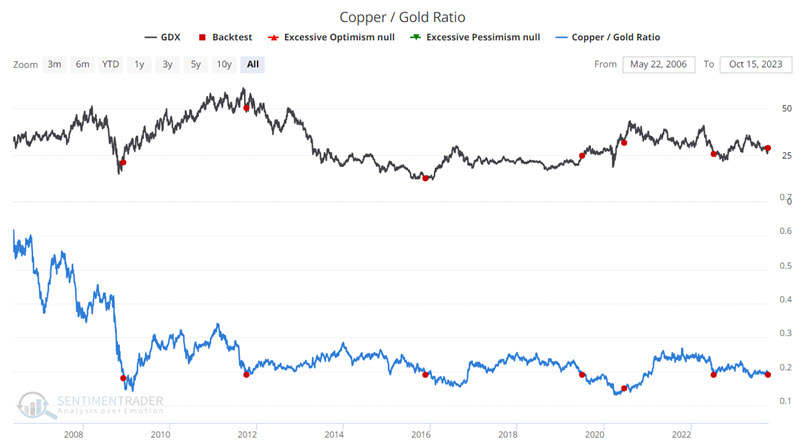
Gold traders looking for an aggressive bullish play might consider favoring gold stocks over the metal itself. That said, note that - results so far this month notwithstanding - gold stocks have historically been poor performers in the month of October.

What the research tells us…

There is almost always an above-average amount of bullish hype surrounding gold and gold stocks. Like the boy who cried wolf, bullish gold pundits understandably get routinely tuned out. Likewise, though the results above are compelling, they represent only one indicator and involve a very small sample size. So, it should not be relied upon solely as a reason to buy - or not buy - metals or metals-related ETFs. That said, a combination of geopolitical concerns, ongoing inflation concerns, and a potential cup with handle formation (and don't forget this obscure, but possibly once again relevant action in LIT Optix) - combined with the signal highlighted above - might give investors and traders some reason to consider a long position in metals and/or gold mining stocks.

PRODUCTS
SentimenTrader
Trading Tools
Indicators & Data API
‍
Strategies & Scanner
‍
Research Reports
FREE
RESOUrCES
Simple Backtest
Calculator
Simple Seasonality
Calculator
The Kelly Criterion
Calculator
Sentiment Geo Map
‍
Public Research Reports
‍
Education
Sentiment Indicators
‍
Technical Indicators
‍
Pricing
Bundle pricing
‍
FAQ
‍
Announcements
‍
COMPANY
‍
About
‍
In the News
‍
Testimonials
‍
Client Success Stories
CONTACT
‍
General Inquiries
‍
Media Inquiries
‍
Financial Professionals Inquiries
‍
© 2026 Sundial Capital Research Inc. All rights reserved.
Setsail Marketing
TermsPrivacyAffiliate Program
Risk Disclosure: The information and tools provided are for research and analytical purposes only and are not intended as investment advice. Market analysis involves uncertainty, and outcomes may differ from expectations. Users should conduct their own due diligence and consider their individual circumstances before making any financial decisions. Past performance is not necessarily indicative of future results.

Hypothetical Performance Disclosure: Hypothetical performance results have many inherent limitations, some of which are described below. No representation is being made that any account will or is likely to achieve profits or losses similar to those shown; in fact, there are frequently sharp differences between hypothetical performance results and the actual results subsequently achieved by any particular trading program. One of the limitations of hypothetical performance results is that they are generally prepared with the benefit of hindsight. In addition, hypothetical trading does not involve financial risk, and no hypothetical trading record can completely account for the impact of financial risk of actual trading. for example, the ability to withstand losses or to adhere to a particular trading program in spite of trading losses are material points which can also adversely affect actual trading results. There are numerous other factors related to the markets in general or to the implementation of any specific trading program which cannot be fully accounted for in the preparation of hypothetical performance results and all which can adversely affect trading results.

Testimonial Disclosure: Testimonials appearing on this website may not be representative of other clients or customers and is not a guarantee of future performance or success.