Products
SentimenTrader Trading Tools
‍
Backtest Engine
My Trading Toolkit
Correlation Analysis
Seasonality
Indicators & Data API
‍
Proprietary Indicators & Charts
Market Data API
Strategies & Scanner
‍
50+ Trading Strategies
Smart Stock Scanner
Research Reports
‍
Research Solutions
Reports Library
Free Resources
Simple Backtest Calculator
Simple Seasonality Calculator
The Kelly Criterion Calculator
Sentiment Geo Map
Public Research Reports
Pricing
Company
About
In the News
Testimonials
Client Success Stories
Contact
Log inLoginSign up
< BACK TO ALL REPORTS

Consumer Staples Underperformance

Dean Christians
2021-06-30
Let's conduct a study to assess the forward return outlook for the consumer staples sector when the percentage of members outperforming the S&P 500 on a rolling 63-day basis falls to one of the lowest levels in history.

On Tuesday, I shared a study that showed that only 30% of S&P 500 members are outperforming the Index on a rolling 21-day basis as of 6/28/21. That level ranks in the 2nd percentile when compared to all other instances since 1927. I also highlighted the percentages for individual sectors within the Index. The consumer staples sector was one of three sectors with a percentile rank of zero. i.e., one of the lowest readings in history.

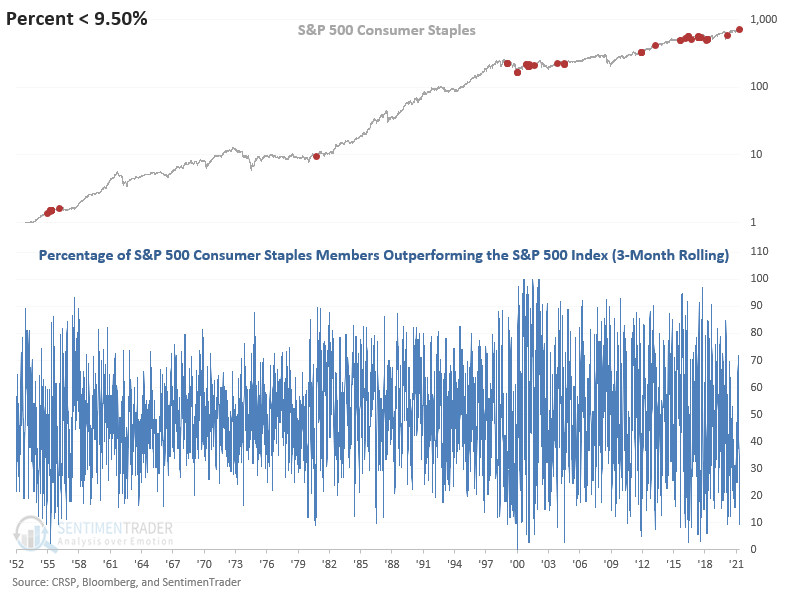
The team at SentimenTrader also keeps track of the percentage of members outperforming the S&P 500 index on a rolling 63-day basis. That measure for the consumer staples sector has also fallen to one of the lowest absolute levels in history. As of 6/29/21, it showed that 9.38% of consumer staples stocks are outperforming the S&P 500 index.  

Let's conduct a study to assess the forward return outlook for the consumer staples sector when the percentage of members outperforming the S&P 500 on a rolling 63-day basis cross below 9.5%. I will include a reset condition cross back above 60% to screen out duplicate signals.

HISTORICAL CHART

The historical chart for the percentage of consumer staples members outperforming the S&P 500 highlights the change in character for the sector. Before 2000, the group performed like a more traditional growth sector, especially during the 1980s and early 1990s. Since 2000, it's one of the go-to groups for defensive growth in times of high volatility.

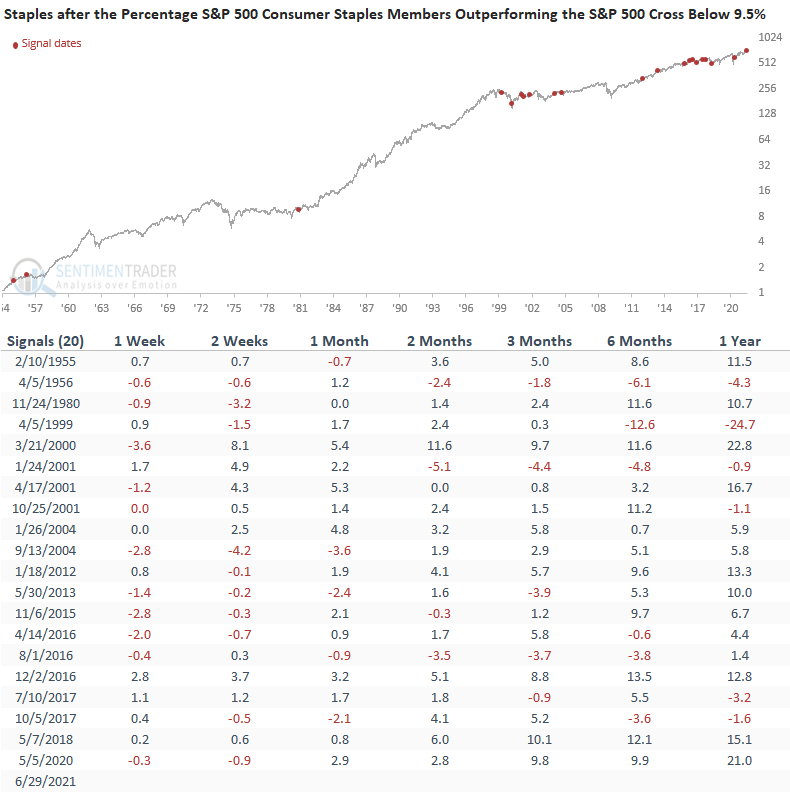
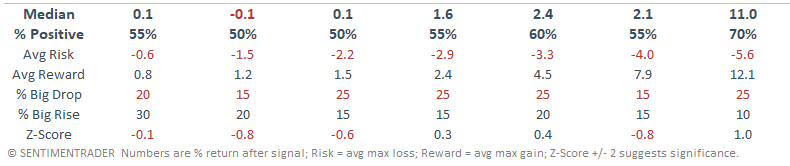
HOW THE SIGNALS PERFORMED - CONSUMER STAPLES

The 1-2 week results look underwhelming. However, the 1-6 month outlook looks constructive. 

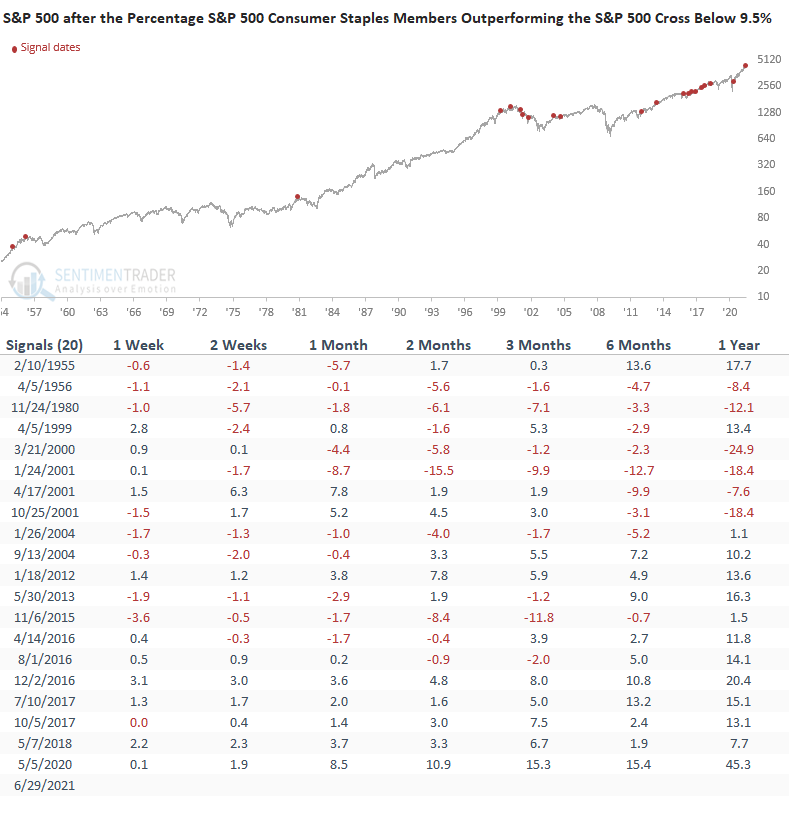
Let's apply the same signals to the S&P 500 index.

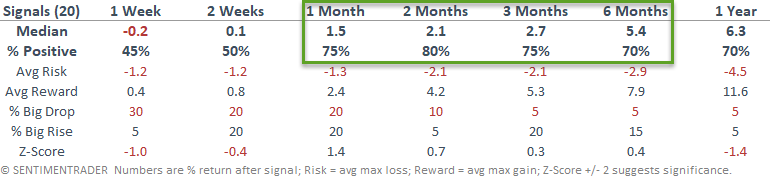
HOW THE SIGNALS PERFORMED - S&P 500

Interestingly, the results look underwhelming across almost all timeframes.
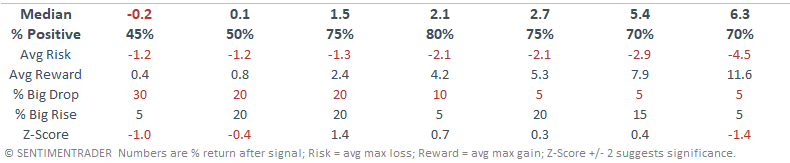
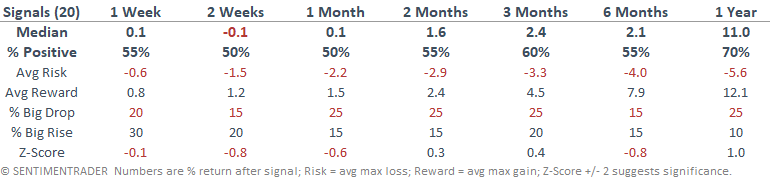
SUMMARY COMPARISON

The 1-6 month results look more compelling for the Consumer Staples sector.

Consumer Staples

S&P 500

As we approach the seasonally weak period of the year, let's see how the consumer staples sector compares to the S&P 500 on a relative basis.
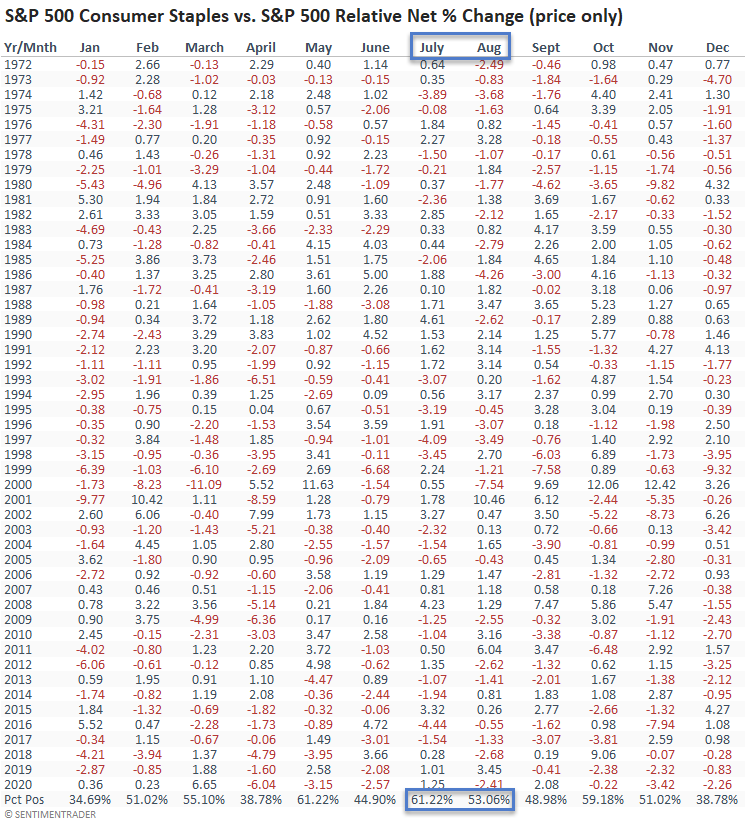
SEASONALITY

As the table shows, the consumer staples sector typically outperforms the S&P 500 in the month of July and August. 

The case for an allocation to the consumer staples sector looks compelling, especially if one is worried about the weak breadth measures that Jason and I have highlighted of late. I would view the allocation as a summer rental that starts in mid-July. 

PRODUCTS
SentimenTrader
Trading Tools
Indicators & Data API
‍
Strategies & Scanner
‍
Research Reports
FREE
RESOUrCES
Simple Backtest
Calculator
Simple Seasonality
Calculator
The Kelly Criterion
Calculator
Sentiment Geo Map
‍
Public Research Reports
‍
Pricing
Bundle pricing
‍
Announcements
‍
FAQ
COMPANY
‍
About
‍
In the News
‍
Testimonials
‍
Client Success Stories
CONTACT
‍
General Inquiries
‍
Media Inquiries
‍
Financial Professionals Inquiries
‍
© 2025 Sundial Capital Research Inc. All rights reserved.
Setsail Marketing
TermsPrivacyAffiliate Program
Risk Disclosure: Futures and forex trading contains substantial risk and is not for every investor. An investor could potentially lose all or more than the initial investment. Risk capital is money that can be lost without jeopardizing ones’ financial security or life style. Only risk capital should be used for trading and only those with sufficient risk capital should consider trading. Past performance is not necessarily indicative of future results.

Hypothetical Performance Disclosure: Hypothetical performance results have many inherent limitations, some of which are described below. No representation is being made that any account will or is likely to achieve profits or losses similar to those shown; in fact, there are frequently sharp differences between hypothetical performance results and the actual results subsequently achieved by any particular trading program. One of the limitations of hypothetical performance results is that they are generally prepared with the benefit of hindsight. In addition, hypothetical trading does not involve financial risk, and no hypothetical trading record can completely account for the impact of financial risk of actual trading. for example, the ability to withstand losses or to adhere to a particular trading program in spite of trading losses are material points which can also adversely affect actual trading results. There are numerous other factors related to the markets in general or to the implementation of any specific trading program which cannot be fully accounted for in the preparation of hypothetical performance results and all which can adversely affect trading results.

Testimonial Disclosure: Testimonials appearing on this website may not be representative of other clients or customers and is not a guarantee of future performance or success.