
Consumer staples as a bear market bellwhether

Key points:
- The S&P 500 is outperforming consumer staples, assumed to be a good sign for future returns
- That is mostly true, but it is nuanced
- When the S&P is outperforming that sector, it tends to see large wins and small losses, but a low win rate
Comparing the S&P 500 and consumer staples
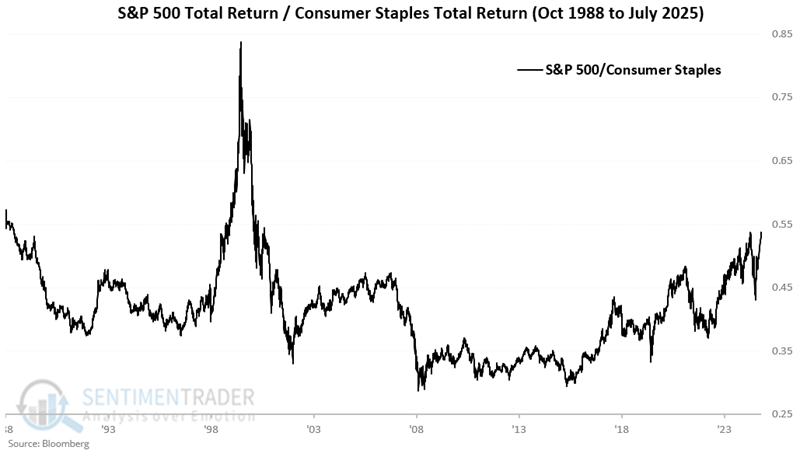
The S&P 500 index is far outpacing one of its most defensive sectors, consumer staples. Conventional wisdom suggests this is a good sign of risk-on behavior. The truth has been, well, a little more complicated.
For testing purposes, we use the S&P 500 Index (SPXT) to track the broader stock market and the S&P 500s (SPCS) to track the consumer staples sector. We'll use total return for both indices, which includes both price change and dividends.
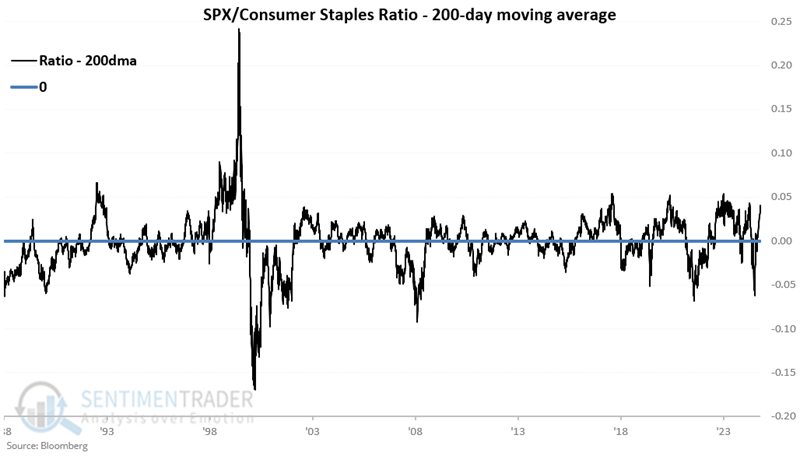
Subtracting the ratio from its 200-day average can give us a sense of the long-term trend. The standard theory is that readings above zero are considered favorable, and readings below zero are deemed unfavorable.
When the trend is favorable
First, let's look at S&P 500 performance when the SPXT/SPCS ratio was above its 200-day average. From October 1988 through July 2025, the S&P 500 gained 777%. The equity curve shows a strong tendency to trend from lower left to upper right. So far, the conventional wisdom looks profound.
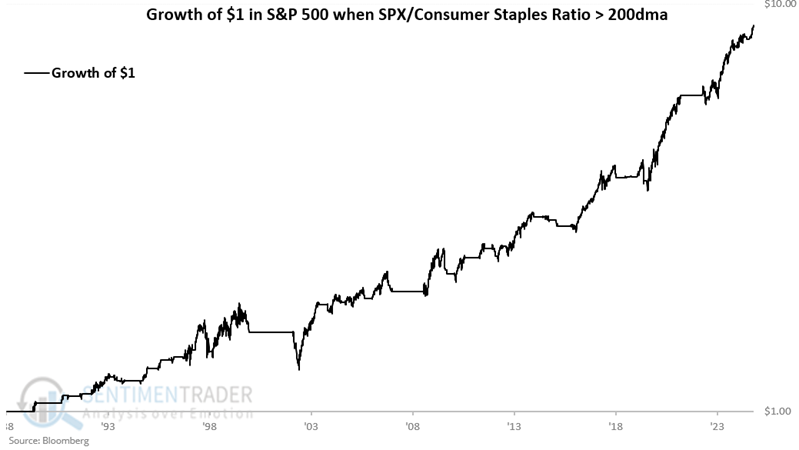
However, a closer look at signal-by-signal results shows something interesting.
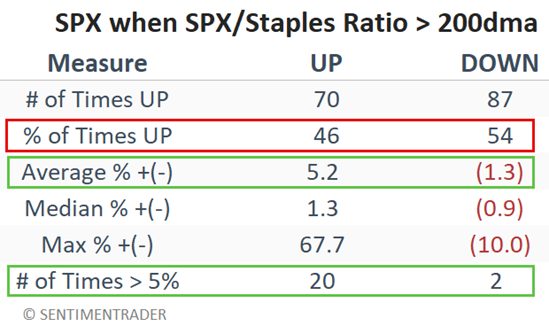
There were 157 favorable periods, but the S&P showed a gain during only 46% of them despite the upward trend of the equity curve. The saving grace was that the average gain of 5.2% was four times greater than the average loss of 1.3%. Also, twenty favorable periods saw a gain larger than 5%, while only two saw a 5% loss.
When the trend is unfavorable
The conventional wisdom supposes that the S&P 500 lagging is bad for stocks.
So, now let's look at the performance when the SPXT/SPCS ratio was below its 200-day average. From October 1988 through July 2025, the S&P 500 gained 464%.
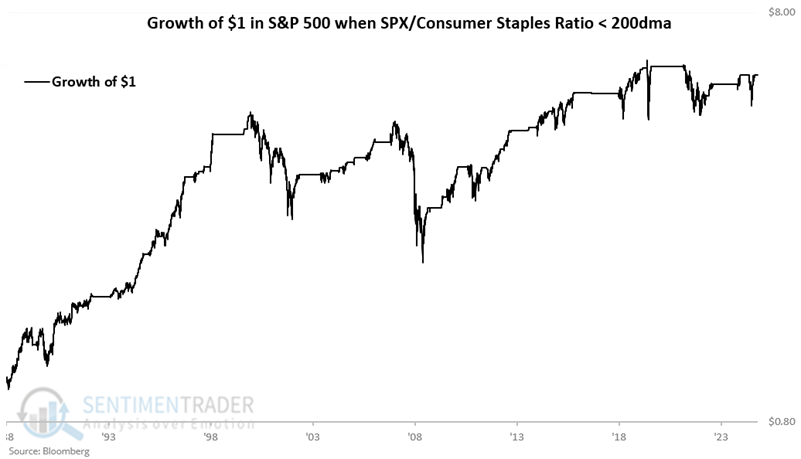
The theory that SPX lagging consumer staples is bad for stocks appears misguided except on several significant occasions.
The most significant bear markets during the test period (2000-2002, 2007-2009, and 2022) occurred when the ratio was unfavorable. So there's that. However, the stock market did just fine the rest of the time, sporting a sizeable 464% gain overall.
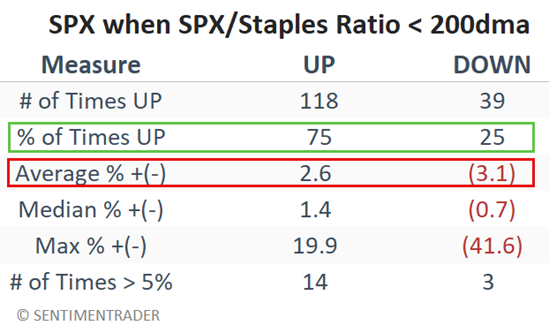
The table below summarizes the S&P 500's performance during unfavorable periods. The most surprising measure is the 75% win rate. A handful of huge losses (42% in 2007 to 2009, 34% in 2000 to 2002, and 16% in 2021 to 2023) significantly dragged down overall results.
A 75% win rate certainly calls into question the knee-jerk "S&P 500 lagging is bad for stocks" narrative. A more apt narrative might be: Consumer staples leading the S&P 500 is just fine for stocks unless a major bear market unfolds.
A final comparison
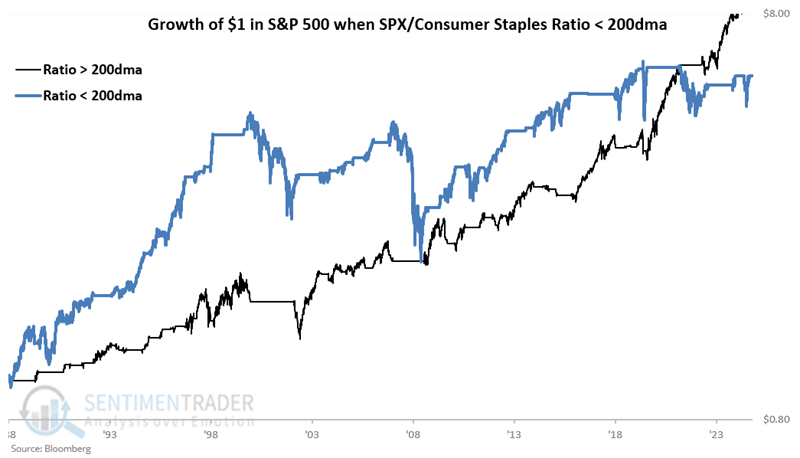
Below, we see the favorable period equity curve (black line) versus the unfavorable period (blue line). Note that the favorable black line overtook the supposedly unfavorable blue line only in the last several years.
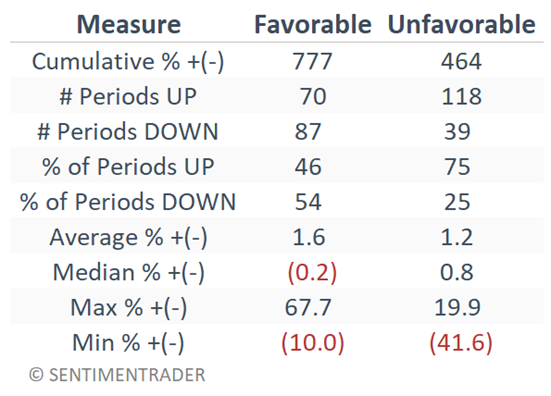
The table below compares the two regimes side-by-side. Note that the S&P's median return was actually higher during supposedly unfavorable periods, but its max gain was much lower and its max decline much worse.
What the research tells us…
The conventional wisdom states that SPX outperforming consumer staples is good for the overall stock market and vice versa.
Historically, when SPX has outperformed, there has been a tendency for large wins and small losses, which has resulted in an upsloping equity curve, despite only a 46% win rate. When SPX underperformed, there was a tendency for a high percentage of smaller wins and a handful of significant losses. Despite a 75% win rate for SPX during these periods, all major bear markets in the past 37 years have mostly played out during these periods.