
Consumer confidence has plunged (and why that's a good thing)

Key points
- Low readings regarding consumer confidence invariably trigger a great deal of handwringing, worry, and angst
- And as usual, when it comes to sentiment gauges, these knee-jerk responses tend to be wrong
- Several consumer confidence indicators are presently at an extreme - and typically favorable - level
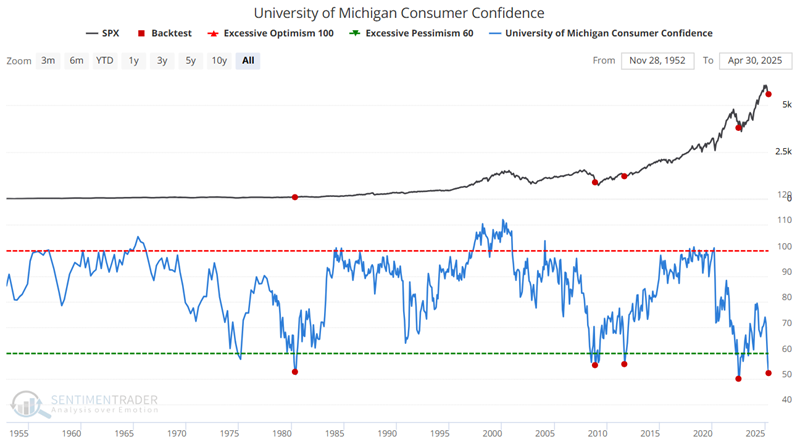
University of Michigan Consumer Confidence indicator nears an all-time low
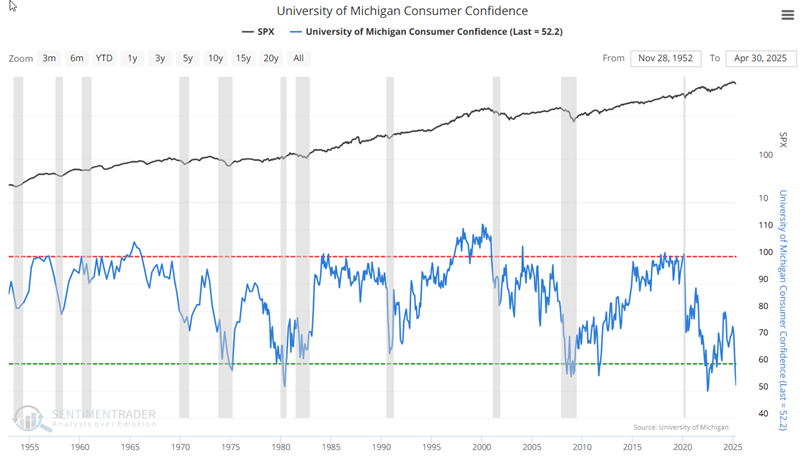
NOTE: This is now known as the Thomson/Reuters University of Michigan Consumer Sentiment Index.
The University of Michigan Consumer Sentiment Index is a consumer confidence index published monthly by the University of Michigan.
The index is normalized to have a value of 100 in December 1964.
George Katona at the University of Michigan devised the consumer confidence measures in the late 1940s. They have now developed into an ongoing, nationally representative survey based on telephonic household interviews. The Index of Consumer Sentiment (ICS) is developed from these interviews.
It gives a very accurate indication of the national economy's future course. The Index of Consumer Expectations (a sub-index of ICS) is included in the Leading Indicator Composite Index published by the U.S. Department of Commerce, Bureau of Economic Analysis.
The Index was created and still is published with the following objectives:
- Assessment of consumer attitudes on business climate, personal finance, and spending
- To create capability for understanding and forecasting changes in the national economy
- Directly incorporate empirical measures of consumer expectations into models of behavior
- To forecast the economic expectations and the future spending behavior of the consumer
- To judge the level of optimism/pessimism in the consumer's mind
The Index of Consumer Expectations focuses on three broad areas:
- How consumers view prospects for their own financial situation
- How they view prospects for the general economy over the near term
- Their view of prospects for the economy over the long term
The survey polls approximately 300 consumers for a preliminary figure and 500 for a final figure.
Like most other sentiment surveys, this is a coincidental indicator. When times are good, consumers are happy; when times are bad, they are less optimistic. The keys to watch for as investors are when divergences occur between sentiment and the stock market, especially times of extreme confidence or pessimism.
At the extremes, the survey is a decent contrary indicator. When the survey recorded readings over 100, it coincided with times of economic expansion and good stock market performance. Generally, stocks underperform after such occurrences.
When the survey recorded readings under 70, it coincided with challenging market conditions. However, by the time consumers recognize and extrapolate this, we're usually nearing the trough, and the stock market tends to bottom not long after.
When consumer confidence plunges
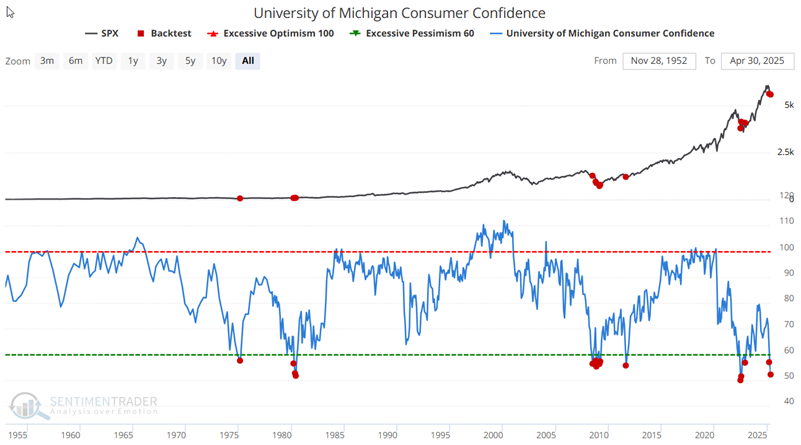
The latest U of M Consumer Confidence reading stands at 52.2. The chart above shows that this is on the low end of historical readings. We can identify five previous instances when the index dropped below 58. For our test, the chart below highlights all months when the index ended below 58.
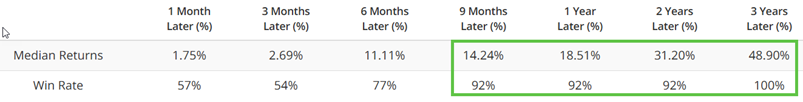
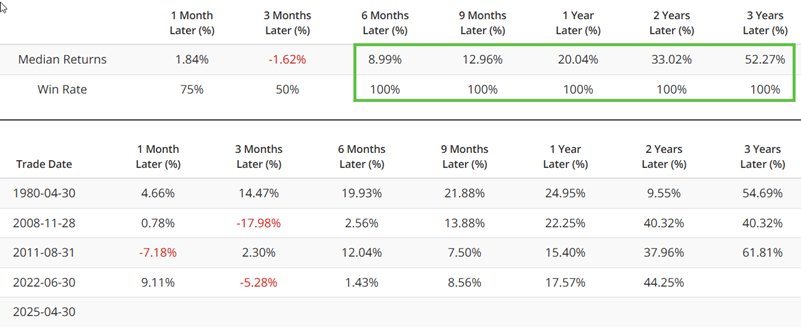
The table below summarizes subsequent S&P 500 Index performance. The key points are the high Win Rates for nine months and above and the above-average median returns, even though investors were overwhelmingly expecting the opposite.
The table below displays returns following all of the months highlighted with a red dot in the chart above. There are two things to note:
- The (mainly) consistently solid returns nine months and out after a signal
- The "fly in the ointment" - i.e., some negative returns during the first six months following several signals, particularly following the June 2008 signal
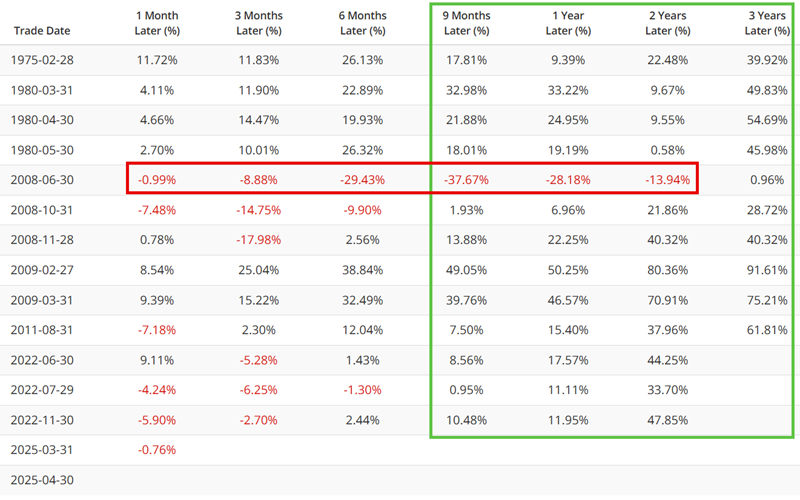
Nevertheless, the key takeaways are:
- This "signal" is intended to be used as "weight of the evidence" and not as an "automatic" buy signal
- Results are a far cry from what the "masses" were expecting at the time of the signal, given the abnormally low level of consumer confidence
An extreme take on consumer sentiment
For the next test, we will highlight only those times when the U of M Consumer Confidence index crossed below 56 for the first time in six months. This eliminates a number of the overlapping signals in the previous test. The chart below highlights the rare occasions when this signal was triggered. Note that the most recent signal occurred at the end of April 2025.
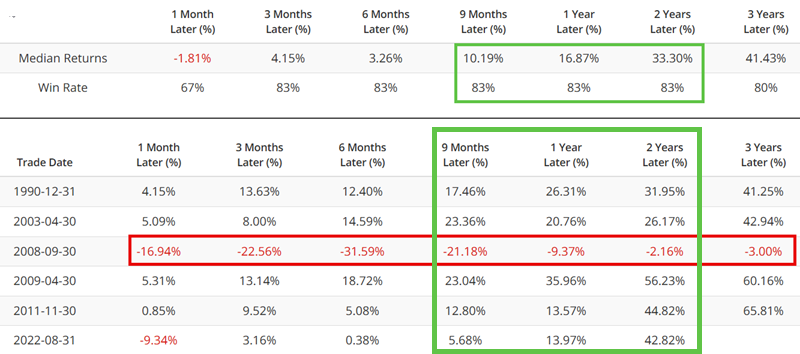
The tables below summarize subsequent S&P 500 performance and show results signal-by-signal.
There were several not insignificant declines during the three months after three of the four previous signals. But the good news is the 100% Win Rate for all timeframes, six months and out. However, the small sample size is a concern and should be noted, and it is worth mentioning that the results shown above do not guarantee that the April 2025 signal will fare as well.
The Consumer Confidence - Stocks Down indicator has also reached an extreme
According to a monthly survey from the Conference Board, this indicator shows the net percentage of consumers expecting stocks to decrease. As the chart below shows, this indicator has also reached an extreme level of investor bearishness towards stocks.
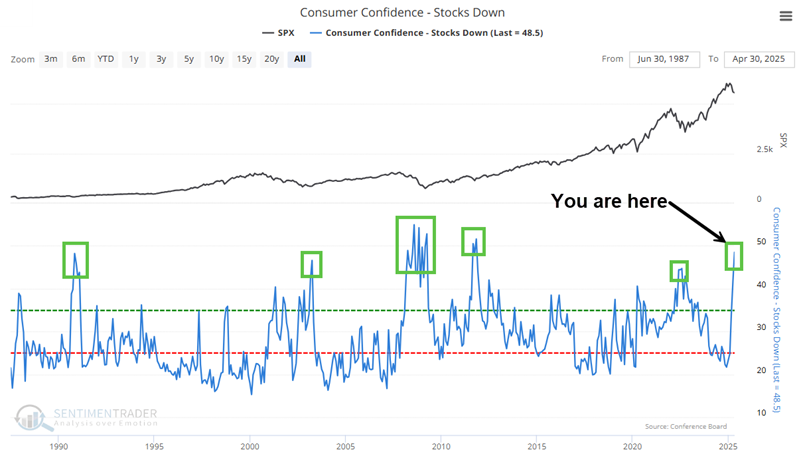
This is another sign of rampant fear among the investing public. While this type of action does not tell you exactly when the market might turn around, it does offer a strong clue that a turnaround is in the offing.
The chart below highlights those months when the indicator crossed below 44 for the first time in six months.
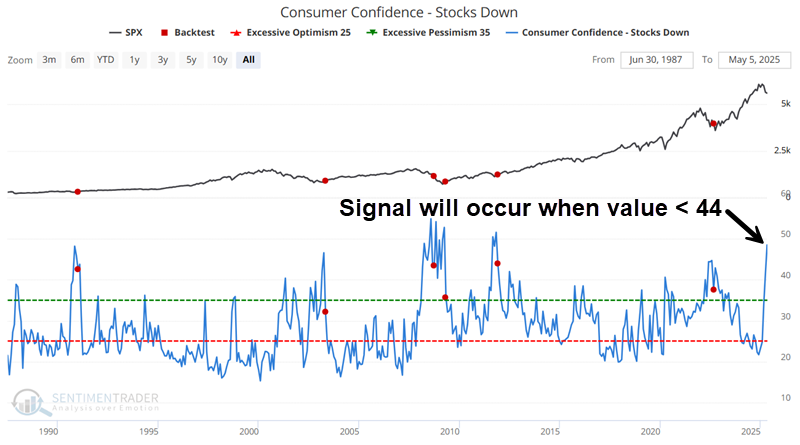
The tables below summarize subsequent S&P 500 performance and show results signal-by-signal.
One more time, we see the overly bearish crowd typically being confounded and taken by surprise by a market rally when they were expecting a decline, once again, with the notable exception of the continued decline following the late 2008 signal. In any event, we will watch closely for the next time the Consumer Confidence - Stocks Down indicator drops below 44.
What the research tells us…
There is a reason we focus so much attention on sentiment indicators. Regardless of any changes in the marketplace, human nature (i.e., fear and greed) remains the one thing that never changes. Anytime we can identify an extreme in investor psyche, there is a very good chance it is telling us to start looking in the opposite direction.