
Conflicting Signals High-Yield Bond Market

Key points
- Since HYG triggered the Oscillator repair signal, it has conflicted with bullish and bearish signals.
- After the panic low in October, HYG has shown insufficient follow-through in its movement, and supporting evidence such as seasonal patterns points in inconsistent directions.
- Since the failure of conventional backtests, the market may see a short-term rebound but faces high mid-term risks, with significantly increased uncertainty.
"Anomalies" Under Conventional Logic
On October 27, the high-yield bond market witnessed a technical shift - the High Yield McClellan Oscillator completed a repair cycle from the <-60 range to above 0.
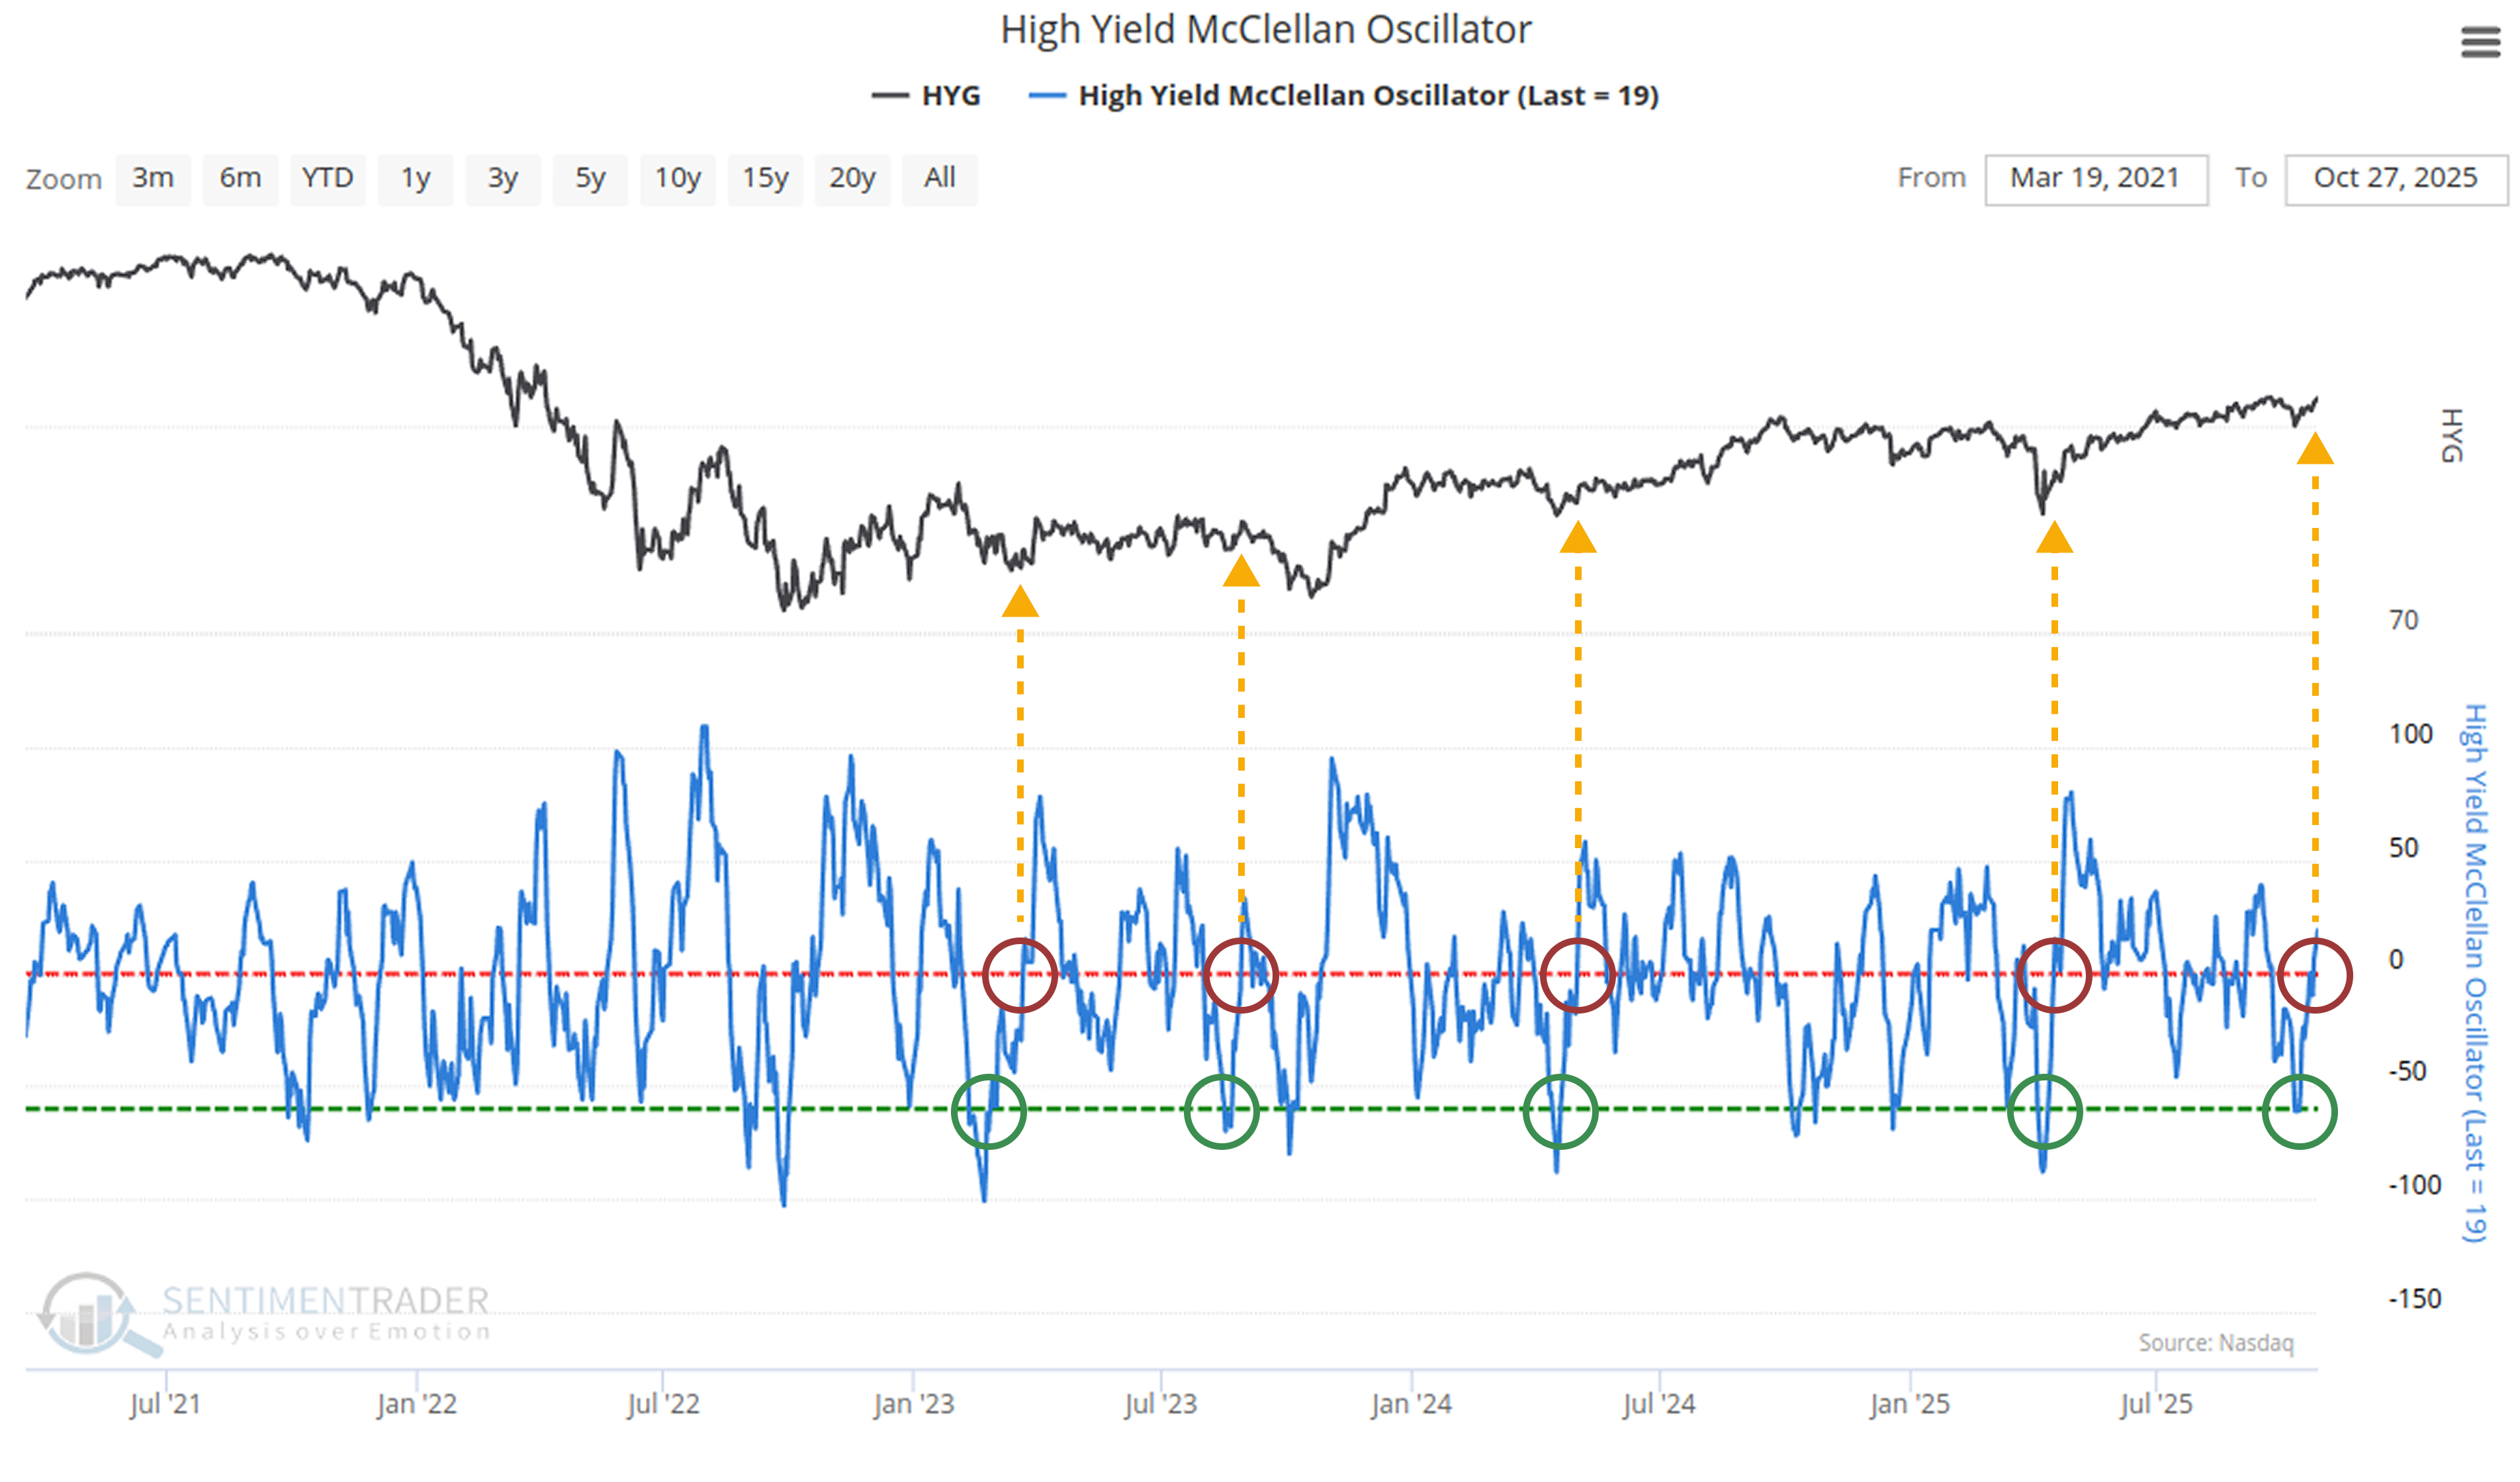
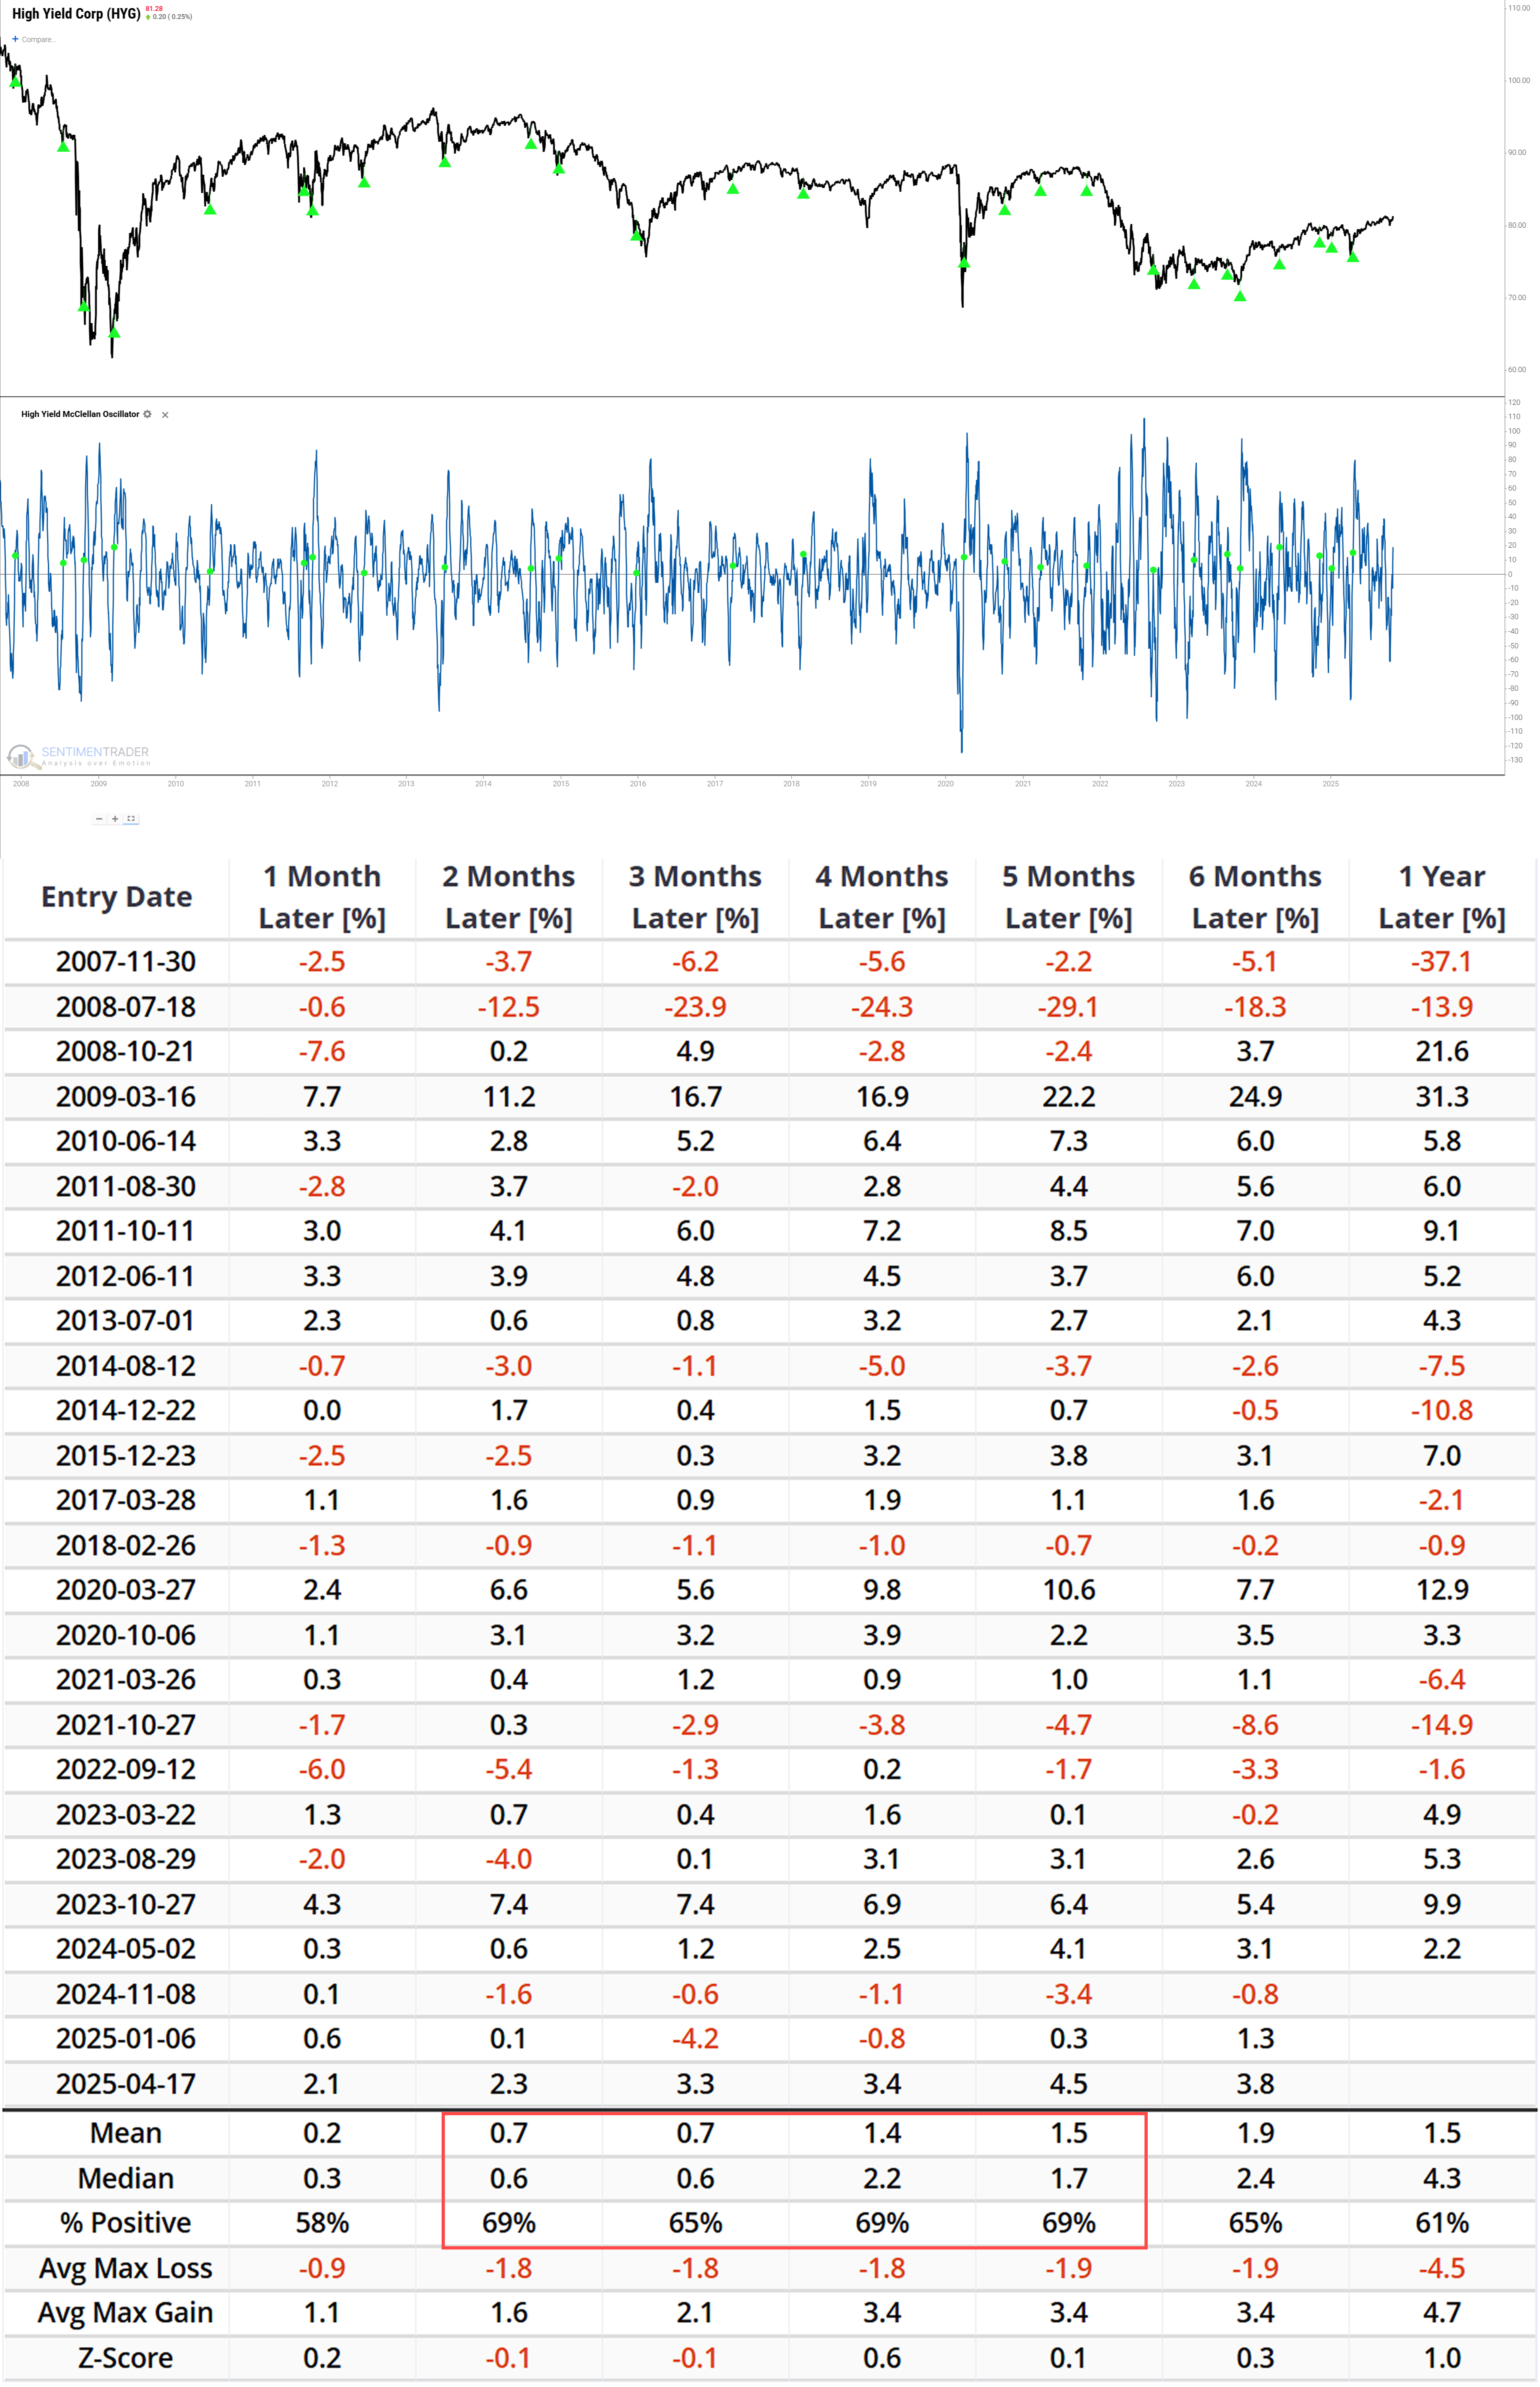
In usual market conditions, this shift is often regarded as a reference sign for the end of panic selling. Based on historical data, after the 26 similar repair events in the past, the probability of market gains within 2-5 months reached 69%.Related Backtest Click Here.
However, the current market environment has diminished the guiding significance of this signal. It coincides with the simultaneous activation of two rare, opposing signals, making conventional analytical logic no longer applicable.
Conflict Between Two Rare Signals
The core issue in the current market lies in the simultaneous activation of two rare signals with small sample sizes.
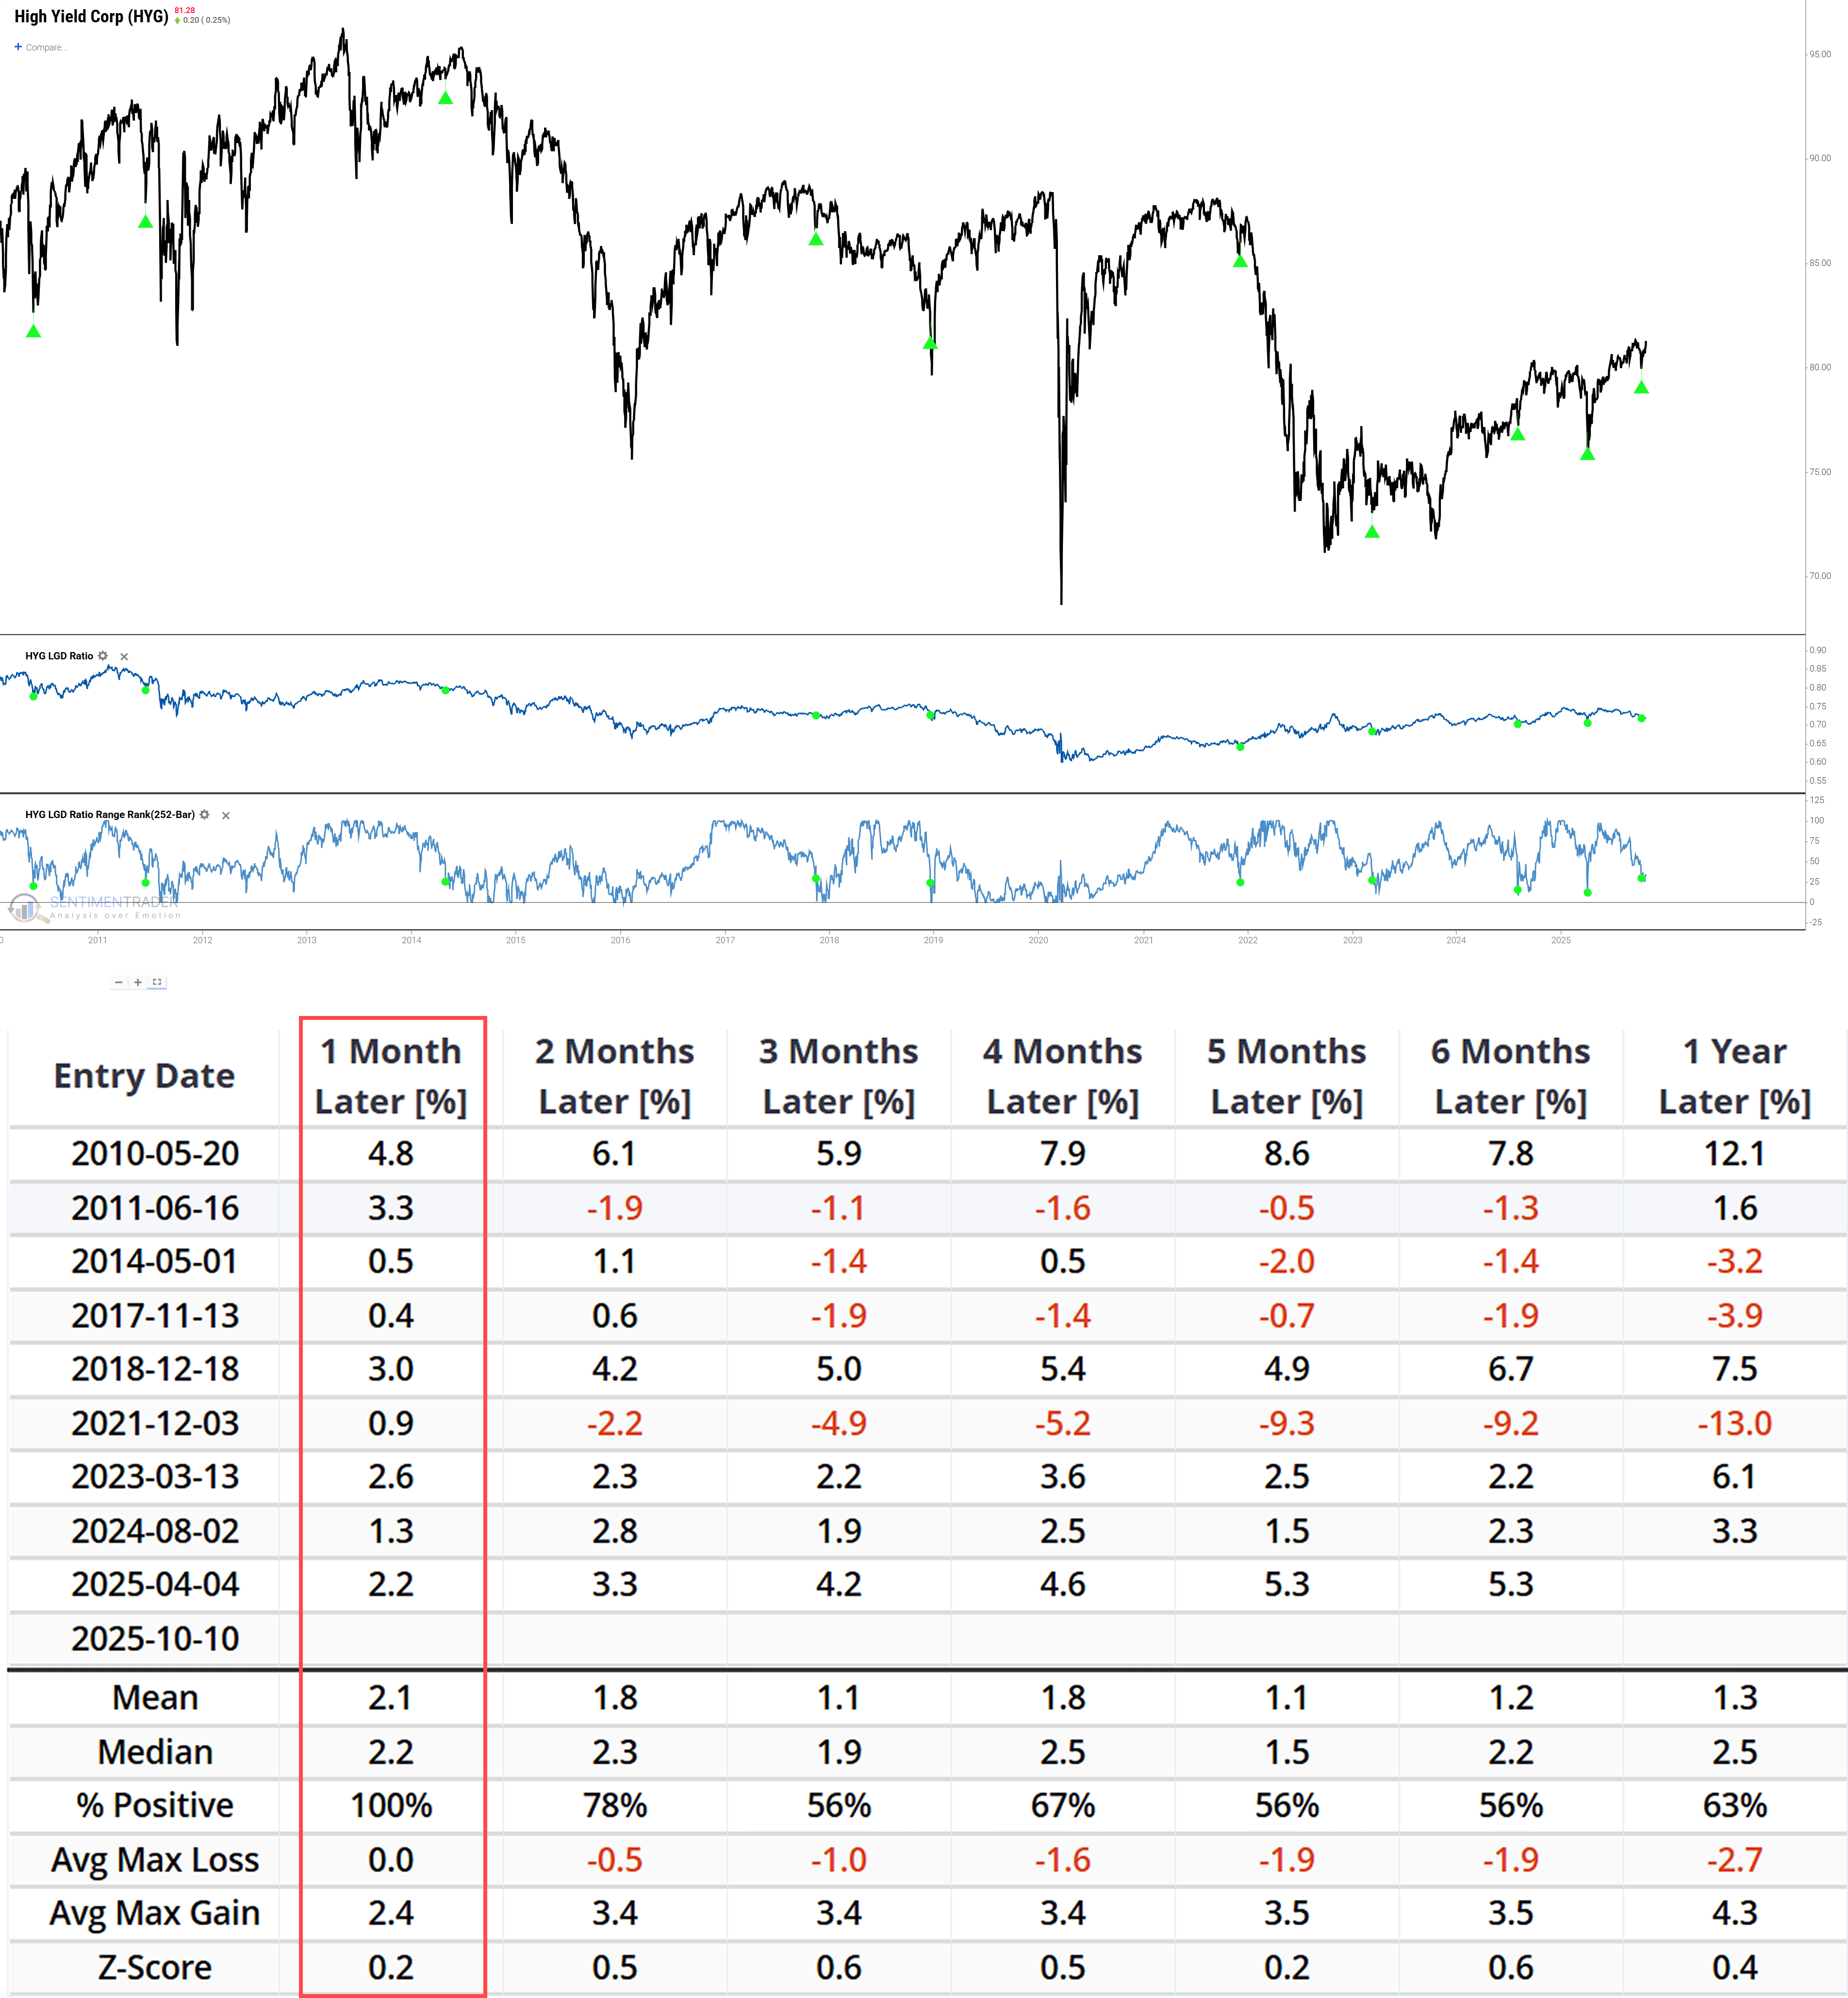
One is the "panic capitulation" signal triggered on October 10: at that time, the HYG/LQD ranking plummeted directly from >95 to <30. This signal has only appeared 9 times in history, and the market recorded gains within 1 month after each trigger. It is still within the signal's validity period.Related Backtest Click Here.
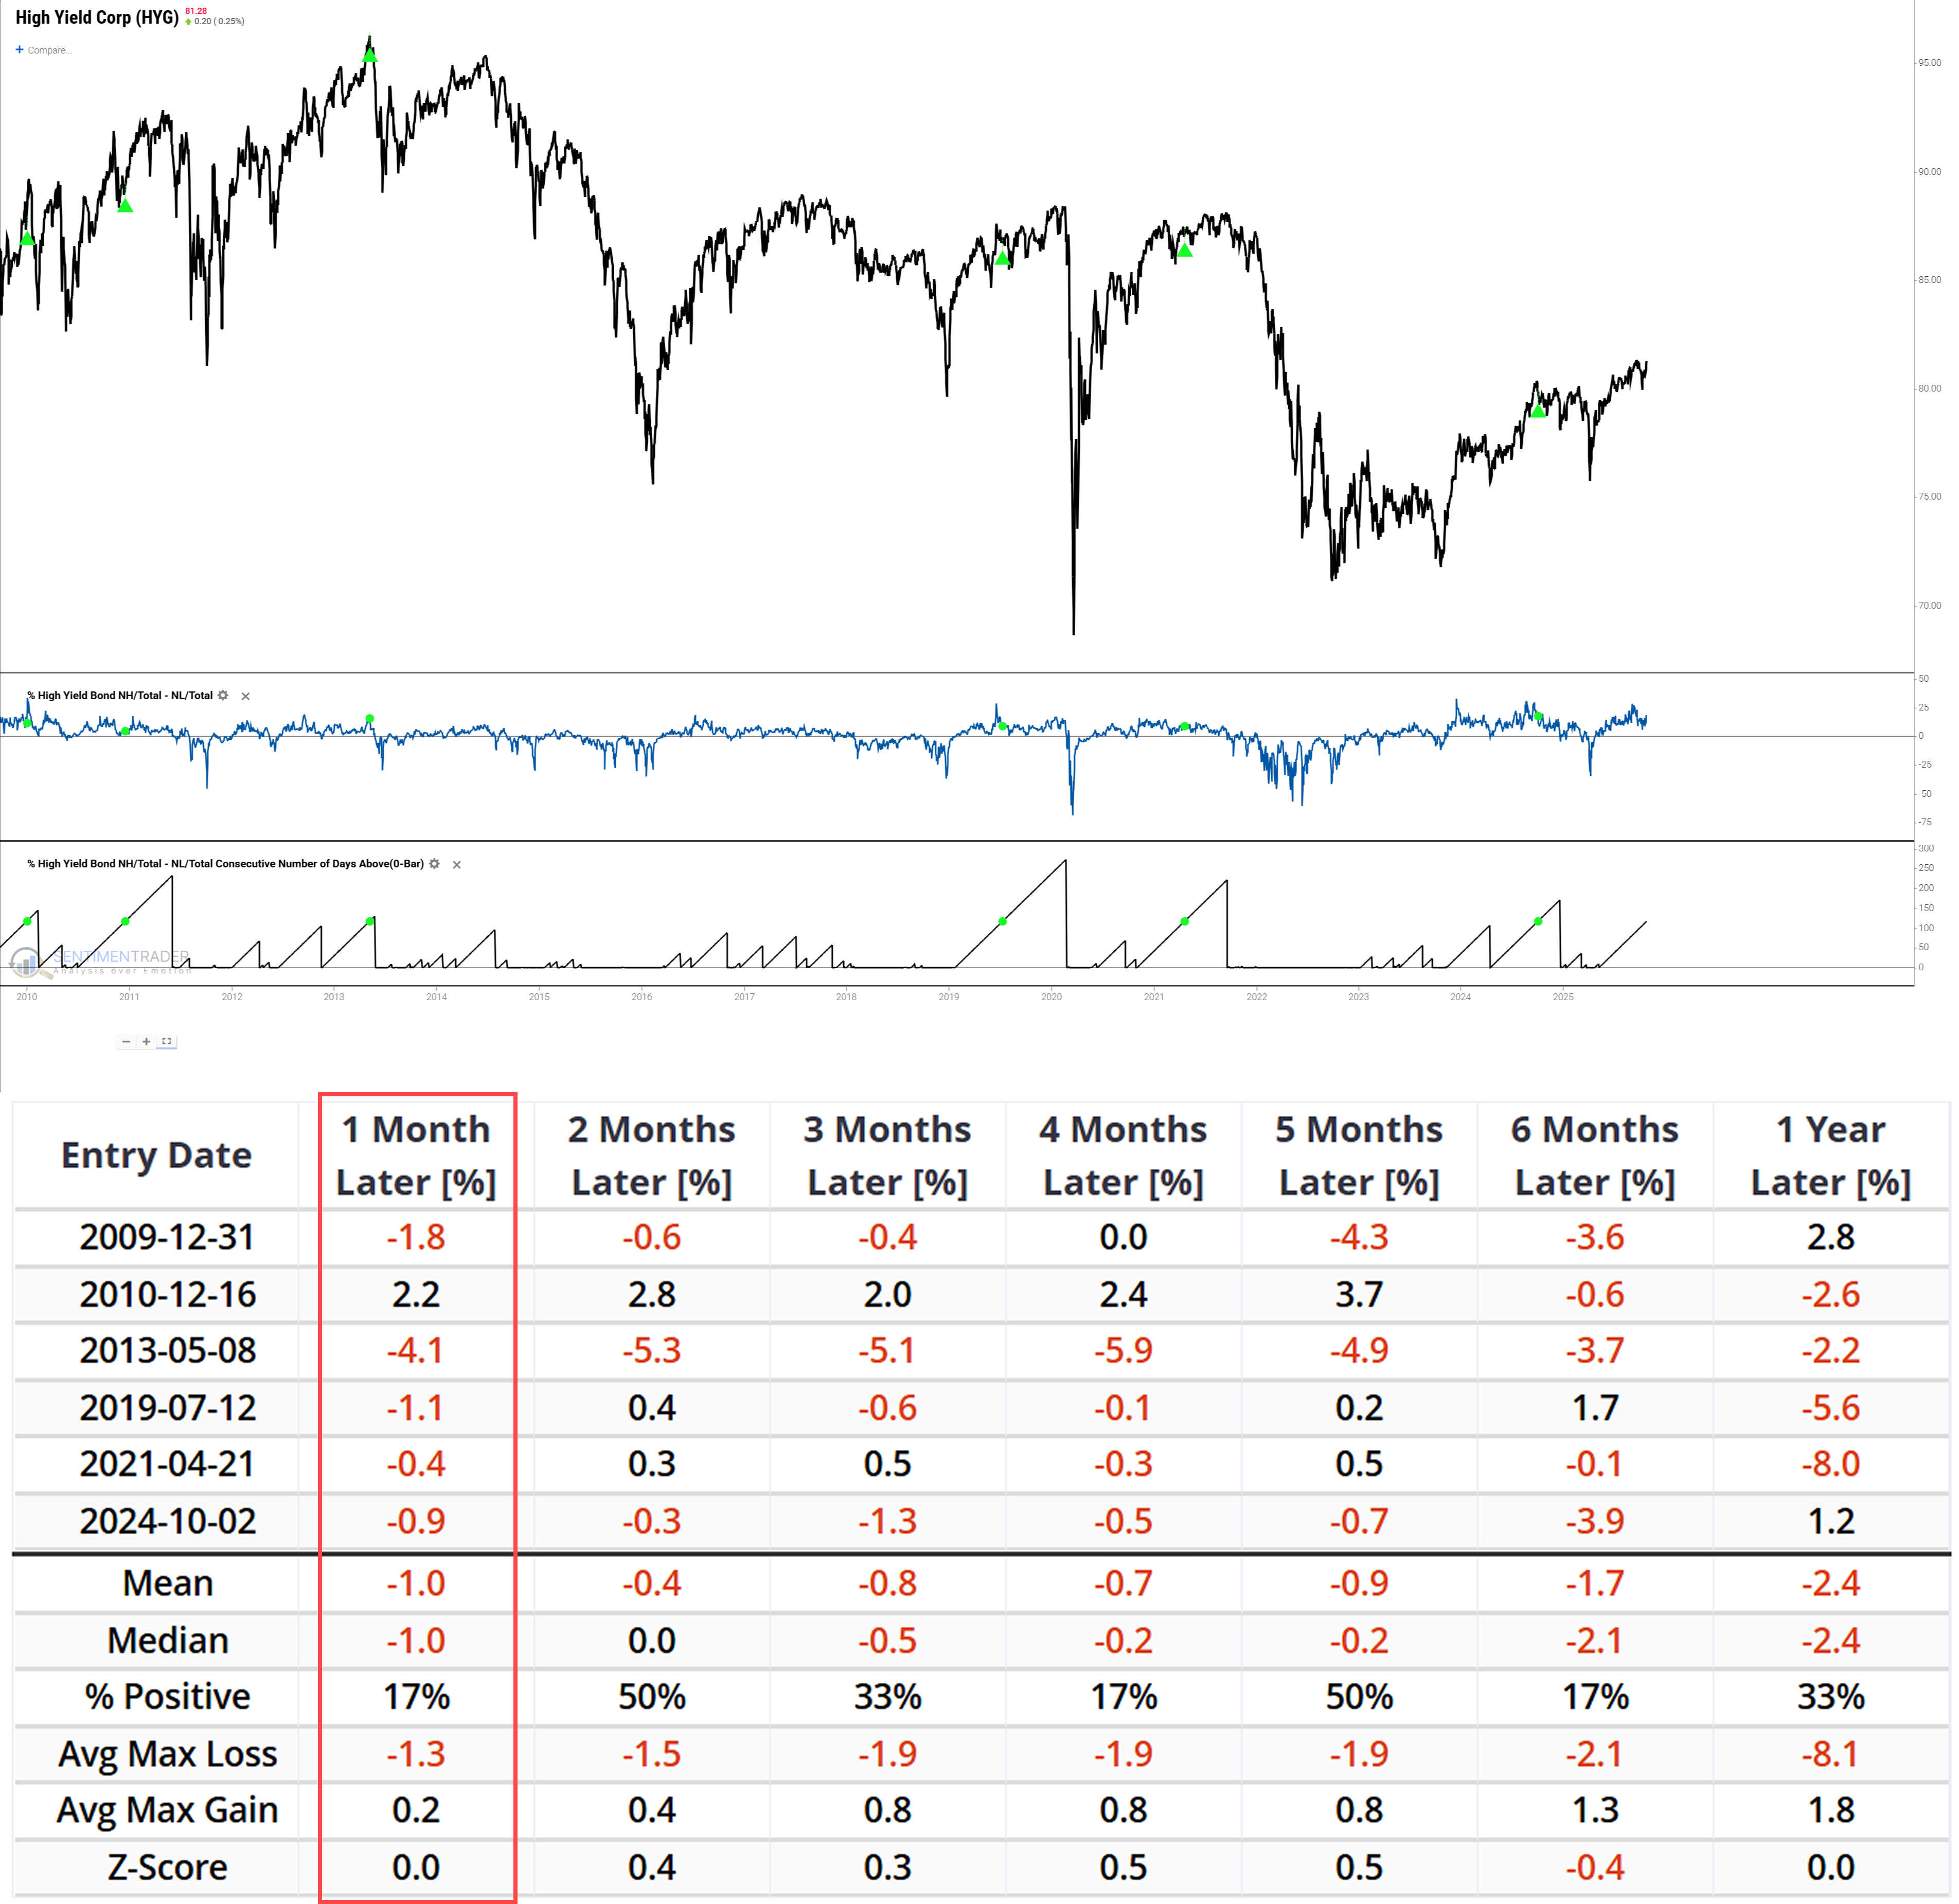
The other is the "long-term exuberance" signal that has persisted for 116 days, i.e., the state where % NH-NL > 0. This signal is even rarer, having appeared only 6 times. Historical data shows that after its trigger, the probability of market gains within 1-6 months was only 17%, with an overall downward trend.Related Backtest Click Here.
Additional Signals
To resolve the dilemma of conflicting signals, we attempted to find clues from other dimensions, but these "supporting evidence" also present contradictory views.
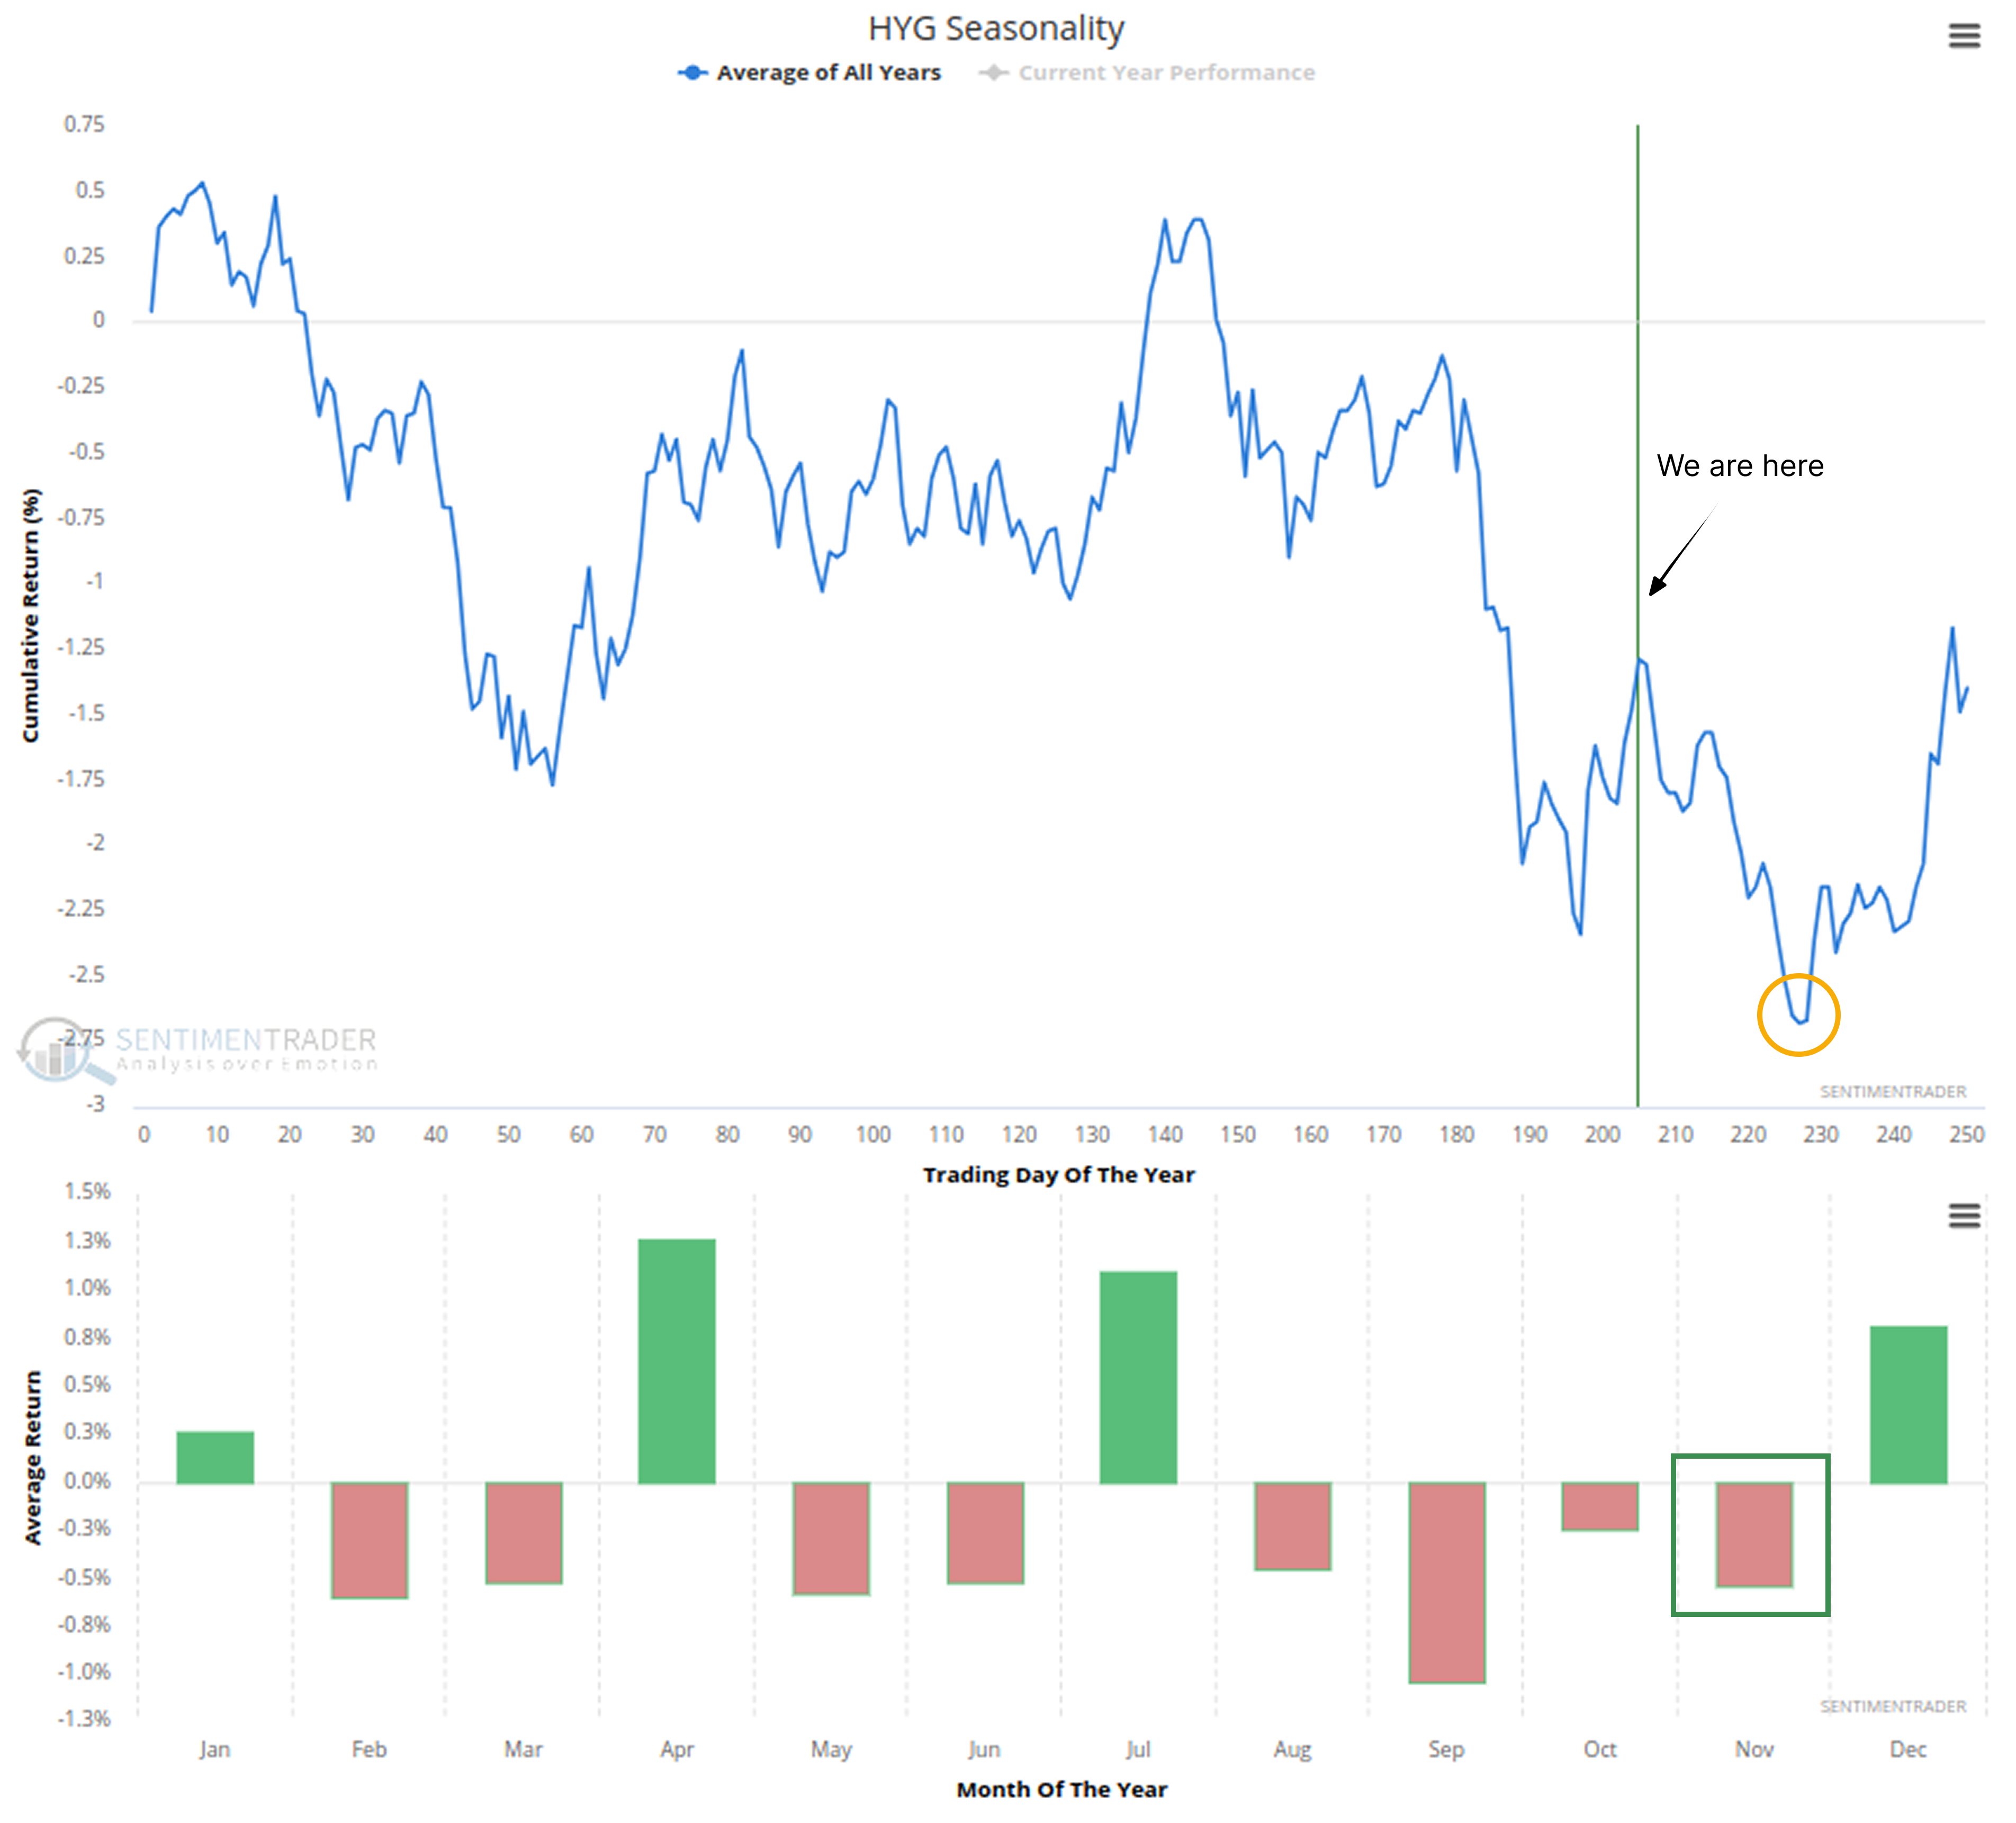
From the perspective of seasonal patterns, historical data on high-yield bonds shows that the market usually tends to weaken in the next month (by the end of November). This pattern aligns with the bearish logic of the "long-term exuberance" signal, further reinforcing the mid-term downside risks.
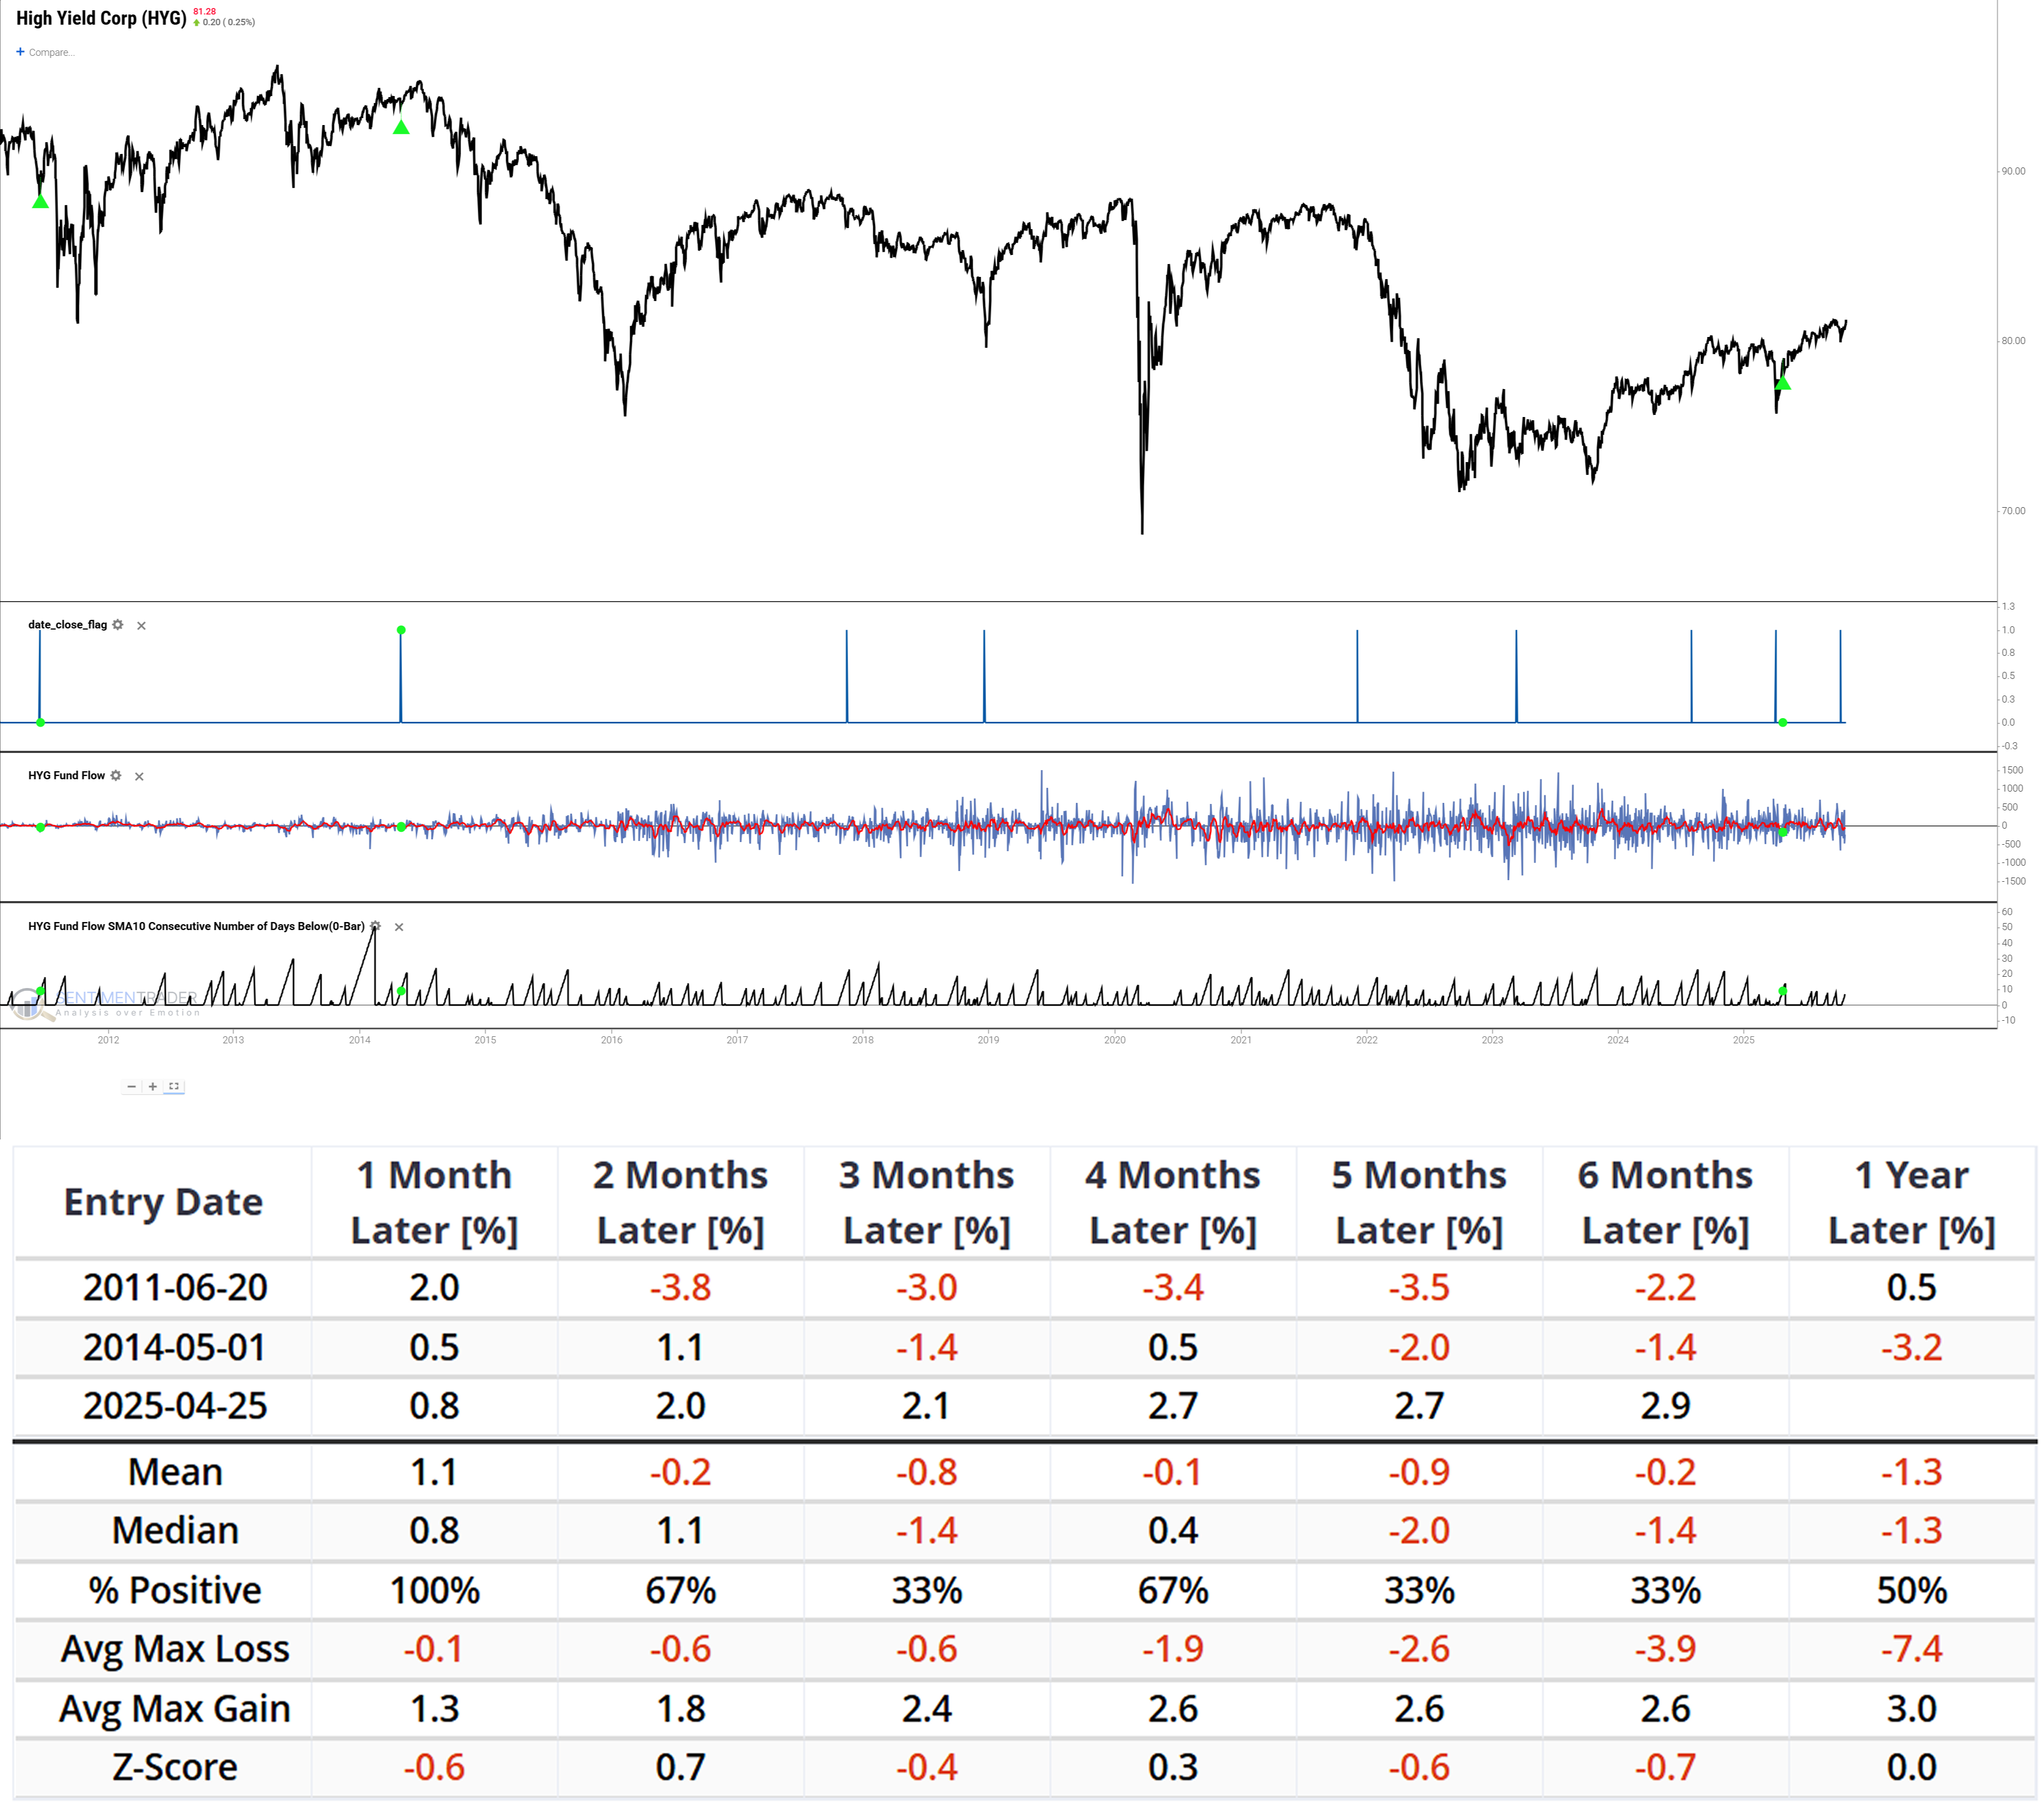
Another small-sample backtest is worth noting: the combination of "panic capitulation signal + deteriorating fund flows (10-day moving average of Fund Flow < 0)" has only occurred 3 times in history.
In all 3 cases, the market rebounded within 1 month, but the probability of gains dropped sharply to 33% after 3-6 months, showing the characteristic of "a short-term rebound followed by rapid weakness".
However, it must be clarified that the sample size of 3 is far too small; this can only indicate "the possibility of such a path" and cannot serve as a reliable basis for prediction.Related Backtest Click Here.
What the Research Tells Us...
From the trigger of the October signals to the present, the movement of the high-yield bond market has centered around the "signal conflict": the bullish signal has not expired, yet the market movement fails to keep up; the bearish signal has a clear historical direction but contrasts with the strength of the stock market; supporting evidence is either contradictory or based on insufficient sample sizes. In this situation, any high-certainty prediction lacks adequate data support.
Objectively speaking, in the short term (1-2 weeks), the market may stage a technical rebound driven by the lingering impact of the "panic capitulation" signal. However, in the mid term (1-3 months), the "long-term exuberance" signal, seasonal weakness, and the current "insufficient follow-through" movement all point to higher downside risks.
This is not intended to provide a specific judgment on market ups and downs, but rather to sort out the core contradictions in the current market. After all, there has never been a similar combination of signals in history, and there are inherently multiple possible paths for the future. For market participants, the most prudent choice now is to fully recognize the reality of "high uncertainty", respond cautiously to every decision, and not bet on a specific direction.