Products
SentimenTrader Trading Tools
‍
Backtest Engine
My Trading Toolkit
Correlation Analysis
Seasonality
Market Prediction
Indicators & Data API
‍
Proprietary Indicators & Charts
Market Data API
Strategies & Scanner
‍
50+ Trading Strategies
Smart Stock Scanner
Smart Option Scanner
Research Reports
‍
Research Solutions
Reports Library
Free Resources
Simple Backtest Calculator
Simple Seasonality Calculator
The Kelly Criterion Calculator
Sentiment Geo Map
Public Research Reports
Education
Sentiment Indicators
Technical Indicators
Pricing
Company
About
In the News
Testimonials
Client Success Stories
Contact
Log inLoginSign up
< BACK TO ALL REPORTS

Companies that haul stuff haven't had a run like this in 120 years

Jason Goepfert
2021-05-04
Last week, the Dow Jones Transportation Average notched its 13th straight week of gains, its longest in more than 120 years.

Even in a market that can't seem to go down for more than a couple of days, one index stands out. Among all major indexes and sectors, few can match the persistence of stocks that haul stuff.

The Dow Jones Transportation Average just completed its 13th straight week with a gain. None of them were tremendous, but the persistence is incredible.

The Transports set a 122-year record for weekly persistence a couple of weeks ago. Last week just added to the gains. 

Dow Transports 13 weeks gain

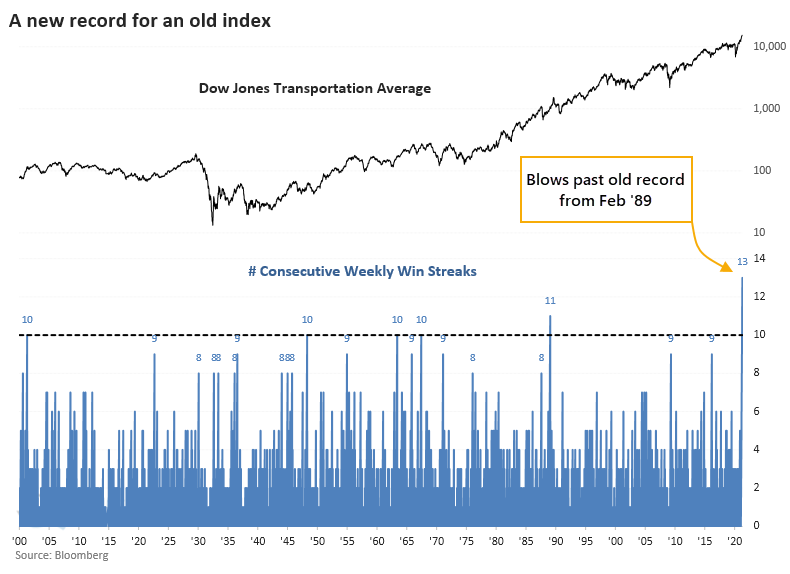
There weren't many streaks of 10 weeks of gains or longer, only 5 others when the index was trading at a 52-week high. So we're dealing with a tiny sample size and all the challenges it brings with it if trying to form any conclusion. 

The handful of times Transports managed to do this, forward returns were sketchy over the next 6-24 months. Only 1 out of the 5 other signals managed to show a profit even 2 years later. 

Stat Box

Over the past 5 days, an average of more than $2 billion per day has flowed into the S&P 500 fund, SPY. That's among the largest amounts in 5 years. But according to our Backtest Engine, out of the 22 other days that saw extreme inflows, SPY was still higher a month later after 14 of them, averaging 2.0%.


What else we're looking at

  • Full returns in Dow Transports and Industrials since 1900 after 10-week streaks of gains
  • What sectors and factors did best after long positive streaks in Transports
  • A detailed update on absolute and relative trends in sector, industry, and country ETFs
  • What happens when many stocks in the S&P 1500 are overbought
PRODUCTS
SentimenTrader
Trading Tools
Indicators & Data API
‍
Strategies & Scanner
‍
Research Reports
FREE
RESOUrCES
Simple Backtest
Calculator
Simple Seasonality
Calculator
The Kelly Criterion
Calculator
Sentiment Geo Map
‍
Public Research Reports
‍
Education
Sentiment Indicators
‍
Technical Indicators
‍
Pricing
Bundle pricing
‍
FAQ
‍
Announcements
‍
COMPANY
‍
About
‍
In the News
‍
Testimonials
‍
Client Success Stories
CONTACT
‍
General Inquiries
‍
Media Inquiries
‍
Financial Professionals Inquiries
‍
© 2026 Sundial Capital Research Inc. All rights reserved.
Setsail Marketing
TermsPrivacyAffiliate Program
Risk Disclosure: The information and tools provided are for research and analytical purposes only and are not intended as investment advice. Market analysis involves uncertainty, and outcomes may differ from expectations. Users should conduct their own due diligence and consider their individual circumstances before making any financial decisions. Past performance is not necessarily indicative of future results.

Hypothetical Performance Disclosure: Hypothetical performance results have many inherent limitations, some of which are described below. No representation is being made that any account will or is likely to achieve profits or losses similar to those shown; in fact, there are frequently sharp differences between hypothetical performance results and the actual results subsequently achieved by any particular trading program. One of the limitations of hypothetical performance results is that they are generally prepared with the benefit of hindsight. In addition, hypothetical trading does not involve financial risk, and no hypothetical trading record can completely account for the impact of financial risk of actual trading. for example, the ability to withstand losses or to adhere to a particular trading program in spite of trading losses are material points which can also adversely affect actual trading results. There are numerous other factors related to the markets in general or to the implementation of any specific trading program which cannot be fully accounted for in the preparation of hypothetical performance results and all which can adversely affect trading results.

Testimonial Disclosure: Testimonials appearing on this website may not be representative of other clients or customers and is not a guarantee of future performance or success.