
Commodity Participation

The breadth of participation for a basket of 21 commodities remains strong. The advance from the pandemic lows looks similar to other post-recession periods.
Let's take a look at a few charts I'm watching.
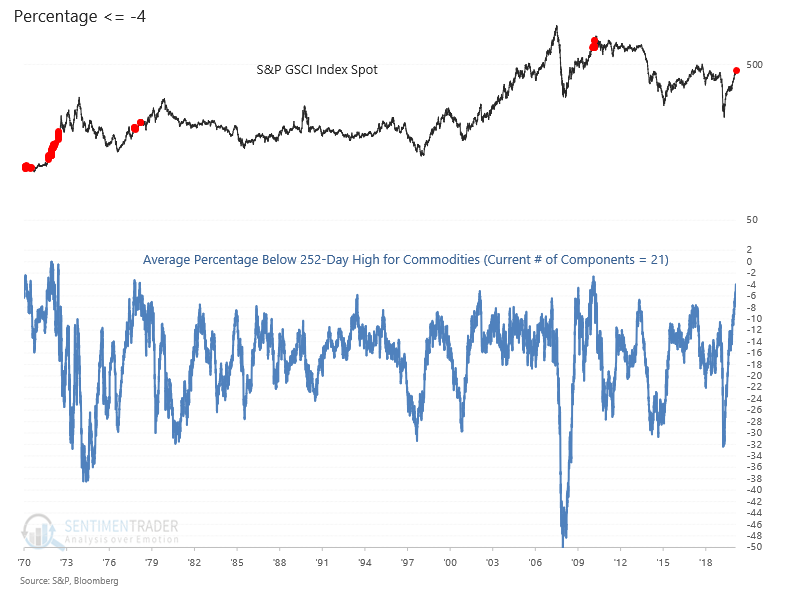
Average Percentage Below 252-Day High
The chart below shows the average percentage below a 252-day high for a basket of 21 commodities. The indicator just registered a new cycle high on 2/9/21 by crossing above the -4.0% level. One has to go back to March 2011 to find the last time this indicator showed a -4.0% or lower level.
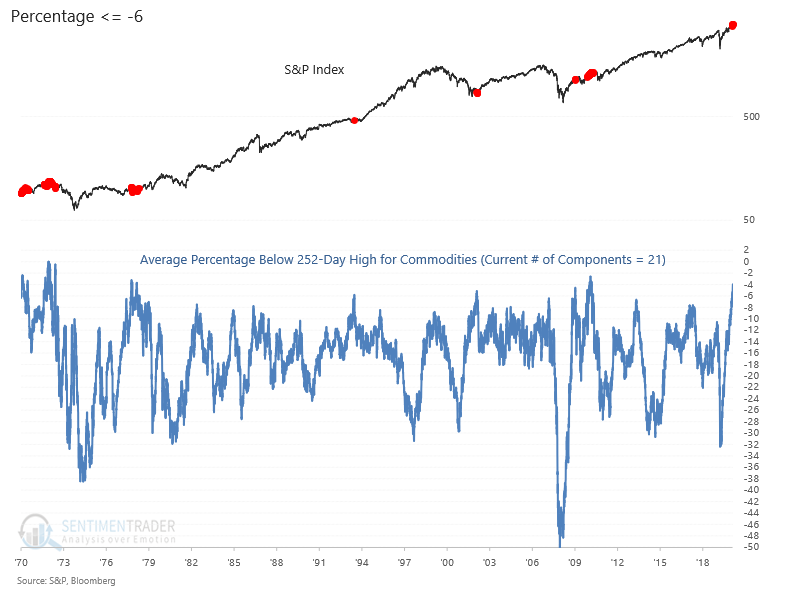
Let's take a look at the same indicator and plot it with the S&P 500 Index. I modified the threshold level to -6% to show a few more instances.
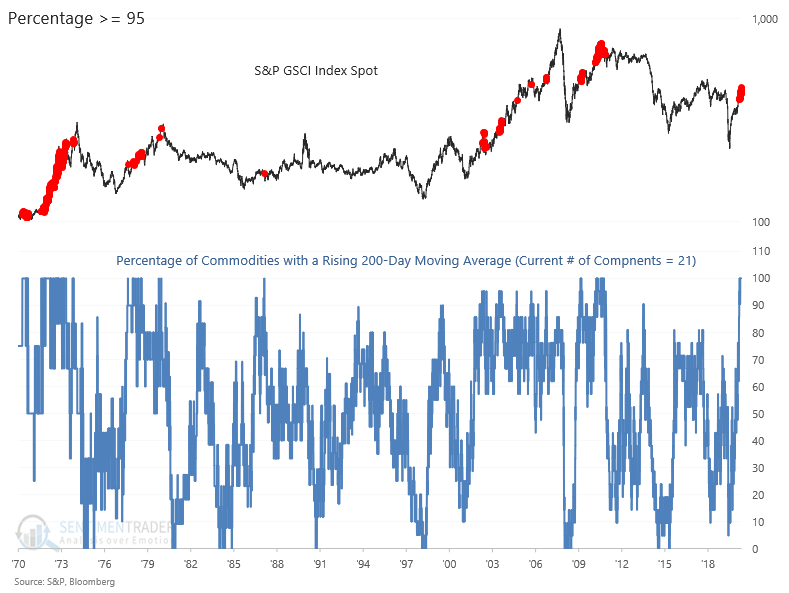
Commodity Participation Rising 200-Day MA
Before the most recent instance on 12/18/20, one has to go back to November 2009 to find the last time this indicator reached 100% after a reset below 15%.
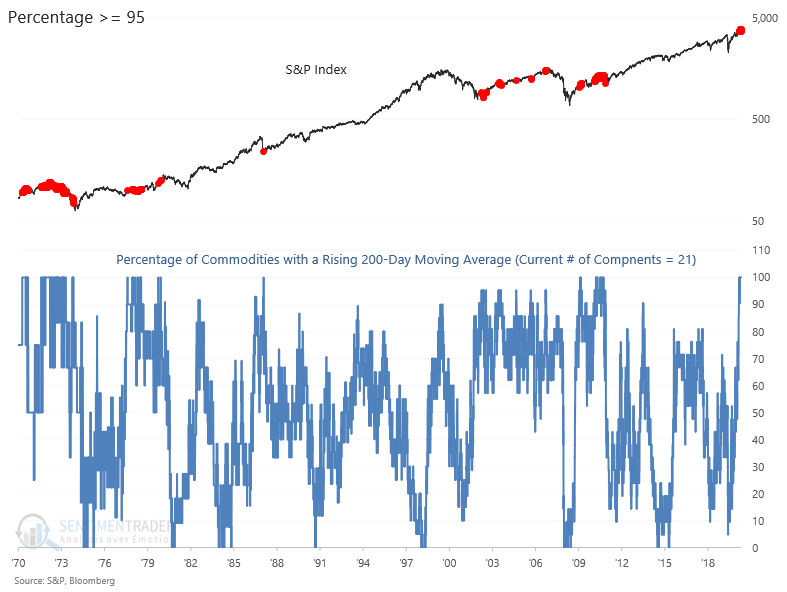
Commodity Participation Rising 200-Day MA SPX Chart
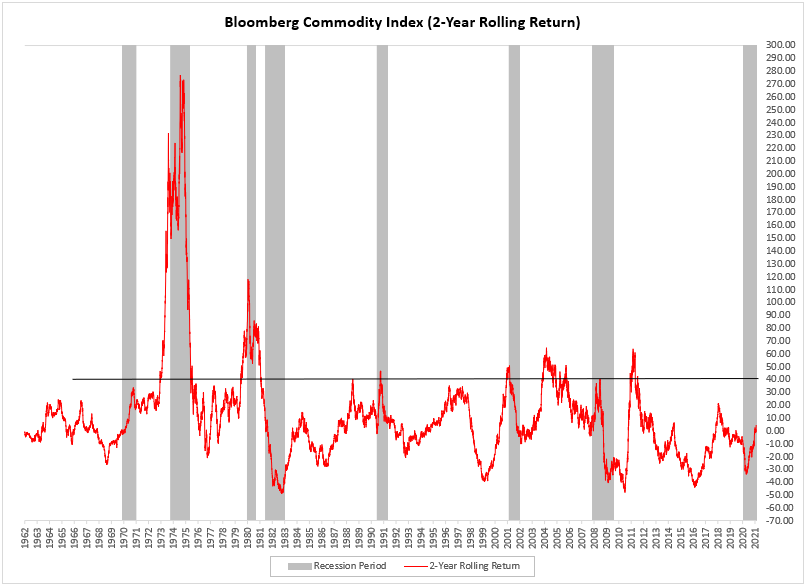
Rolling Return Post Recession Level
If we look at the 2-year rolling return for the Bloomberg Commodity Index, it's not uncommon for the measure to reach the +30-40% range on the rolling return post a recession period. The level currently resides at 4.63%.
Source: Bloomberg