Products
SentimenTrader Trading Tools
‍
Backtest Engine
My Trading Toolkit
Correlation Analysis
Seasonality
Market Prediction
Indicators & Data API
‍
Proprietary Indicators & Charts
Market Data API
Strategies & Scanner
‍
50+ Trading Strategies
Smart Stock Scanner
Smart Option Scanner
Research Reports
‍
Research Solutions
Reports Library
Free Resources
Simple Backtest Calculator
Simple Seasonality Calculator
The Kelly Criterion Calculator
Sentiment Geo Map
Public Research Reports
Education
Sentiment Indicators
Technical Indicators
Pricing
Company
About
In the News
Testimonials
Client Success Stories
Contact
Log inLoginSign up
< BACK TO ALL REPORTS

Commodities doldrums may last a bit longer

Jay Kaeppel
2022-10-17
The commodity sector was red-hot for almost two years. Since June, the sector has cooled off. While persistently high inflation makes a commodity sector snapback possible, seasonality strongly suggests that this cooling-off period may last a bit longer.

Key points:

  • The commodity sector is a very diverse group, each contract having its own supply and demand fundamentals
  • There are still times of the year when commodities as an asset class tend to move decisively in one direction
  • The weakest time of the year by far is now upon us

Seasonal headwinds for the commodity sector

Commodities were red-hot from mid-2020 into June 2022 but have since cooled off. Near the end of September, Dean noted the rapid deterioration in commodity trends. Seasonality now suggests the possibility of a continuation of the recent cooling off in the commodity sector.

Each commodity has its supply and demand factors that drive price. Still, it is not uncommon for the entire commodity sector to move persistently in one direction or the other, and it has now entered the weakest time of year.

The chart below displays the annual seasonal trend for the CRB Index - an index comprised of 19 commodities.

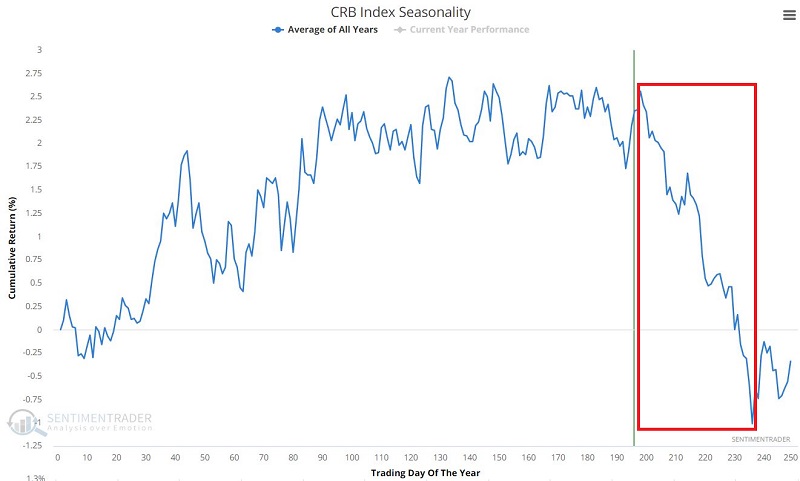
The period between Trading Day of Year (TDY) #198 and TDY #236 is clearly the most unfavorable time of year. For 2022 this period extends from the close of October 14 through the close of December 8.

The chart below shows the cumulative percentage performance of the CRB Index during this unfavorable period since 1994.

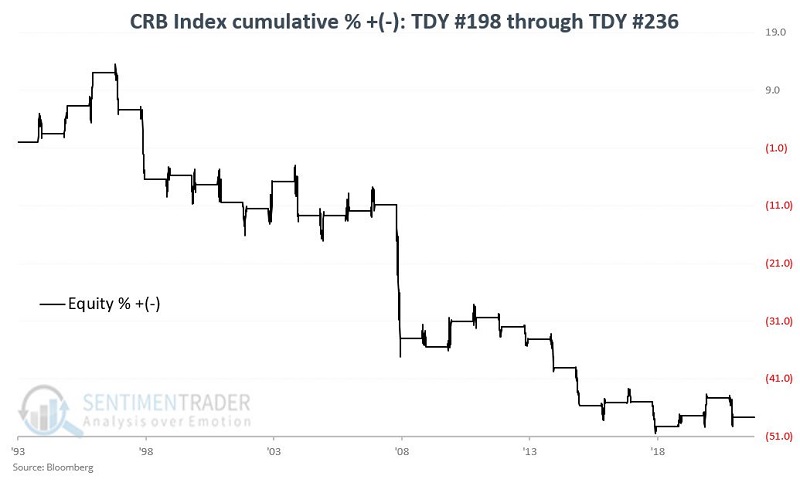
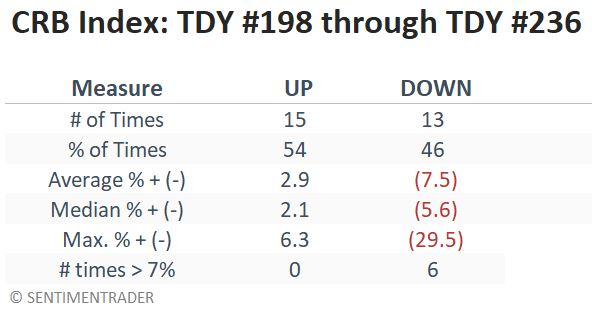
Over these 28 years, the CRB Index was positive 15 times and negative 13 times, but the up years tended to show modest gains, while the down years often suffered significant losses. It endured a loss of over -7% on six occasions; there were no gains greater than +6.3%.

The bottom line seems to be that a trader must have a compelling reason to hold long commodities during this period, given the unfavorable reward-to-risk ratio.

Results are similar using a commodity ETF

The CRB Index is not a tradable security. So, to look at real-world results, let's replace the CRB Index with the Invesco DB Commodity Tacking Fund (ticker DBC).

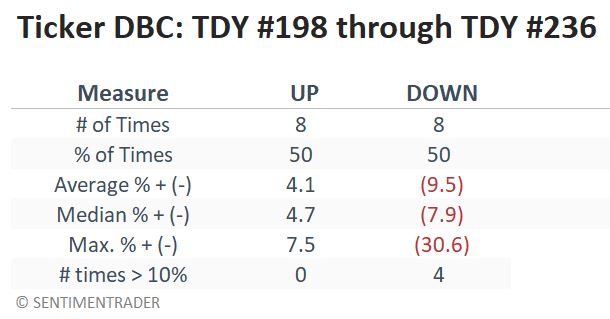
The chart below displays the cumulative percentage performance of DBC during this unfavorable seasonal period since it started trading in 2006.

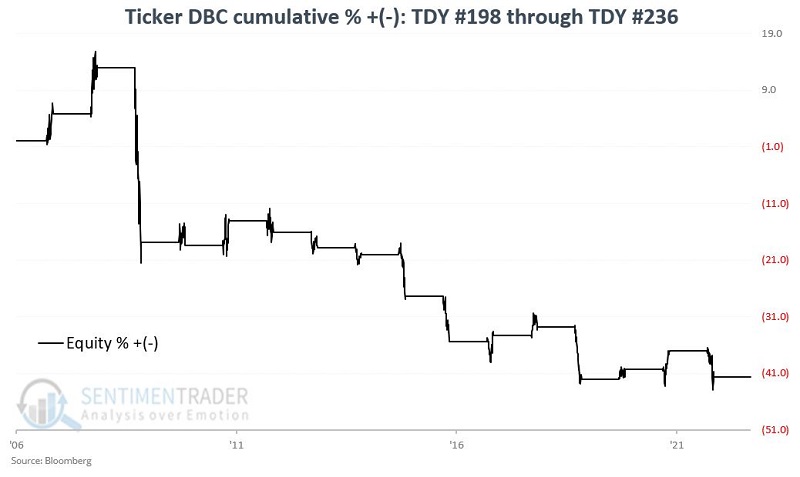
The table shows that DBC had a 50% win rate, but again, the losses during the down years tended to swamp the gains during the up years.

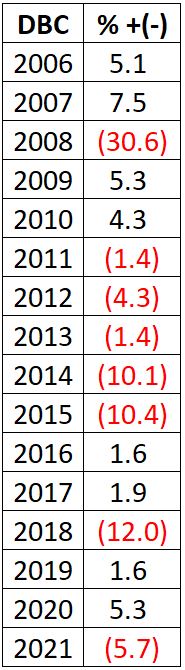
The table below displays the year-by-year returns for DBC during these seasonal stretches.

What the research tells us…

Do the results above suggest we rush out and sell short every commodity we can get our hands on? Not necessarily,  because history shows that the likelihood of a drop is roughly equal to a coin flip. On the one hand, if commodities trend lower in the weeks ahead, the decline could be substantial. The real message in the data is that there may be better places to allocate capital than commodities between now and early December.

PRODUCTS
SentimenTrader
Trading Tools
Indicators & Data API
‍
Strategies & Scanner
‍
Research Reports
FREE
RESOUrCES
Simple Backtest
Calculator
Simple Seasonality
Calculator
The Kelly Criterion
Calculator
Sentiment Geo Map
‍
Public Research Reports
‍
Education
Sentiment Indicators
‍
Technical Indicators
‍
Pricing
Bundle pricing
‍
FAQ
‍
Announcements
‍
COMPANY
‍
About
‍
In the News
‍
Testimonials
‍
Client Success Stories
CONTACT
‍
General Inquiries
‍
Media Inquiries
‍
Financial Professionals Inquiries
‍
© 2026 Sundial Capital Research Inc. All rights reserved.
Setsail Marketing
TermsPrivacyAffiliate Program
Risk Disclosure: The information and tools provided are for research and analytical purposes only and are not intended as investment advice. Market analysis involves uncertainty, and outcomes may differ from expectations. Users should conduct their own due diligence and consider their individual circumstances before making any financial decisions. Past performance is not necessarily indicative of future results.

Hypothetical Performance Disclosure: Hypothetical performance results have many inherent limitations, some of which are described below. No representation is being made that any account will or is likely to achieve profits or losses similar to those shown; in fact, there are frequently sharp differences between hypothetical performance results and the actual results subsequently achieved by any particular trading program. One of the limitations of hypothetical performance results is that they are generally prepared with the benefit of hindsight. In addition, hypothetical trading does not involve financial risk, and no hypothetical trading record can completely account for the impact of financial risk of actual trading. for example, the ability to withstand losses or to adhere to a particular trading program in spite of trading losses are material points which can also adversely affect actual trading results. There are numerous other factors related to the markets in general or to the implementation of any specific trading program which cannot be fully accounted for in the preparation of hypothetical performance results and all which can adversely affect trading results.

Testimonial Disclosure: Testimonials appearing on this website may not be representative of other clients or customers and is not a guarantee of future performance or success.