
Commodities and the Macro Index Model

Key points
- Our Macro Index Model continues to improve
- One little-understood relationship is that between macro-economic factors and commodities
- While not intended as a standalone trade model, the latest reading is favorable for commodities
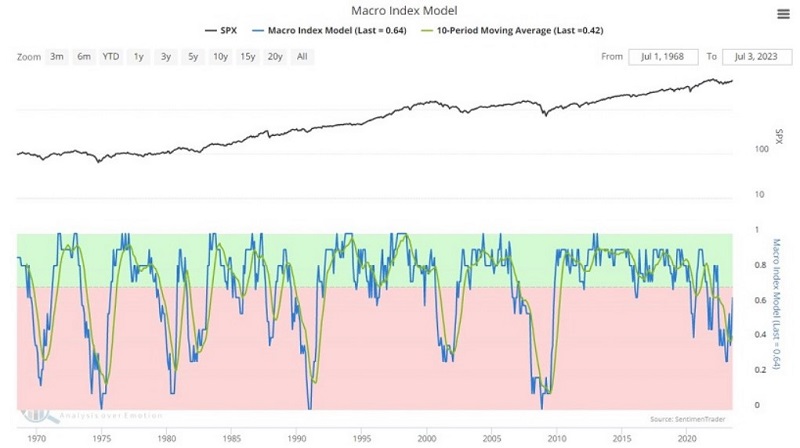
The latest trend in the Macro Index Model
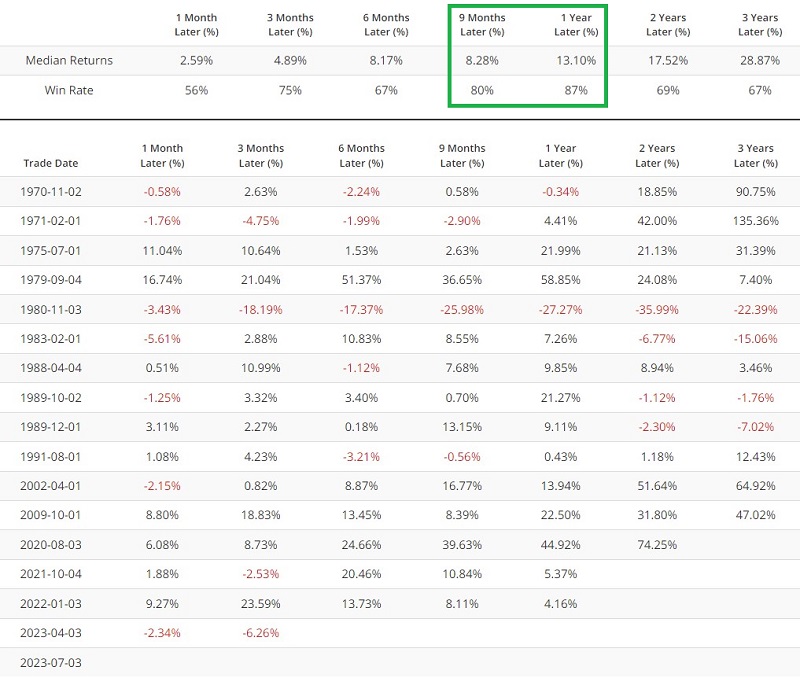
Our Macro Index combines 11 diverse economic indicators to determine the state of the U.S. economy right now. The good news is that - despite the steady drumbeat of economic gloom and doom among many market pundits - the index has improved considerably in recent months. The bad news is that the latest reading remains below 0.70, the official cutoff for "favorable" versus "unfavorable" readings for the economy and the stock market. However, as Dean pointed out, the good news is that the model recently cycled from below 0.30 to above 0.60 and that this has been followed by a higher S&P 500 Index 86% of the time since 1971.
The chart below displays the Macro Index Model and its 10-month moving average. The latest reading is 0.636, up from its recent low of 0.43 four months ago. The 10-month moving average just crossed back above 0.40 and stands at 0.42.
Now let's focus on the impact of changes in the Macro Index Model (MIM) on commodity prices.
Using the Bloomberg Commodity Spot Index
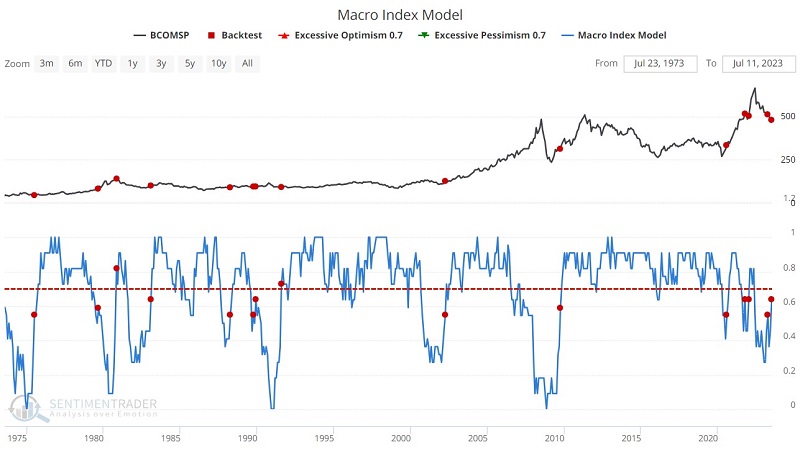
Let's turn to the Bloomberg Commodity Spot Index (BCOMSP) to create a test. With this data, we can test back to 1970, when our Macro Index Model data series begins. Let's start with the bad news. The chart and table below display those times when the MIM crossed below 0.40.
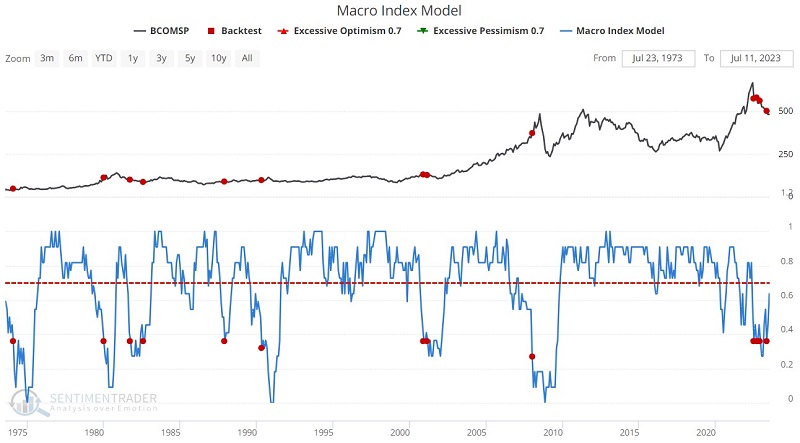
Numerically the results appear pretty abysmal for commodities, and the cluster of red dots in the past twelve months seems rather ominous at first blush. However, the sample size is tiny, and we should not draw any conclusions. In addition, the latest signals are in direct conflict with a separate set of signals.
The chart and table below display those times when the MIM crossed above 0.50.
These results are much more favorable for commodities. So how do we square these two intertwined - yet seemingly inverse - sets of readings? The best approach seems to be to apply some rules, which we will do next.
MIM has repeatedly bounced around below 0.40 and back above 0.50 in the last year. The latest "signal" was a cross back above 0.50 on 2023-07-03. So does this mean it's back to "smooth sailing" for commodities? Not necessarily. Before attempting to draw conclusions, let's broaden our test a bit.
Applying simple rules to generate signals
Let's be clear. What follows is not intended to be used as a solitary, standalone model for trading commodities as an asset class. It is best used as part of a larger "weight of the evidence" approach. Still, for purposes of this test, we will use the following rules to decide when to hold - or avoid - commodities as an asset class:
- Buy BCOMSP when the Macro Index Model crosses above 0.50
- Sell BCOMSP when the Macro Index Model crosses below 0.40
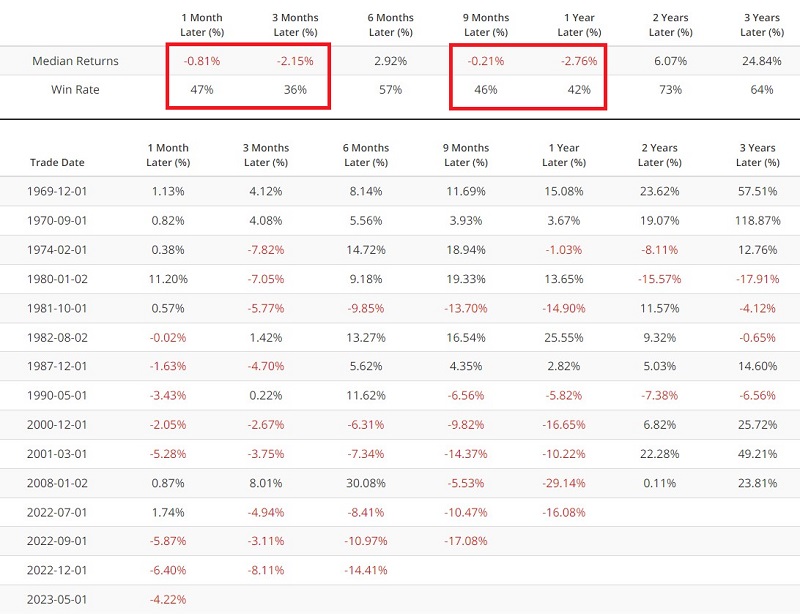
The table below displays the signal dates and BCOMSP performance during bullish and bearish periods since 1970.
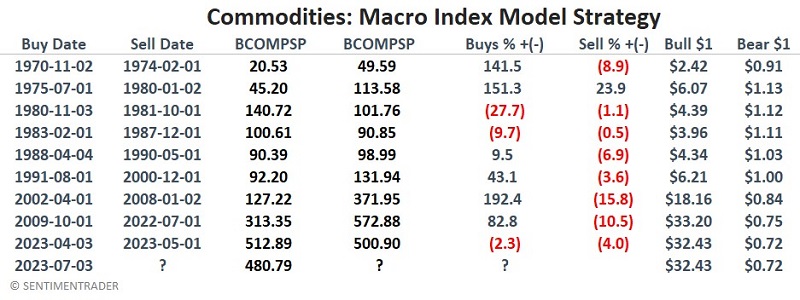
The critical thing to note:
- During bullish periods commodities gained +3,143%
- During bearish periods commodities gained (-28%)
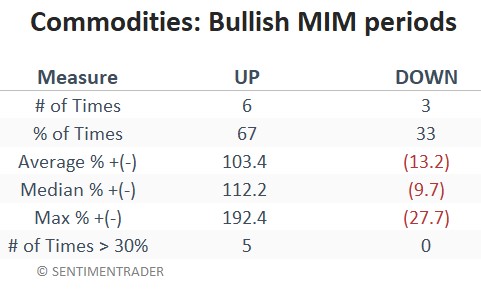
A closer look at performance during bullish periods
The chart below displays the growth of $1 invested in commodities only during bullish periods since 1970, and the table summarizes performance results.
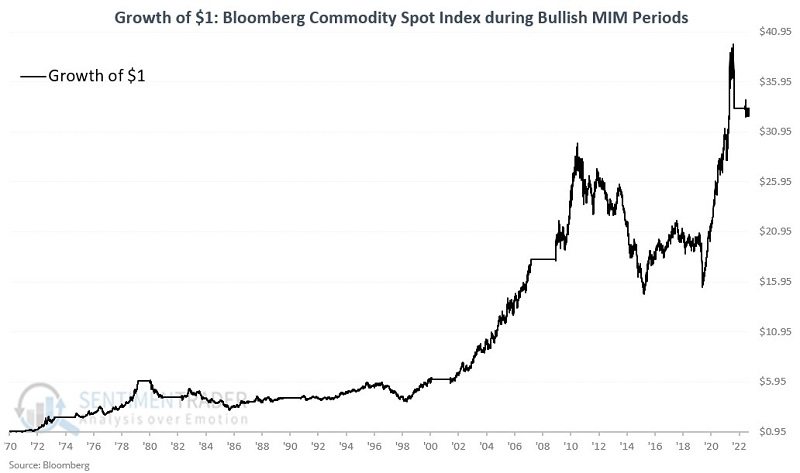
The chart below displays the growth of $1 in commodities during MIM bullish periods on a logarithmic scale.
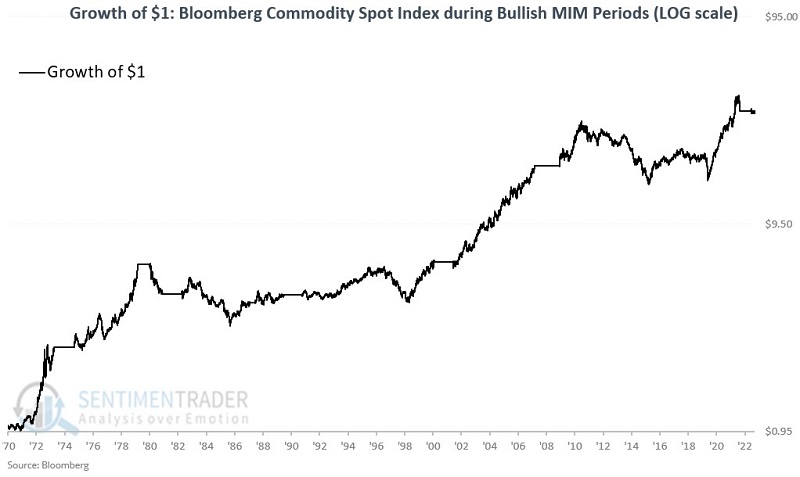
The good news is that overall commodities performed well during bullish periods and accumulated substantial gains. The bad news is that these results were not achieved without significant drawdowns and volatility along the way. The chart below displays the % drawdown for commodities held only during the bullish periods.
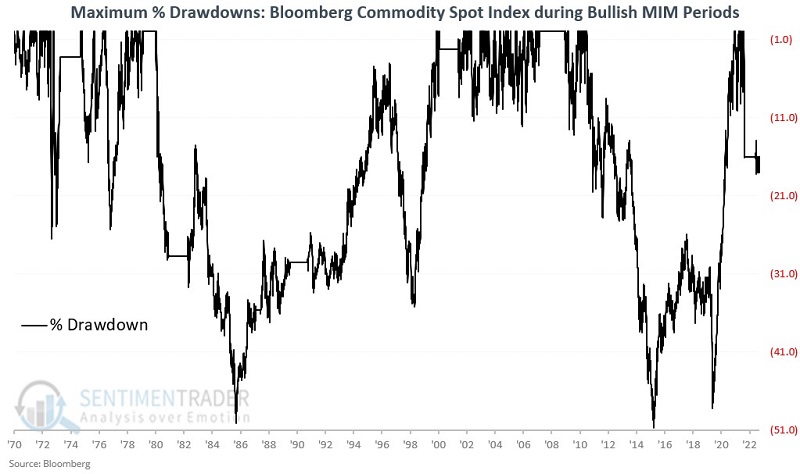
Clearly, this approach would not be for the faint of heart. This is a primary reason why the rules detailed above are not intended to serve as a standalone trading model but as part of a weight of the evidence approach. In any event, position size and/or a potential stop-loss order are essential decisions for traders to make.
A closer look at performance during bearish periods
While extreme volatility is part and parcel with the bullish periods, at least over time, the returns were meaningful. The same cannot be said of the bearish periods. The chart below displays the growth of $1 invested in commodities only during bearish periods since 1970, and the table summarizes performance results.
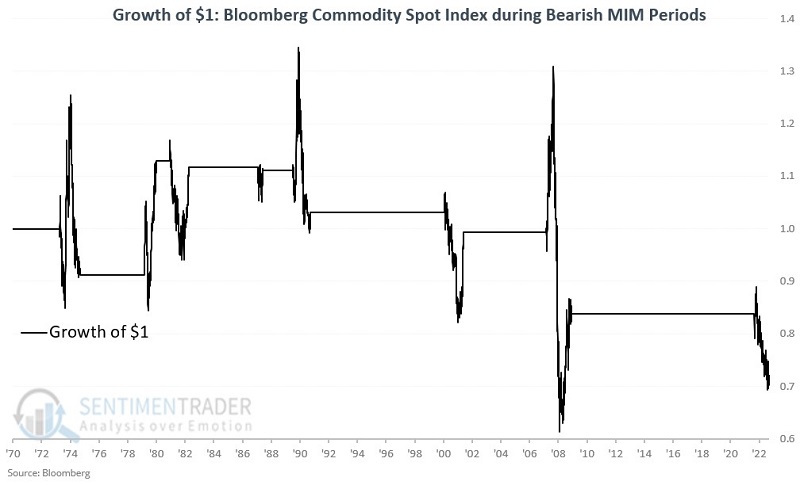
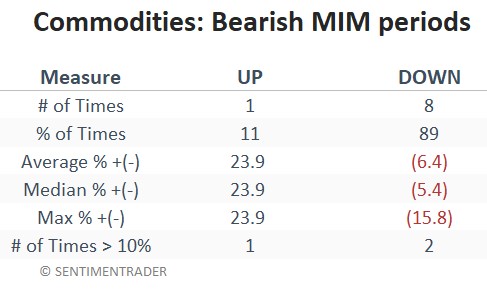
Intermittent sharp advances in commodity prices are not uncommon during bearish periods, but the subsequent declines have been highly harrowing. Investing in commodities during the abovementioned bearish periods has proven dangerous to investors' wealth.
Considering Seasonality and price action
The model above flipped back to the bullish side for commodities on 2023-07-03. Combined with the 30-year cycle discussed here, here, here, and here, there appears to be a bullish case to be made for commodities as an asset class. One possible way to gain exposure to commodities with a single transaction is by purchasing Invesco Optimum Yield Diversified Commodity Strategy No K-1 ETF (ticker PDBC). However, there are other alternatives, and investors are encouraged to explore them independently.
That said, two factors might give investors pause at the moment. The chart below displays the annual seasonal trend for the CRB Index.
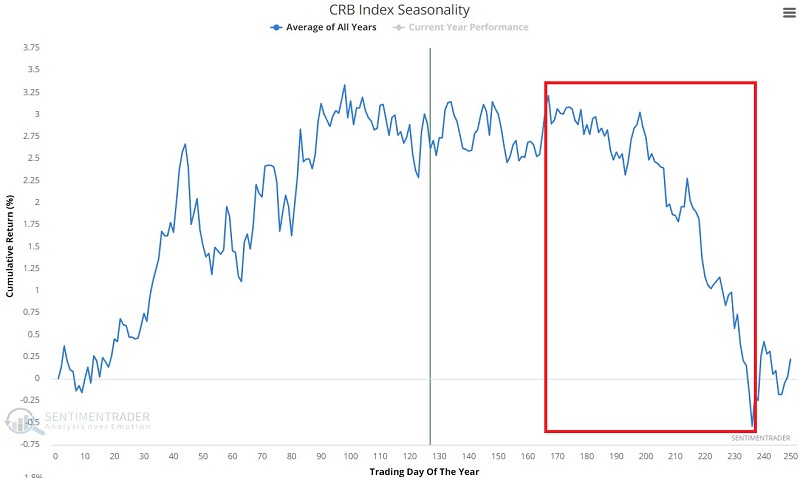
Note the tendency for extreme weakness later in the calendar year. Note also that crude oil, unleaded gas, soybeans, and corn are entering periods of significant seasonal weakness. Likewise, this article noted that another iteration of the Macro Index Model recently flashed an unfavorable signal for crude oil and copper. This does not preclude the possibility of commodity gains during the rest of 2023. But it does serve as something of a potential drag.
In addition, as you can see in the chart below, ticker PDBC is presently in a downtrend, below its declining 200-day moving average.
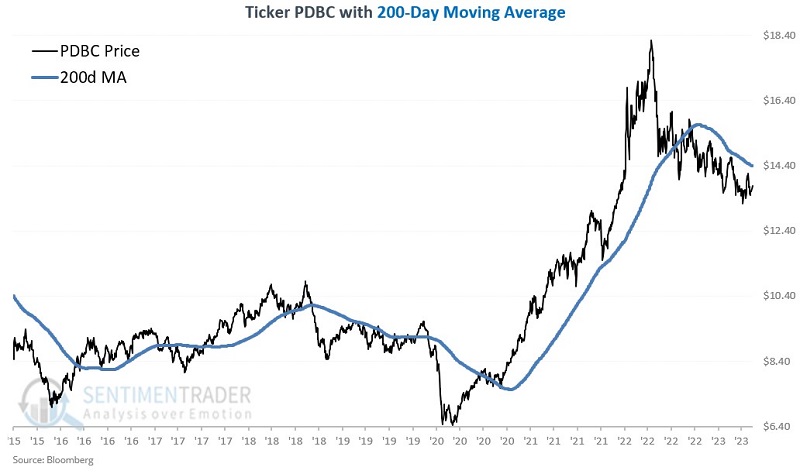
Waiting for some "signs of life" - i.e., improved price performance and possibly a move back above the 200-day average - might be wise before committing significant capital to the commodities sector.
What the research tells us…
The 30-year commodity cycle covered recently and the Macro Index Model strategy highlighted above argue in favor of a bullish move for commodities. However, seasonality appears likely to be a drag as 2023 continues, and price action is downright unfavorable at the moment. Now is the time for investors to decide "if" they will consider allocating capital to commodities (and if so, "how much") and "when" might be the ideal time to make that commitment.