
commodities

Key points:
- Seasonality is not a roadmap of the future, but merely an average of the past; for this reason, seasonality is best used when price action and the expected seasonal trend are in alignment
- blah
- Short-term seasonal periods are absolutely "hit or miss" affairs, so the opportunities detailed below in Platinum, Corn, Soybeans, Palladium, US Dollar, Natural Gas, and the Euro are only for those traders who understand the risks involved and who are willing to take action to minimize their risk
Commodities have advanced so far in 2026; further gains appear possible
The Bloomberg Commodity Spot Price Index (BCOMSP) gained more than 15% in 2025. Precious metals led the way, with the Invesco DB Precious Metals Fund (DBP) leading the way with a 70% gain. Historically, rallies in precious metals have tended to precede rallies in broader commodity indexes. Will the same thing unfold now? We cannot predict. However, the performance of commodities relative to stocks has been beaten down in recent years. Given the current high valuations of stocks (the Shiller PE Ratio is presently above 38), there is potential for a strong reversion that favors commodities over stocks in the years ahead.
In the meantime, trading opportunities (in futures contracts and/or related ETFs, as detailed) may soon emerge in the markets listed below.
Market #1: Corn
Corn suffered a 5% sell-off in mid-January but has been rallying, true to seasonal form, ever since.
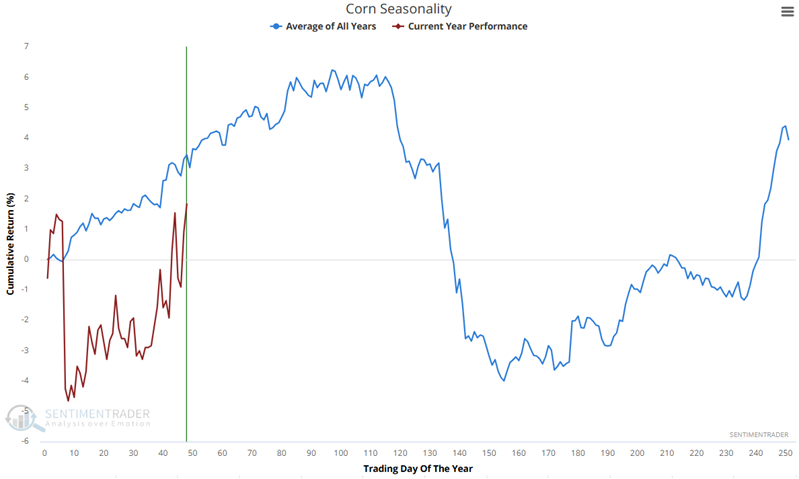
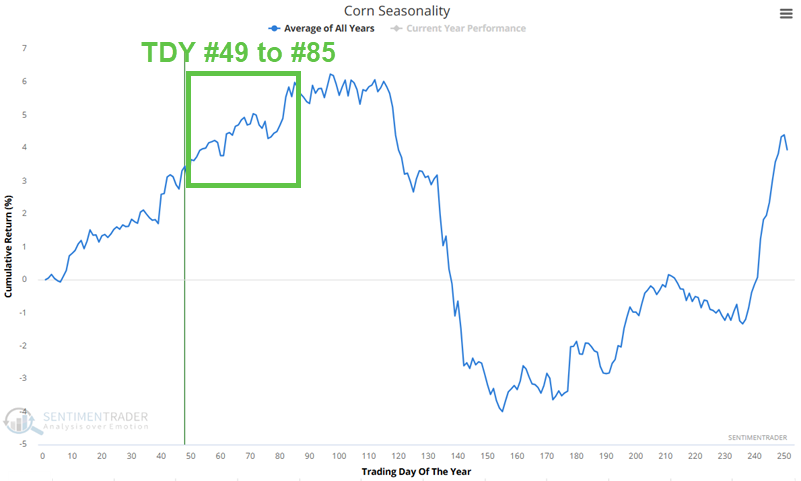
The chart below shows the Annual Seasonal Trend for Corn and highlights the Trading Day of the Year (TDY) period from TDY #49 through TDY #85. For 2026, this period extends from March 13th through May 5th.
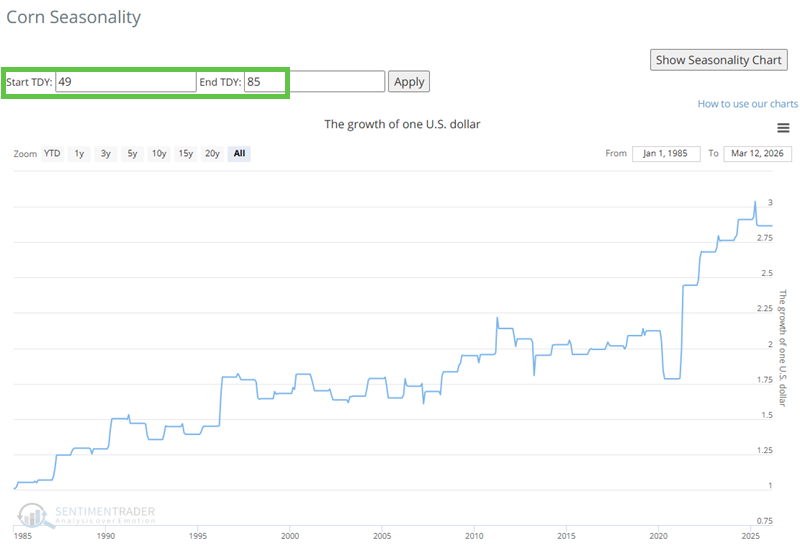
The chart below displays the hypothetical growth of $1 achieved by holding a long position in Corn only during this period every year since 1985.
Non-futures traders can consider the Teucrium Corn Fund ETF (CORN).
Market#2: Natural Gas
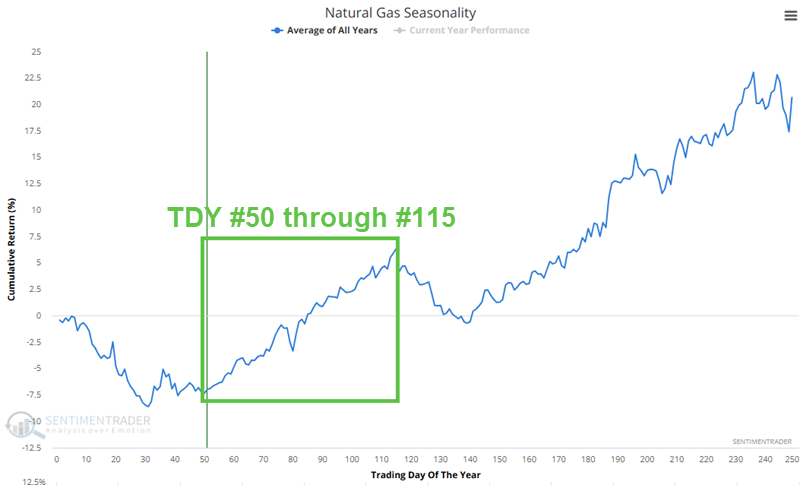
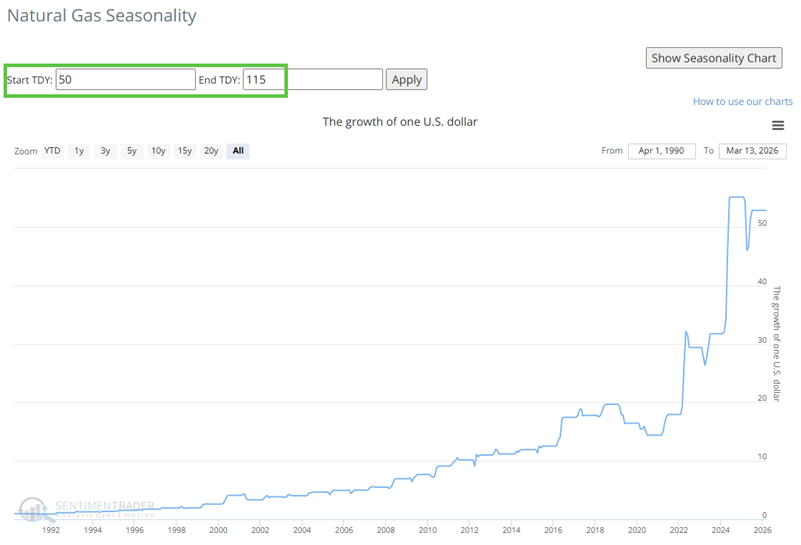
Natural Gas has had a wild ride so far in 2026, experiencing a -17% decline, a 52% rally, another -31% decline, and has since bounced 12% higher. So, where to from here? The chart below displays the Annual Seasonal Trend chart for Natural Gas and highlights a favorable period that extends from Trading Day of the Year (TDY) #50 through TDY #115. For 2026, this period extends from March 12th through June 15th.
The chart below displays the hypothetical growth of $1 achieved by holding a long position in Natural Gas only during this period every year since 1991.
Non-futures traders can consider the United States Natural Gas Fund, LP (UNG).
Market #3: Soybeans
Soybeans have a long historical tendency to show strength during the first half of the calendar year. How are things going in 2026? So far, so good. The chart below shows the Annual Seasonal Trend for Soybeans (blue line) along with the actual performance to date (dark line).
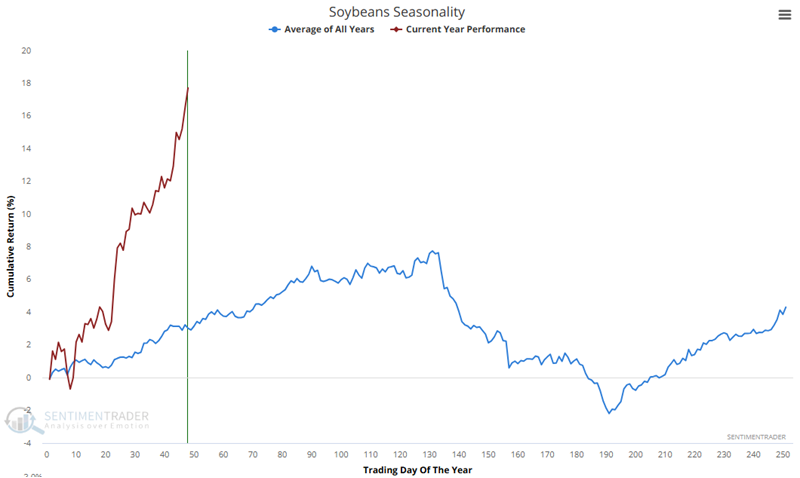
Have beans gotten ahead of themselves? It's possible, and a short-term pullback should not come as a surprise. But history suggests that traders continue to focus on playing the long side of this market and view any near-term pullback as a buying opportunity.
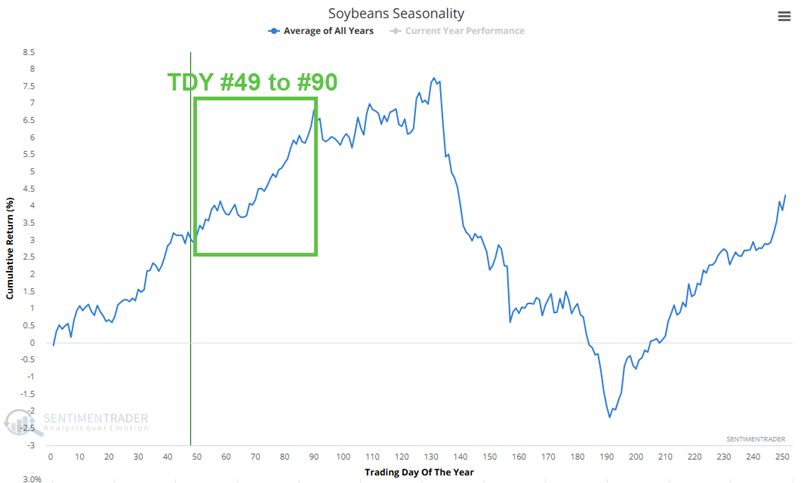
The chart below displays the Annual Seasonal Trend chart for Soybeans and highlights a favorable period that extends from Trading Day of the Year (TDY) #49 through TDY #90. For 2026, this period extends from March 13th through May 12th.
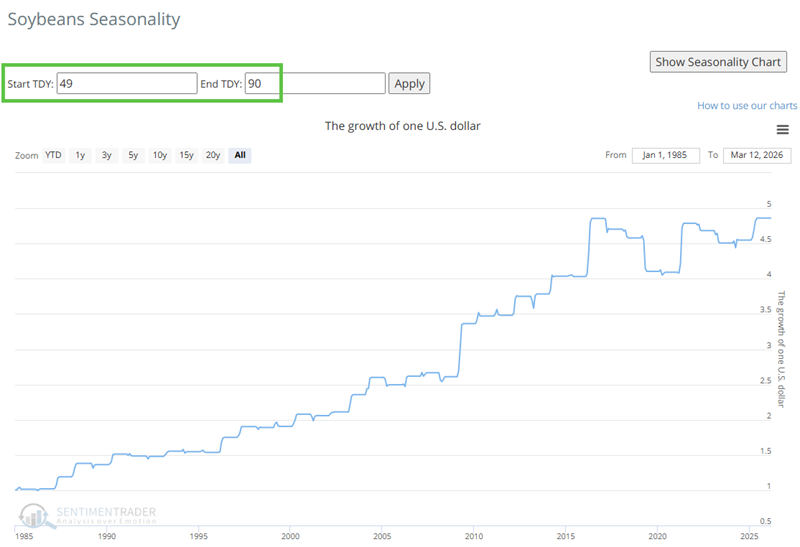
The chart below shows the hypothetical growth of $1 achieved by holding a long Soybeans position only during this period each year since 1985.
Non-futures traders can consider the Teucrium Soybean Fund ETF (SOYB).
Market #4: Palladium
Palladium piggy-backed other metals and rallied 32% into late January. Since then, it has plunged almost 30% and is down slightly for the year. Will things improve? We cannot predict, but history suggests that traders look elsewhere for better opportunities in the months ahead - or consider playing the short side.
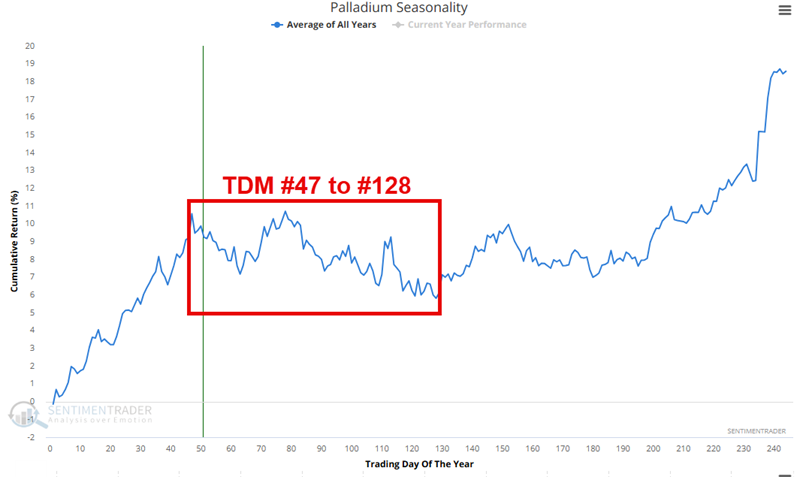
The chart below displays the Annual Seasonal Trend chart for Palladium and highlights an unfavorable period that extends from Trading Day of the Year (TDY) #47 through TDY #128. For 2026, this period extends from March 9th through July 6th.
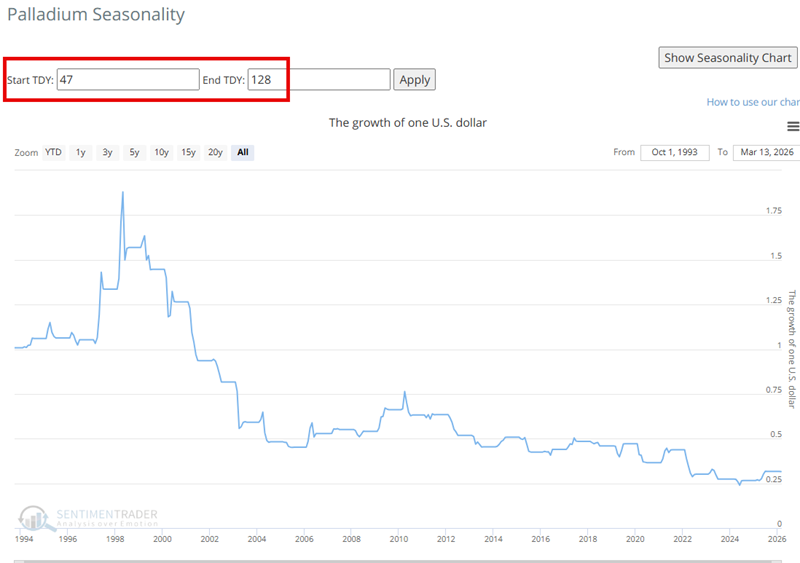
The chart below shows the hypothetical growth of $1 achieved by holding a long Palladium position only during this period each year since 1994.
Non-futures traders interested in playing the short side might consider selling short shares of the ABRDN Physical Palladium Shares ETF (PALL). However, a stop-loss is essential to limit risk with these highly volatile shares.
Market #5: Sugar
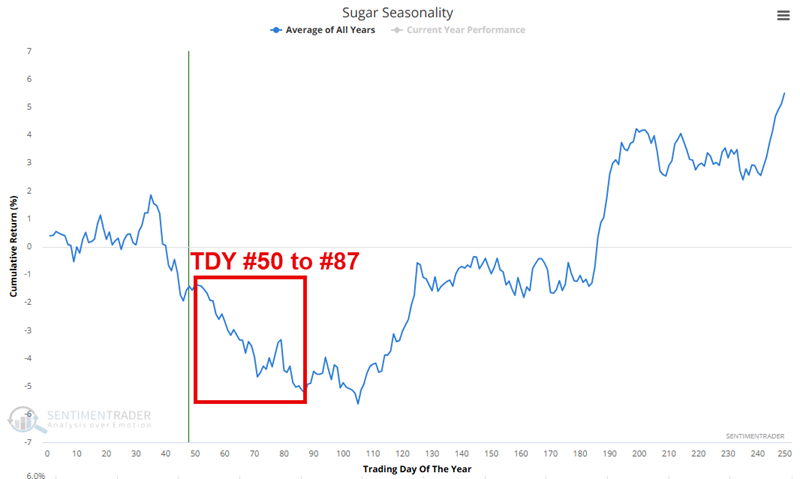
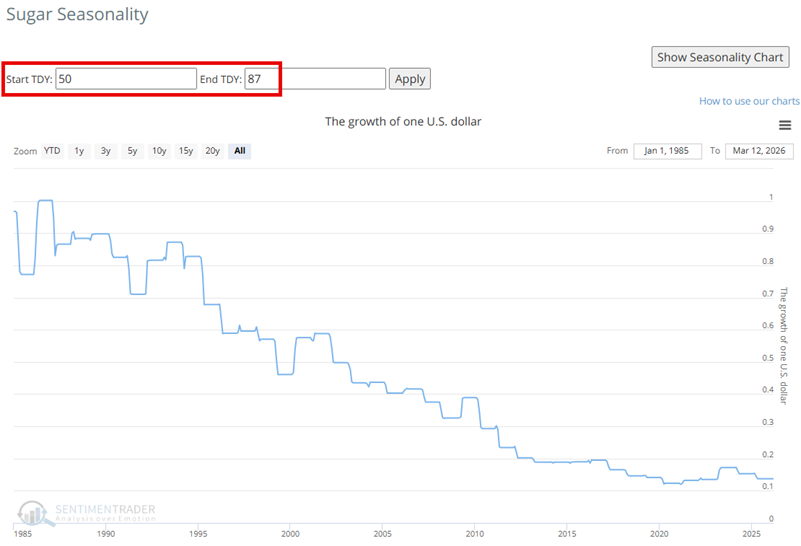
The chart below displays the Annual Seasonal Trend chart for Sugar and highlights an unfavorable period that extends from Trading Day of the Year (TDY) #50 through TDY #87. For 2026, this period extends from March 16th through May 7th.
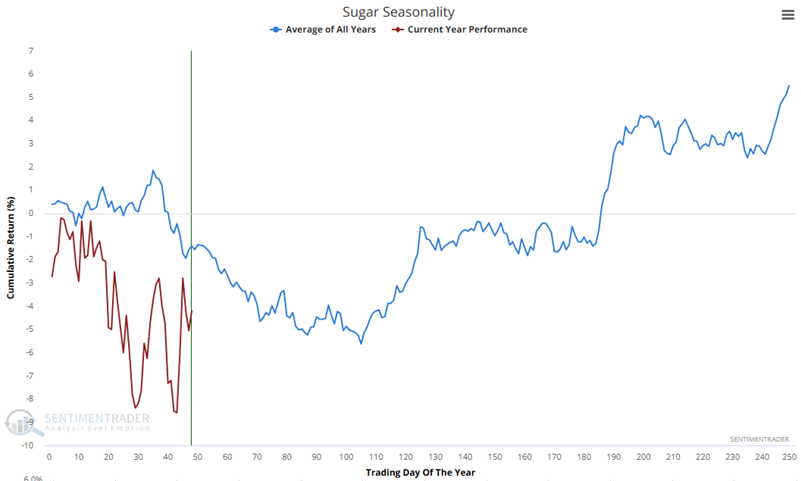
In the chart below, we see that Sugar has been bouncing around so far this year, but is entering a period of typical significant weakness.
Of course, results can vary widely from year to year. Still, the chart below displays the hypothetical growth of $1 achieved by holding a long position in Sugar only during this period every year since 1985.
Non-futures traders interested in playing the short side might consider selling short shares of Teucrium Sugar Fund (CANE). Once again, a stop-loss is essential to limit risk.
Market #6: Wheat
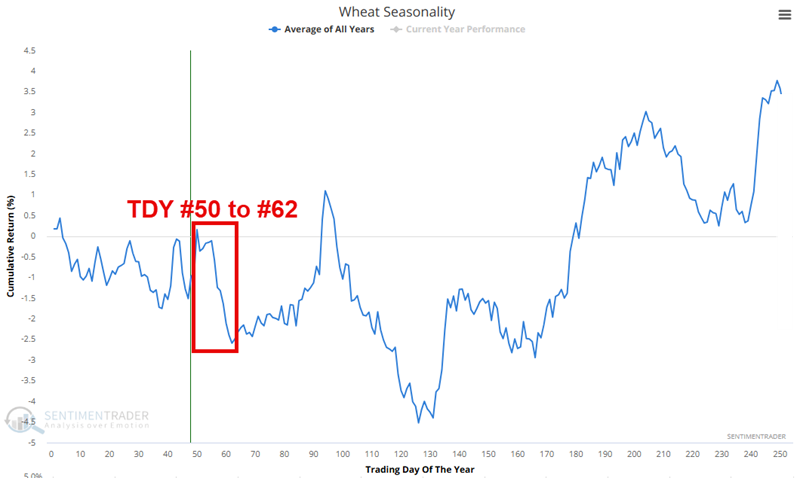
The chart below displays the Annual Seasonal Trend chart for Wheat and highlights a relatively short, unfavorable period that extends from Trading Day of the Year (TDY) #50 through TDY #62. For 2026, this period extends from March 16th through April 1st.
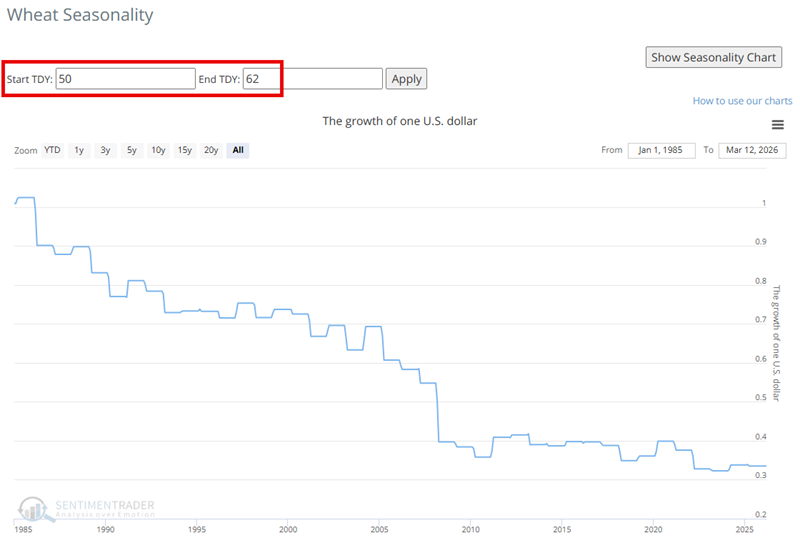
Of course, results can vary widely from year to year. Still, the chart below displays the hypothetical growth of $1 achieved by holding a long position in Wheat only during this period every year since 1985.
Non-futures traders interested in playing the short side might consider selling short shares of Teucrium Wheat Fund (WEAT). Once again, a stop-loss is essential to limit risk.
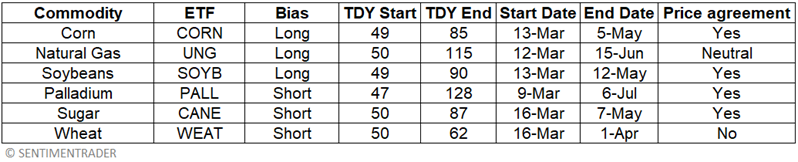
The table below summarizes the situations detailed above.
What the research tells us…
The onset of a historically favorable or unfavorable period for a given market does not, in this analyst's opinion, automatically constitute a trading signal. Seasonal tendencies merely suggest "When to look where," i.e., they offer an alert to a possible trend. As confirmation, it is generally helpful to enter trades where both the seasonal trend and actual price action are favorable or unfavorable. This can significantly increase the likelihood of success for a given trade. That said, price action can always reverse unexpectedly. As a result, it remains each trader's responsibility to select an actual entry point, to allocate capital responsibly, and to manage risk ruthlessly.
Each commodity market ultimately fluctuates based on its own supply and demand factors. Very often, these factors are influenced by seasonal fluctuations, leading to unique opportunities. Aggressive traders who understand how to manage risk in the futures market (or via an ETF) may consider taking advantage of these markets in the near term.