
Commodities

Key Points
- Commodities as an asset class have been in a steady downtrend since June 2022
- Trying to pick a bottom is a dangerous game to play
- That said, several economic surveys suggest that investors remain alert for an opportunity in commodities
The Bloomberg Commodity Spot Price Index
The Bloomberg Commodity Spot Price Index (BCOMSP) tracks the aggregate movement of a basket of commodities. This index has been in a steady decline since topping in June 2022.
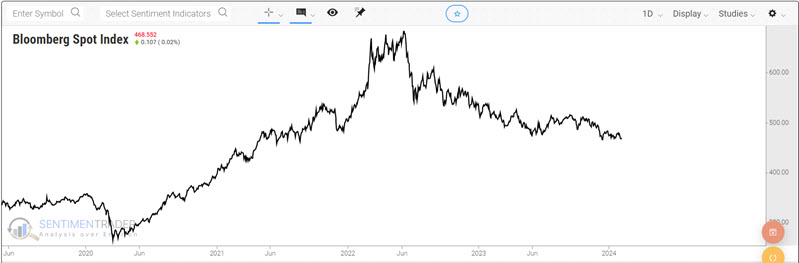
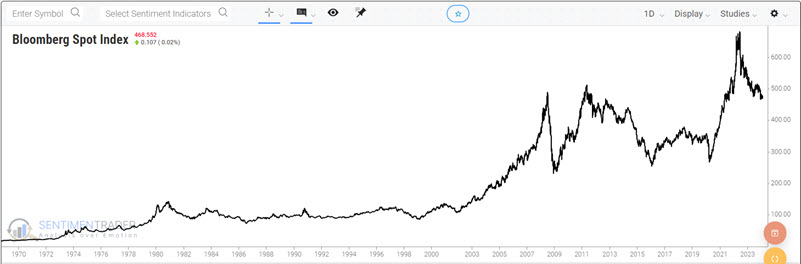
The chart below displays the long-term history of BCOMSP to put recent activity into perspective.
To get another perspective, the chart below divides the price of the Bloomberg Commodity Spot Price Index by the price of the S&P 500 Index.
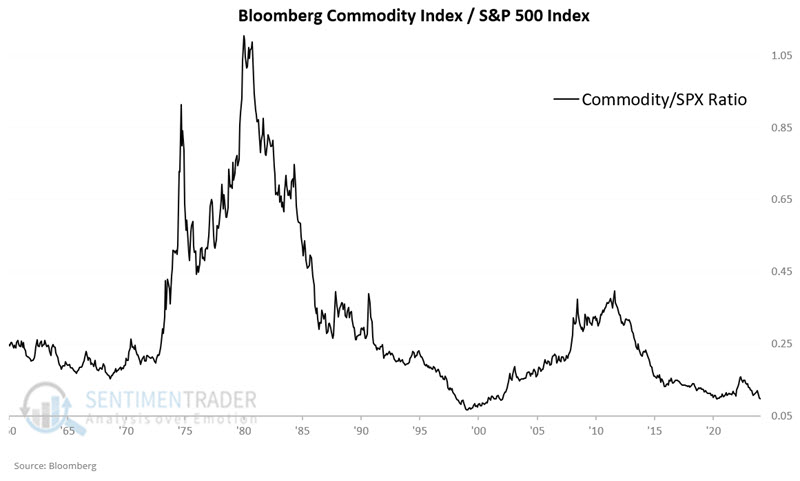
As you can see in the chart above, this ratio is towards the low end of the historical range. There are a few things to note regarding this ratio. First, this is NOT a "timing" tool. It does not tell us when to buy stocks and sell commodities or vice versa. It is a "perspective" tool. Investors have clearly favored stocks over commodities for many years, and this can continue for an indefinite length of time - and the ratio could fall significantly lower. However, the chart also reminds us that when the worm turns, the potential for outsized gains in commodities - particularly in relation to stock returns - can be significant.
I wrote a series of articles last year regarding the 30-year cycle in commodities (see here, here, and here). The latest favorable 15-year period for commodities began at the end of June 2023. While there has been no sign of a turnaround, the likelihood of a drastic change in the commodities/stocks relationship in the years ahead is high.
The message of this piece is not to "buy commodities today." The message is to "be prepared to buy commodities when the time comes."
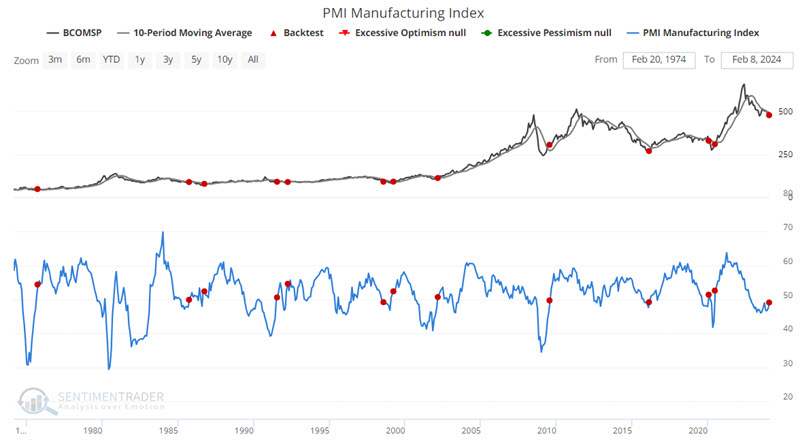
A signal from PMI Manufacturing
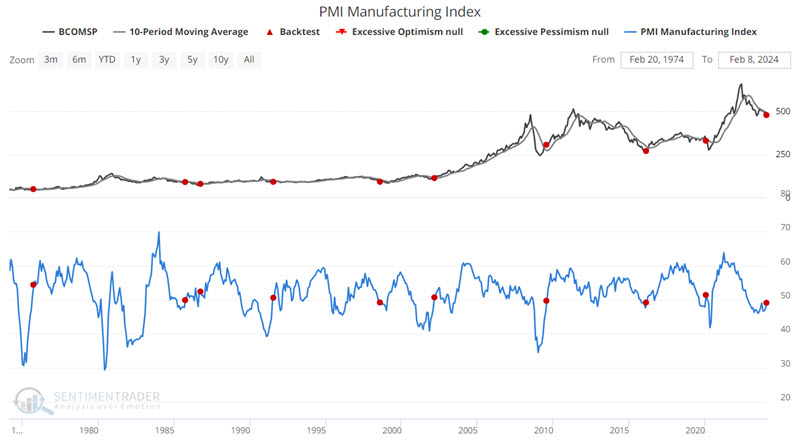
The chart below highlights each time the PMI Manufacturing Index crossed above 49 while the Bloomberg Commodity Spot Price Index was below its 10-month moving average. The latest signal occurred on 2024-01-31.
The table below summarizes BCOMSP performance and displays signal-by-signal results following each previous signal.
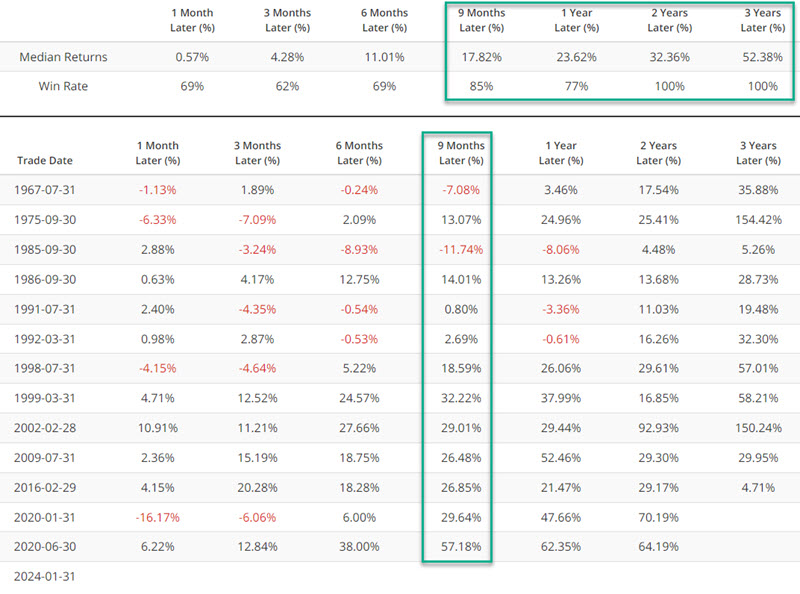
These signals typically highlighted good opportunities to look at investing in commodities as an asset class.
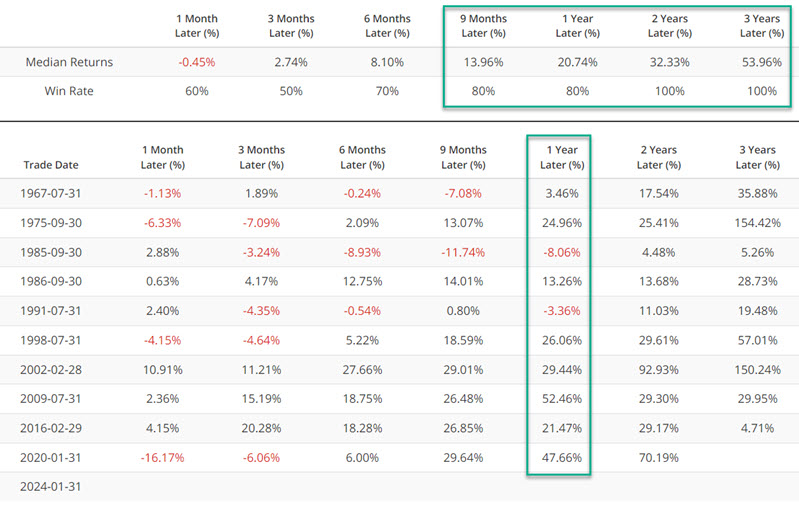
We exclude overlapping signals in the prior 12 months to refine this test. In the chart below, signals are at least 12 months apart.
The table below summarizes BCOMSP performance and displays signal-by-signal results following each previous signal.
The most recent signal from PMI Manufacturing dovetails with some recent signals from other economic-related indicators.
A recent signal from the Conference Board Consumer Confidence indicator
It is helpful to reiterate from time to time that not every signal from every indicator constitutes an automatic buy or sell signal. In most cases, indicator signals are best viewed as "weight of the evidence."
For example, the chart below highlights each time Conference Board Consumer Confidence crossed above 111 for the first time in one year versus the Bloomberg Commodity Spot Price Index. The latest signal occurred on 2023-07-31.
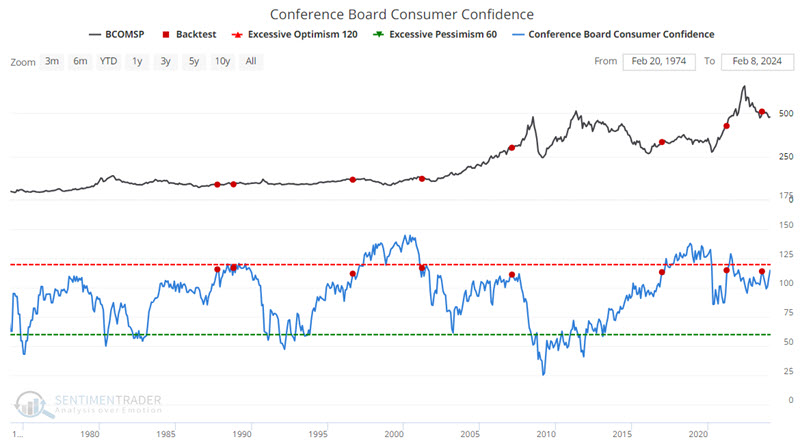
The table below summarizes BCOMSP performance and displays signal-by-signal results following each previous signal.
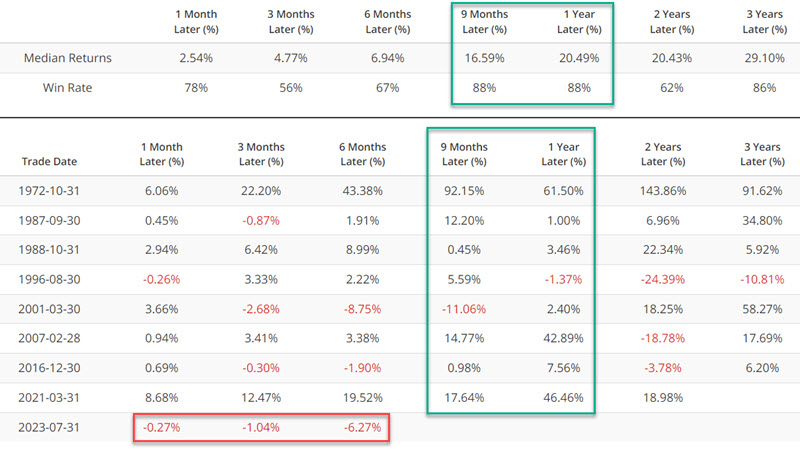
Historically, the 1-Year Win Rate is 88%, with a median gain of +20.49%. That's the good news. The bad news is that BCOMSP has sunk -6.1% since the July 2023 signal. This highlights the importance of:
- Viewing signals such as this as weight of the evidence and not as "automatic" buy signals
- Waiting for some price action confirmation before entering a long position
In the meantime, this indicator remains on the bearish side of the ledger, and any bounce in commodity prices can be viewed as a viable trading opportunity.
Updating the last signal from the Macro Index Model
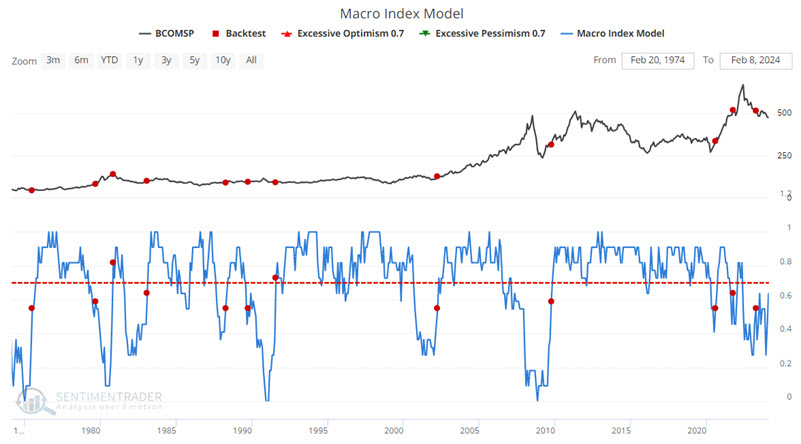
Another example of using an economic indicator as a weight of the evidence factor for commodities is found using our Macro Index Model. The chart below highlights each time our Macro Index Model crossed above 50 for the first time in 12 months versus the Bloomberg Commodity Spot Price Index. The latest signal occurred back on 2023-04-03.
The table below summarizes BCOMSP performance and displays signal-by-signal results following each previous signal.
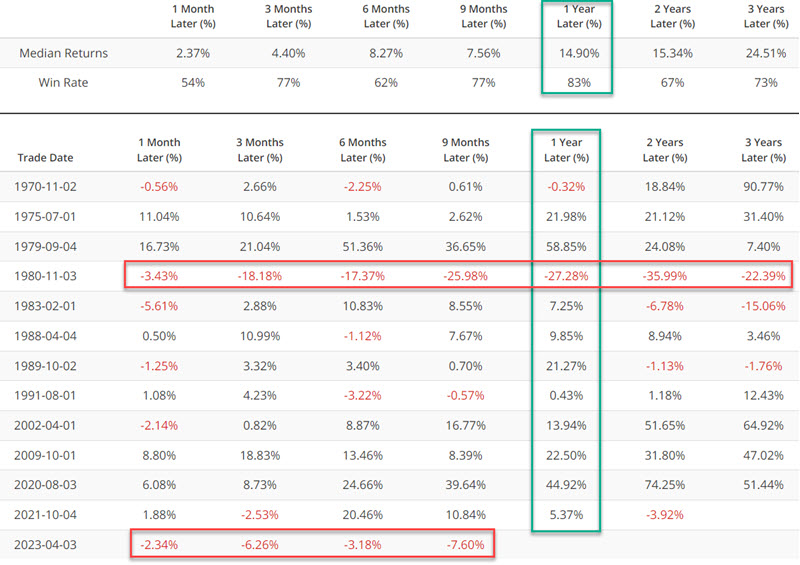
Historically, the 1-Year Win Rate is 83%, with a median gain of +14.90%. So far - and with time running out to mount a 1-year gain - the April 2023 signal resembles the November 1980 signal. Since the April 2023 signal, BCOMSP has sunk -6.1%. This poor performance (so far) serves as another reminder of why price action confirmation is such an essential part of trading success.
What the research tells us…
To make a long story short, stocks have been great, commodities have been lousy, two of the economic indicators detailed above have given signals that so far have not panned out, and commodities continue to drift lower. These are the undeniable facts on the ground at the moment. Nevertheless, the information above reminds us that no trend or relationship in the financial markets ever lasts forever. This is likely not the exact moment to "dump stocks and pile into commodities." Still, the potential for commodities to significantly outperform stocks between now and 2038 suggests that investors should not stick their heads in the sand when it comes to investing in commodities.