Coffee - What's the Forecast

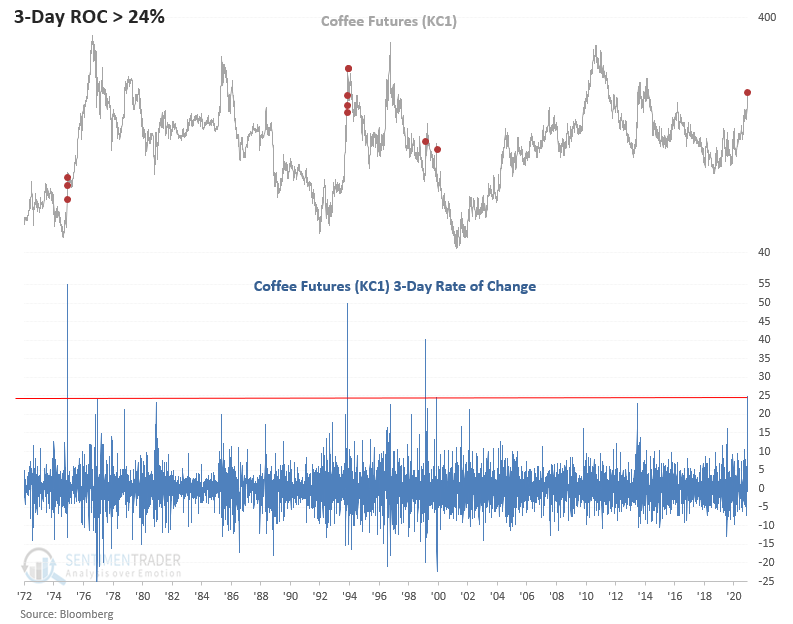
Coffee is surging on weather-related news out of Brazil. On an intraday basis today, the 3-day rate of change is greater than 24%.
Let's assess forward returns for the commodity when a surge of this magnitude has occurred in the past.
HISTORICAL CHART
A 3-day surge of 24% or more is rare.
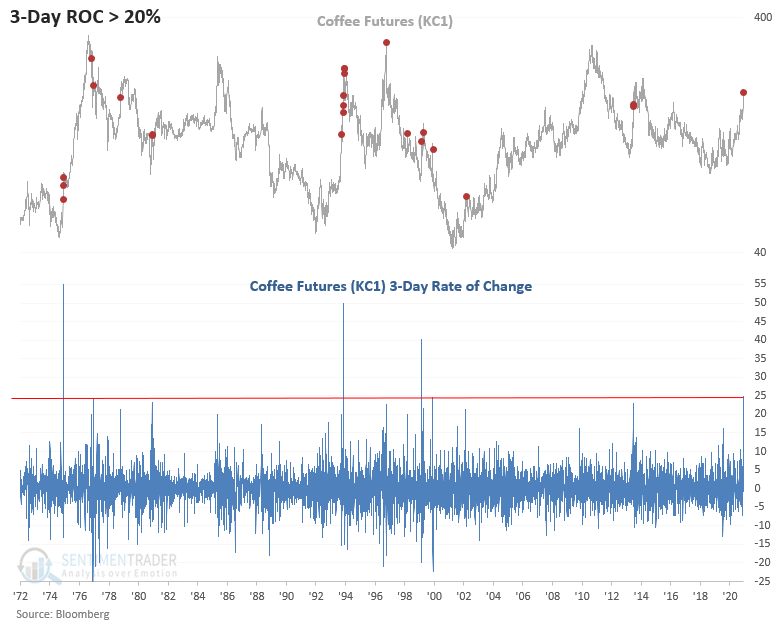
Let's lower the threshold to 20% to assess more instances.
HISTORICAL CHART
With more signals, we can now start to see a pattern. Typically, the big surges occur in structural bear markets for the commodity. The mid-1970s and 2002 are the only instances that kicked off a sustainable bull market.
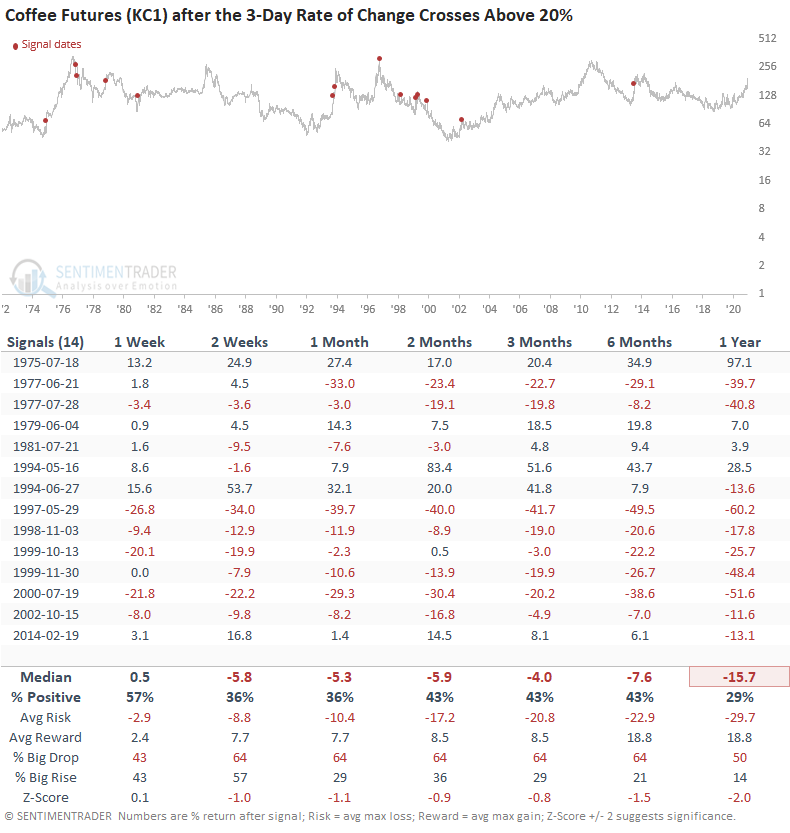
Let's use the 20% threshold and assess forward returns.
HOW THE SIGNALS PERFORMED
Returns look weak across all timeframes, especially the 1-year. However, a bearish short position is not without risk, as some of the first signals out of a bear market continued to ramp higher.
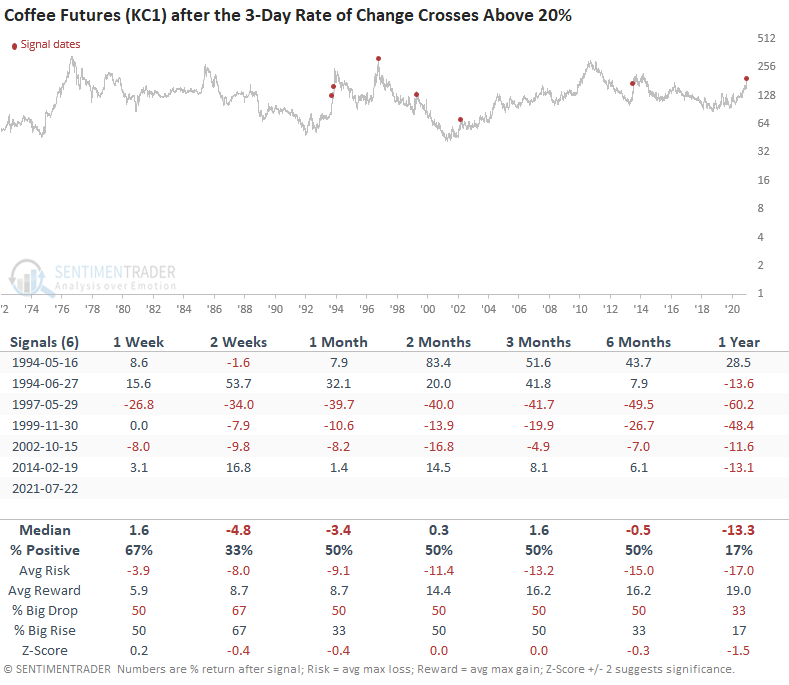
Let's take a look at the signal from one more angle. Because several instances occurred during a structural bear market phase for the commodity, let's add one more condition to the study. We will now seek to isolate signals that happened when the 3-day rate of change for coffee crossed above 20% and the commodity closed at a 252-day high.
HOW THE SIGNALS PERFORMED AT A 252-DAY HIGH
The table shows that all but one signal was lower a year later. And, I would add that coffee peaked two months after the May 1994 signal. If one used a signal methodology of >= 20% and 252-day instead of a cross above 20% and 252-day, you would pick up the 1975 instance. As the first table shows, it was a very bullish signal.