
Cluster of 80% days is more bull market behavior

Key points:
- The S&P 500 bottomed four months ago, and in that span, there have been a near-record number of 80% days
- These are days with more than 80% of stocks advancing, and 80% of volume flowing to them
- Bottoms with many 80% days preceded further medium- to long-term gains every time
Buyers have been persistent and overwhelming
It's been one heckuva run for stocks over the past four months.
We use the historical average of 21 trading days in an average month. The S&P 500 bottomed on October 12, which was 84 trading days, or four months, ago. Since then, it has enjoyed a remarkable cluster of days with overwhelming buying interest. The sheer number of days with large numbers of advancing stocks has pushed its Cumulative Advance/Decline Line to an all-time high.
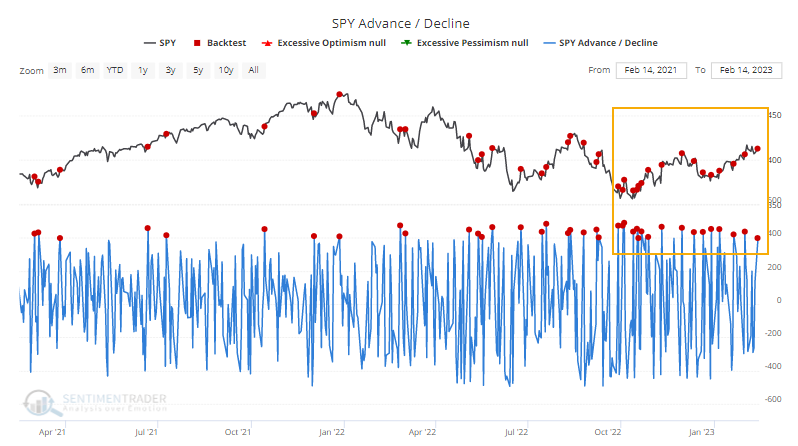
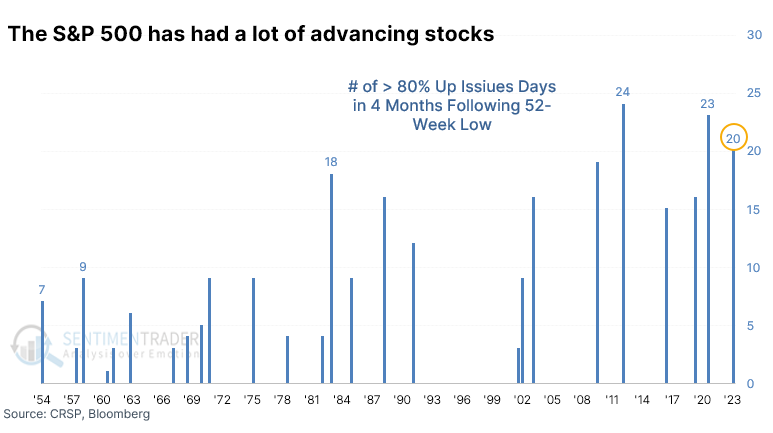
Over these four months, there have been 20 days when more than 80% of stocks within the S&P 500 advanced. Dating back to 1950, this has been one of the largest-ever clusters of days with so many rising stocks during the four months following a 52-week low.
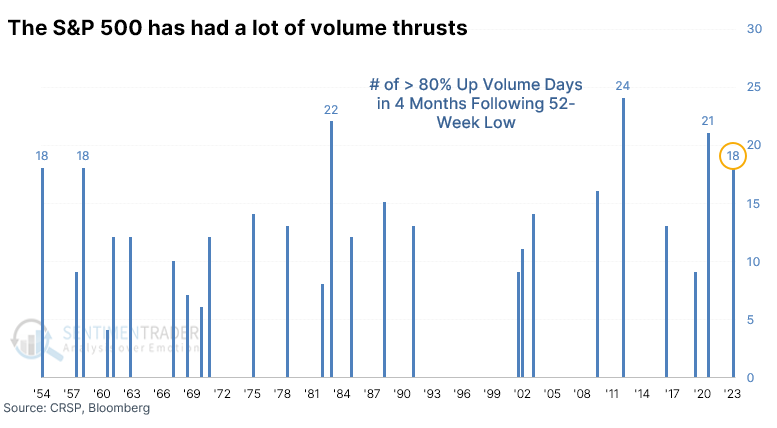
There has been a lot of oomph behind that buying interest, as well, since the number of days with 80% or more volume flowing into those rising stocks has spiked. The 18 days with such overwhelming volume flow is tied for the 4th-largest since 1950.
Bottoms with many 80% days preceded pristine returns
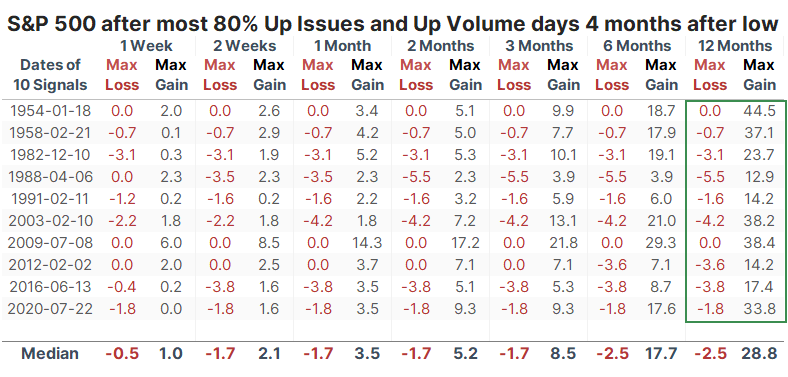
If we combine the two metrics, there were 38 instances of 80% or greater Up Issues and/or Up Volume in the four months following the low. Looking at the four-month stretches following all 52-week lows in the S&P since 1950, this ranks as the 4th-most ever. The only bottoms exceeding it were in 1982, 2012, and 2020. In the year following those signals, the S&P 500 returned +18.4%, +14.0%, and +33.3%, respectively.
The bottoms that enjoyed the largest clusters of 80% days enjoyed pristine returns over the next 2-12 months with no losses.
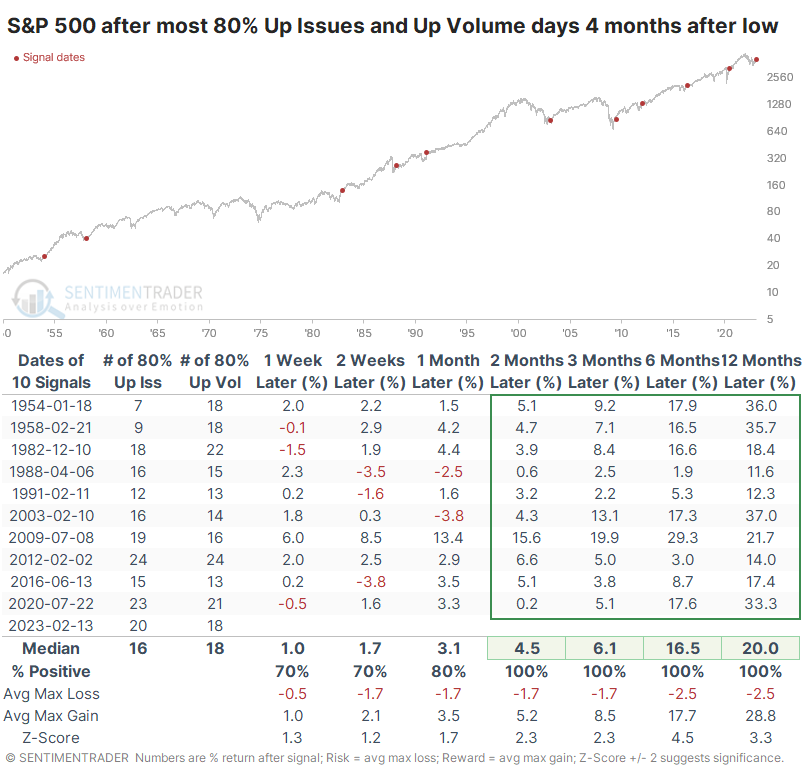
The risk versus reward following these "thrusty" bottoms was phenomenal. Within the next year, not a single precedent declined more than -5.5% at any point, while all of them enjoyed a rally of at least +12.9%, and on average, much more than that - nearly +29%.
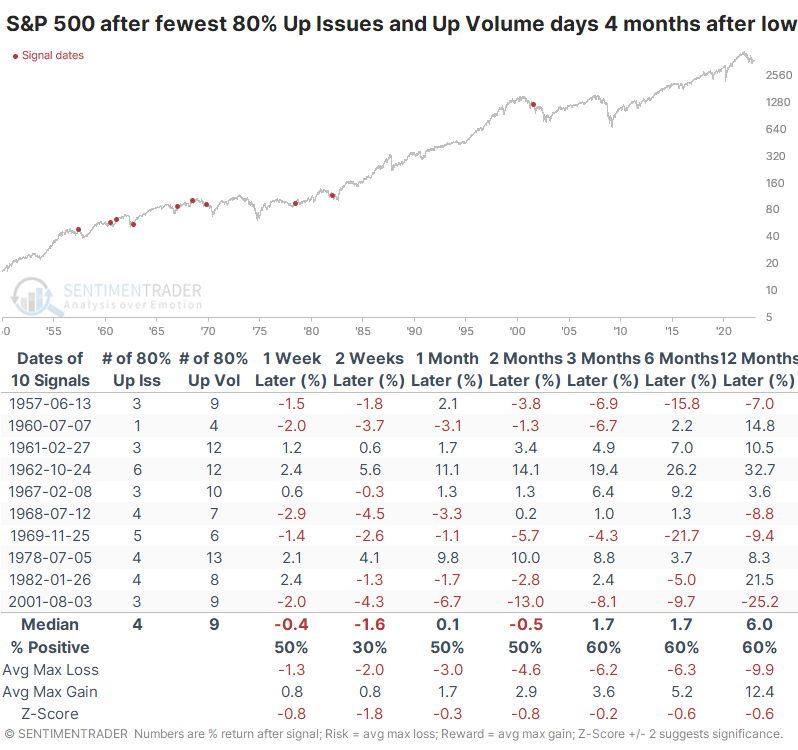
We like to look at counterexamples when sample sizes are small. If the opposite scenarios tend to generate the opposite returns, then we can have a bit more confidence in the data. The table below shows the four-month bottoms with the fewest number of 80% up days, and the S&P 500's forward returns were significantly worse for it, with much higher risk and much lower reward.
What the research tells us...
Over the past few months, we've shown study after study outlining how this rally has been different than others during the bear market. Most of those studies showed that the type of rally we've seen in terms of persistence, magnitude, and breadth has rarely, if ever, been witnessed during an ongoing bear market. That raises the probability that we're no longer in such, and more likely at the beginning of a protracted bull market recovery. The fact that we've witnessed such a heavy cluster of days with overwhelming buying interest in the four months since the bottom furthers that argument.