Products
SentimenTrader Trading Tools
‍
Backtest Engine
My Trading Toolkit
Correlation Analysis
Seasonality
Market Prediction
Indicators & Data API
‍
Proprietary Indicators & Charts
Market Data API
Strategies & Scanner
‍
50+ Trading Strategies
Smart Stock Scanner
Smart Option Scanner
Research Reports
‍
Research Solutions
Reports Library
Free Resources
Simple Backtest Calculator
Simple Seasonality Calculator
The Kelly Criterion Calculator
Sentiment Geo Map
Public Research Reports
Education
Sentiment Indicators
Technical Indicators
Pricing
Company
About
In the News
Testimonials
Client Success Stories
Contact
Log inLoginSign up
< BACK TO ALL REPORTS

Chinese tech stocks have surged once again

Jason Goepfert
2022-12-06
In October, Chinese technology stocks were being shunned and derided as uninvestable. Things have changed drastically in recent weeks, with almost all of the stocks above their 50-day moving average and more than half above their 200-day. Behavior like this has preceded strong gains over the next 1-2 years.

Key points:

  • After being deemed uninvestable a couple of months ago, Chinese 'net stocks have surged
  • Nearly all of them are above their 50-day averages, and more than half are above their 200-day averages
  • Similar behavior tended to precede gains over the next 1-2 years

Nearly all Chinese technology stocks are back in uptrends

On October 25, we looked at the latest plunge in Chinese internet stocks. While there was a danger of "fool me once" activity, the pure panic at the time was a clear sign of excess.

They have recovered nicely since then. It has been enough to push nearly all the stocks above their medium-term 50-day moving averages, exceeding the rally from June.

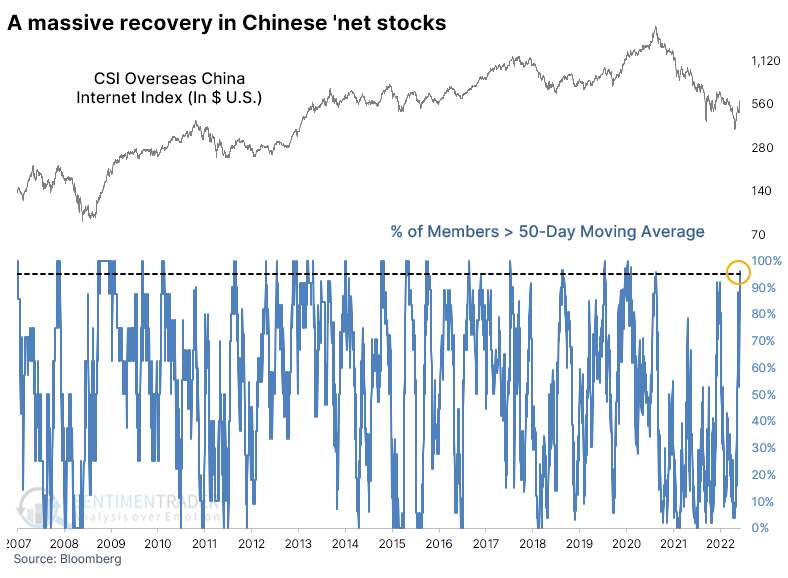
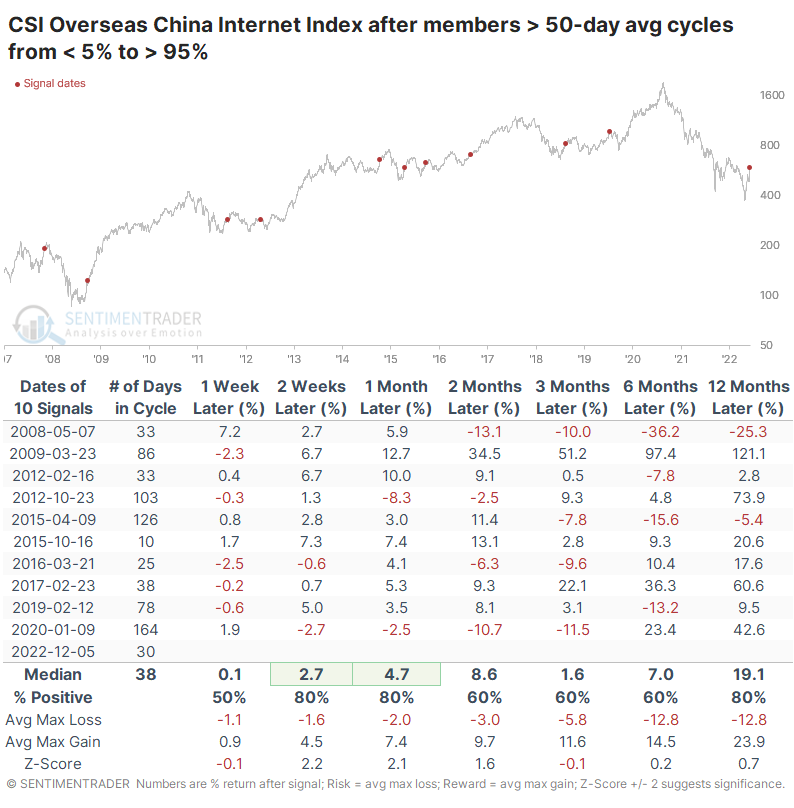
Whenever there was an extreme cycle from a few members above their 50-day average to nearly all of them, the index that underlies the popular KWEB fund tended to rally. There were some big losses in there, so it's not like it was perfect.

Long-term trends have staged a more impressive recovery

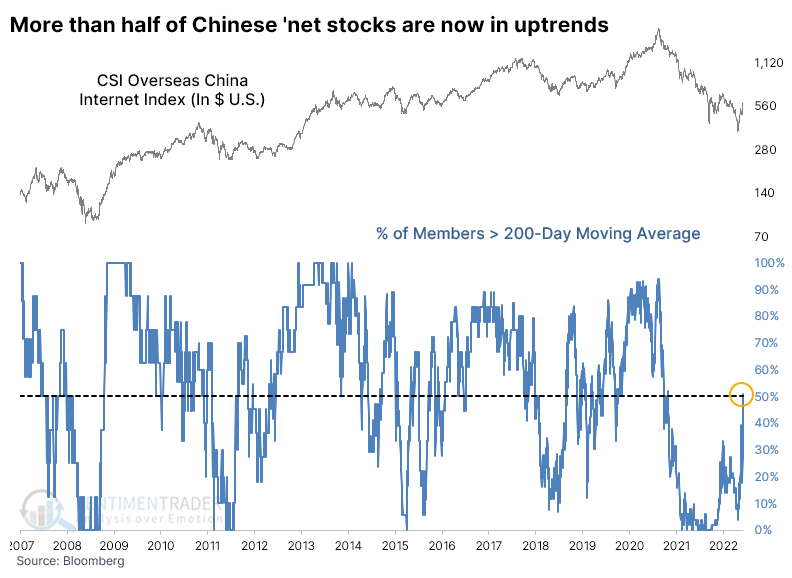
Even more impressively, more than half the stocks are now above their long-term 200-day moving averages. That's a massive improvement from June, when barely a third of them closed above their averages.

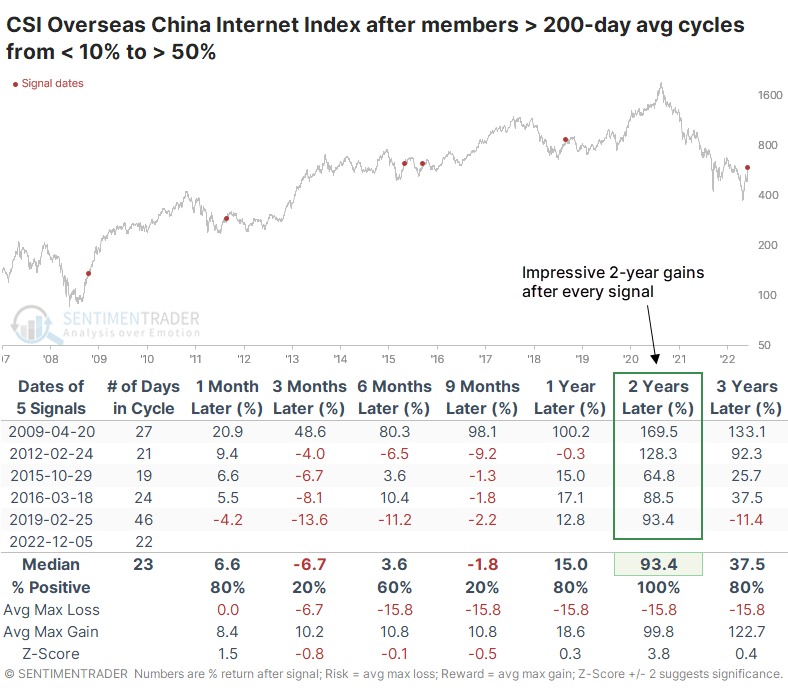
Taking a longer-term look at forward returns after similar behavior, Chinese 'net stocks showed large gains in the two years following each signal. Granted, history is limited, and the sample size is tiny, but this kind of activity was admirably consistent in preceding significant and sustained gains.

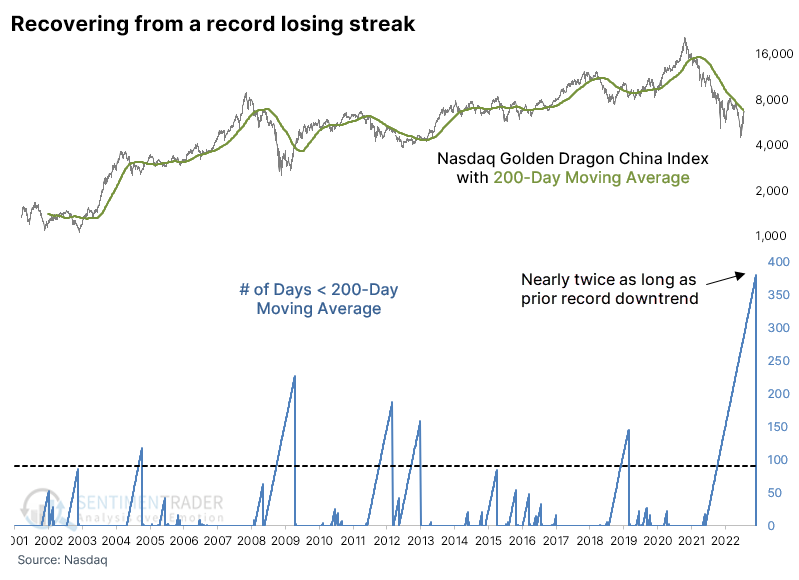
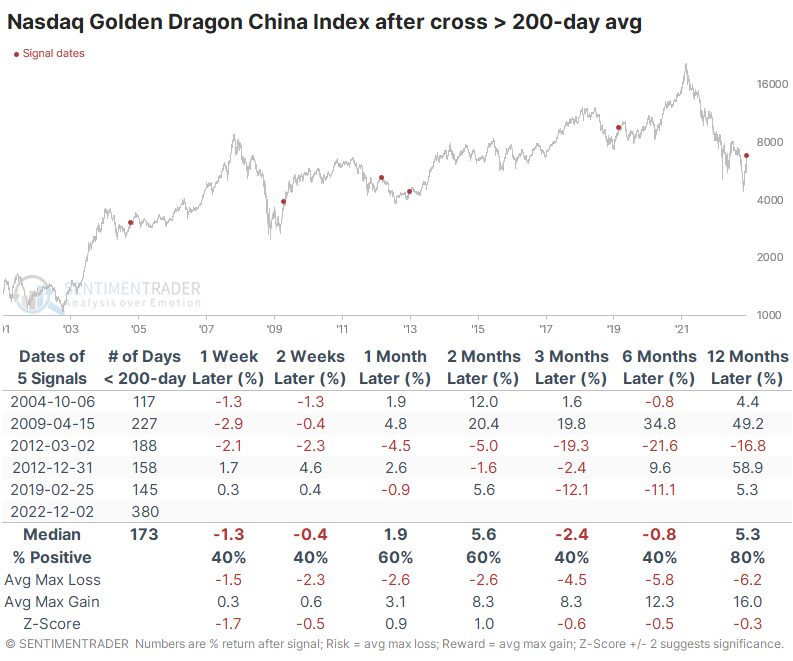
Closer to home, the Nasdaq Golden Dragon China Index has finally managed to close above its 200-day average for the first time in nearly 400 days. That's almost twice as long as the prior most protracted downtrend.

This, too, preceded some iffy returns, especially over the next 3-6 months, though all but one showed a positive return over the next year.

What the research tells us...

The buying pressure in Chinese tech stocks is similar to what we've seen in U.S. and global stocks, only on a grander scale. In October, investors had given up (again), designating the sector as uninvestable. The herd has started to migrate to the other extreme, and buying interest has been intent and broad-based. That has been a consistent shot-then-chaser for positive returns over decades and across markets. On a longer-term time frame, it should be another bullish factor for this previously shunned group of stocks.

PRODUCTS
SentimenTrader
Trading Tools
Indicators & Data API
‍
Strategies & Scanner
‍
Research Reports
FREE
RESOUrCES
Simple Backtest
Calculator
Simple Seasonality
Calculator
The Kelly Criterion
Calculator
Sentiment Geo Map
‍
Public Research Reports
‍
Education
Sentiment Indicators
‍
Technical Indicators
‍
Pricing
Bundle pricing
‍
FAQ
‍
Announcements
‍
COMPANY
‍
About
‍
In the News
‍
Testimonials
‍
Client Success Stories
CONTACT
‍
General Inquiries
‍
Media Inquiries
‍
Financial Professionals Inquiries
‍
© 2026 Sundial Capital Research Inc. All rights reserved.
Setsail Marketing
TermsPrivacyAffiliate Program
Risk Disclosure: The information and tools provided are for research and analytical purposes only and are not intended as investment advice. Market analysis involves uncertainty, and outcomes may differ from expectations. Users should conduct their own due diligence and consider their individual circumstances before making any financial decisions. Past performance is not necessarily indicative of future results.

Hypothetical Performance Disclosure: Hypothetical performance results have many inherent limitations, some of which are described below. No representation is being made that any account will or is likely to achieve profits or losses similar to those shown; in fact, there are frequently sharp differences between hypothetical performance results and the actual results subsequently achieved by any particular trading program. One of the limitations of hypothetical performance results is that they are generally prepared with the benefit of hindsight. In addition, hypothetical trading does not involve financial risk, and no hypothetical trading record can completely account for the impact of financial risk of actual trading. for example, the ability to withstand losses or to adhere to a particular trading program in spite of trading losses are material points which can also adversely affect actual trading results. There are numerous other factors related to the markets in general or to the implementation of any specific trading program which cannot be fully accounted for in the preparation of hypothetical performance results and all which can adversely affect trading results.

Testimonial Disclosure: Testimonials appearing on this website may not be representative of other clients or customers and is not a guarantee of future performance or success.