Products
SentimenTrader Trading Tools
‍
Backtest Engine
My Trading Toolkit
Correlation Analysis
Seasonality
Indicators & Data API
‍
Proprietary Indicators & Charts
Market Data API
Strategies & Scanner
‍
50+ Trading Strategies
Smart Stock Scanner
Research Reports
‍
Research Solutions
Reports Library
Free Resources
Simple Backtest Calculator
Simple Seasonality Calculator
The Kelly Criterion Calculator
Sentiment Geo Map
Public Research Reports
Education
Sentiment Indicators
Technical Indicators
Pricing
Company
About
In the News
Testimonials
Client Success Stories
Contact
Log inLoginSign up
< BACK TO ALL REPORTS

Chinese tech stocks are back on the path to uninvestable

Jason Goepfert
2023-05-09
By January, the Chinese technology sector was a new shiny object for investors, and nearly all the stocks were in solid uptrends. There has been persistent selling ever since, and breadth metrics are nearing oversold levels.

Key points:

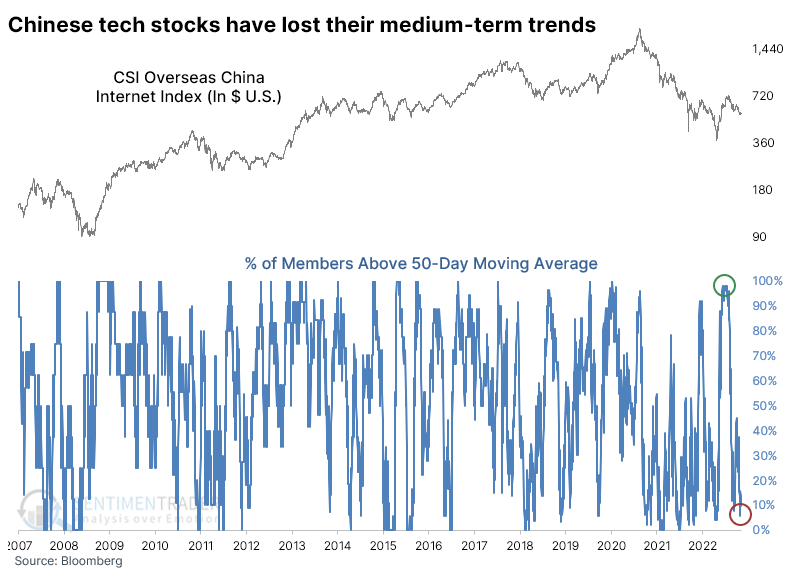
  • Breadth among Chinese technology stocks soared in January and has since pulled back
  • Medium- and long-term measures are nearing oversold levels
  • Similar cycles preceded mostly poor returns, highlighting the difficulty with a boom-and-bust sector

From uninvestable to investible and back again

Talk about a boom-and-bust market. Chinese technology stocks went from the latter to the former and now back to the latter again.

A storm of geopolitical controversy hounded the Chinese tech sector for much of 2022, and the stocks suffered one of their largest declines ever. They rebounded for a while, then plunged anew last October, once again triggering compelling extremes and earning the reliable buy signal of being uninvestable.

A furious rally into last December made the media and major investment banks jump on the recovery bandwagon, which is always a worry. When we looked at the recovery at the time, the few precedents appeared bullish in the short-term, bearish in the medium-term, and bullish again in the very long-term.

So far, it has mostly played out that way, but the decline has gone deeper than we might have reasonably suspected. Since late January, the stocks haven't enjoyed much respite from the selling pressure. At the time, nearly every one of the stocks was above its 50-day moving average, but by late last month, that fell to fewer than 7%.

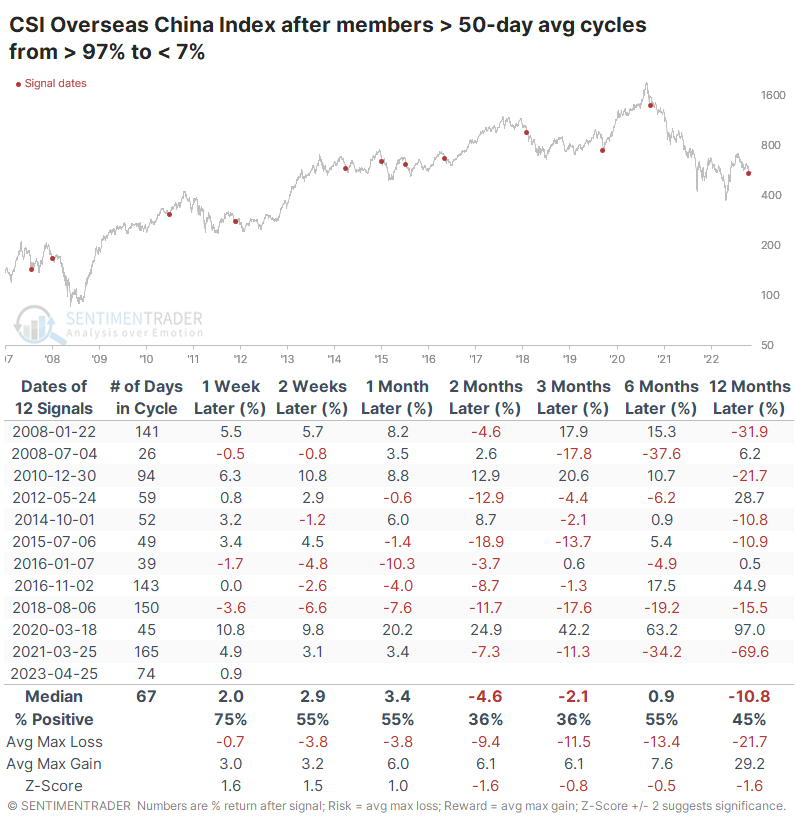
Similar cycles have not typically been kind to the CSI Overseas China Internet Index, the index behind the popular KWEB fund in the U.S. The fund struggled to rebound consistently over the next 2-3 months and suffered a double-digit median loss over the next year.

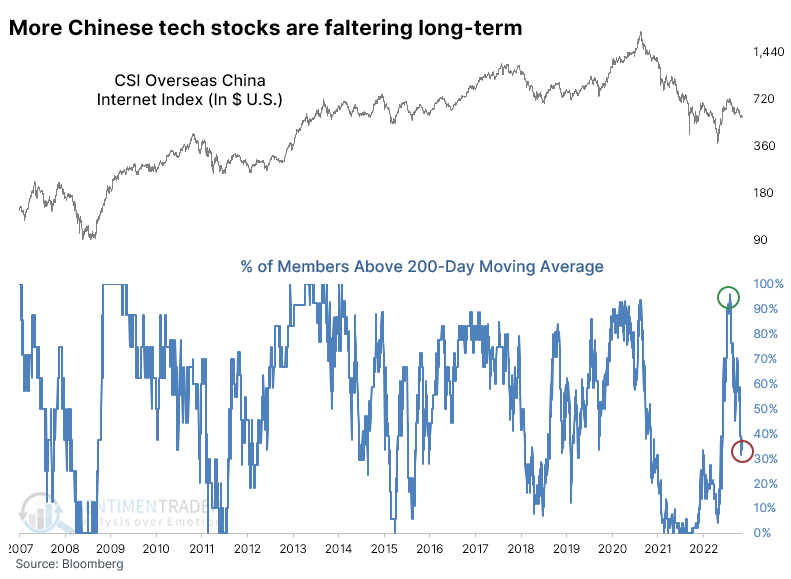
We can see a similar situation with longer-term trends. By late January, more than 95% of the stocks had recovered above their 200-day moving average; a couple of weeks ago, that fell to fewer than 33% of stocks holding above their average.

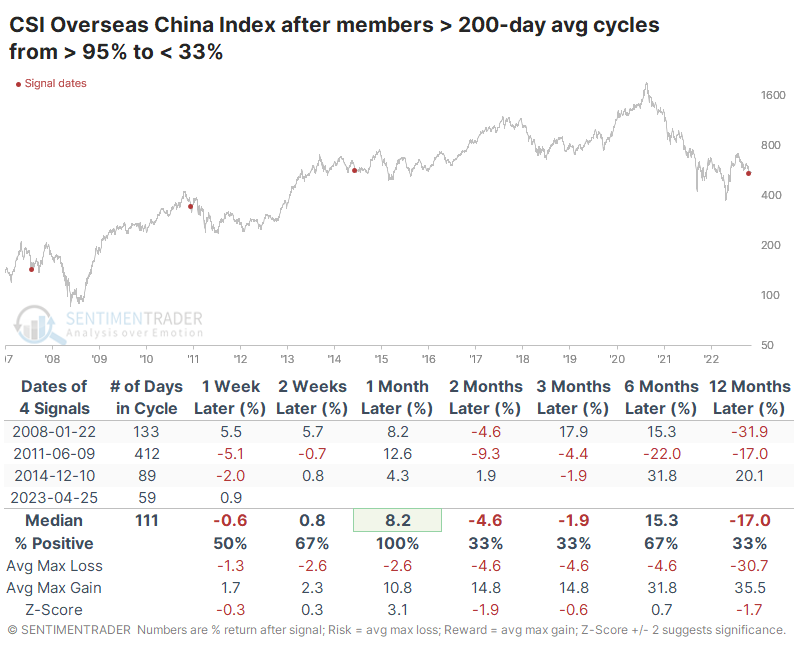
Because we have only about 15 years of history for this sector and the boom-and-bust nature of the extremes, there are few precedents. But the few times the sector underwent similar cycles, it rebounded over the next month each time, then saw great six-month returns twice and a horrid loss once.

What the research tells us...

When we started looking at Chinese tech stocks a little over a year ago, we saw a sector suffering some of the worst losses not only in its limited history but some of the worst of any we'd ever seen in any sector ever. Perhaps the worst. When more than 90% of a broad sector's stocks hit a 52-week low on the same day, well, we'd never seen anything like that before. The recovery into January was impressive, but the sector has not had a good history of sustaining that kind of upside momentum, and it hasn't this time.

The stocks have suffered bad selling pressure, but it hasn't reached the extreme that would suggest a high likelihood of an imminent rebound. The biggest trouble is that we're mostly flying blind here as far as historical precedents go because the only somewhat similar historical periods are 2008-09 and 2011-12. The most compelling thing we've seen with the sector is the long-term (2-3 year) implications of the kind of selling pressure witnessed last year, and the current volatility is the likely price a long-term investor would have to pay to stick with a potential recovery from an "uninvestable" asset.

Sorry, you don't have access to this report

Upgrade your subscription plan to get access
Go to Dasboard
PRODUCTS
SentimenTrader
Trading Tools
Indicators & Data API
‍
Strategies & Scanner
‍
Research Reports
FREE
RESOUrCES
Simple Backtest
Calculator
Simple Seasonality
Calculator
The Kelly Criterion
Calculator
Sentiment Geo Map
‍
Public Research Reports
‍
Education
Sentiment Indicators
‍
Technical Indicators
‍
Pricing
Bundle pricing
‍
FAQ
‍
Announcements
‍
COMPANY
‍
About
‍
In the News
‍
Testimonials
‍
Client Success Stories
CONTACT
‍
General Inquiries
‍
Media Inquiries
‍
Financial Professionals Inquiries
‍
© 2026 Sundial Capital Research Inc. All rights reserved.
Setsail Marketing
TermsPrivacyAffiliate Program
Risk Disclosure: Futures and forex trading contains substantial risk and is not for every investor. An investor could potentially lose all or more than the initial investment. Risk capital is money that can be lost without jeopardizing ones’ financial security or life style. Only risk capital should be used for trading and only those with sufficient risk capital should consider trading. Past performance is not necessarily indicative of future results.

Hypothetical Performance Disclosure: Hypothetical performance results have many inherent limitations, some of which are described below. No representation is being made that any account will or is likely to achieve profits or losses similar to those shown; in fact, there are frequently sharp differences between hypothetical performance results and the actual results subsequently achieved by any particular trading program. One of the limitations of hypothetical performance results is that they are generally prepared with the benefit of hindsight. In addition, hypothetical trading does not involve financial risk, and no hypothetical trading record can completely account for the impact of financial risk of actual trading. for example, the ability to withstand losses or to adhere to a particular trading program in spite of trading losses are material points which can also adversely affect actual trading results. There are numerous other factors related to the markets in general or to the implementation of any specific trading program which cannot be fully accounted for in the preparation of hypothetical performance results and all which can adversely affect trading results.

Testimonial Disclosure: Testimonials appearing on this website may not be representative of other clients or customers and is not a guarantee of future performance or success.