Products
SentimenTrader Trading Tools
‍
Backtest Engine
My Trading Toolkit
Correlation Analysis
Seasonality
Indicators & Data API
‍
Proprietary Indicators & Charts
Market Data API
Strategies & Scanner
‍
50+ Trading Strategies
Smart Stock Scanner
Research Reports
‍
Research Solutions
Reports Library
Free Resources
Simple Backtest Calculator
Simple Seasonality Calculator
The Kelly Criterion Calculator
Sentiment Geo Map
Public Research Reports
Pricing
Company
About
In the News
Testimonials
Client Success Stories
Contact
Log inLoginSign up
< BACK TO ALL REPORTS

Chinese Tech Is Washed Out and Smart Money Is Buying

Jason Goepfert
2021-10-01
Chinese technology stocks have suffered a bout of panic on par with other extremes in the past 15 years.

Few markets have suffered more of a barrage of uncertainty and negativity this summer than Chinese stocks. Technology-related issues have been hit particularly hard from all sides.

Based on the last 15 years of history, they've reached a point of maximum pessimism.

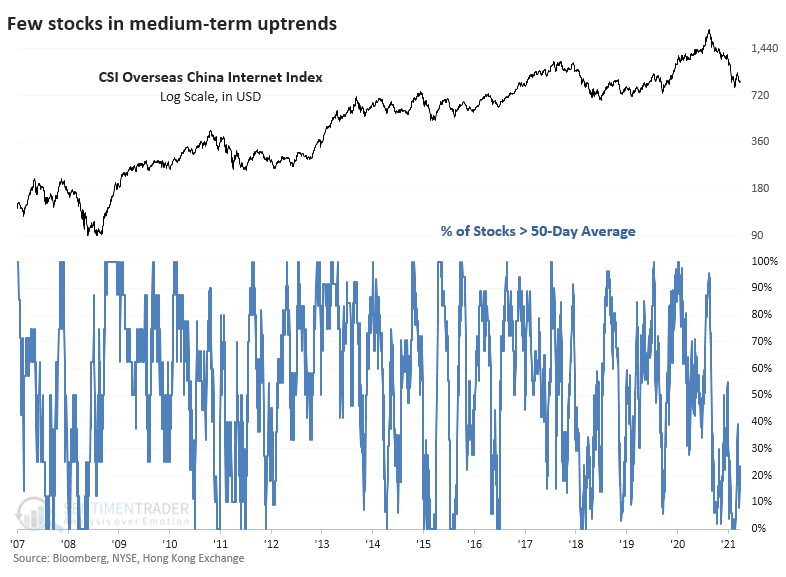
The most popular domestic fund for trading Chinese internet stocks is KWEB, based on the CSI Overseas China Internet Index. The index has just over 50 member stocks, and it's hard to find an uptrend among them. 

During mid-August, precisely 0% of these stocks were trading above their 50-day moving averages. That spiked to around 40% during a relief bounce and has since slid back under 10% as recently as last week.

Chinese technology internet stocks breadth

It's an even uglier picture when looking at the percentage of these stocks in long-term uptrends. In recent days, only 4% of them have closed above their 200-day moving averages, ranking among the very worst readings in available history.

The plunge in late July caused more than 50% of Chinese 'net stocks to fall to a 52-week low, only the third time in 15 years that so many have done so at the same time. Many are gyrating around those low prices, and on any given day, between 10% - 25% of stocks have been setting fresh 52-week lows.


What else we're looking at

  • An in-depth look at various breadth metrics for Chinese technology stocks
  • How this compares to past panics
  • One particular company has been buying back its own shares, and a detailed look at its track record

Stat box

On Thursday, the S&P 500 ended a run of more than 200 days of being within 5% of its latest 52-week high. That was one of only 10 such streaks since 1928.

Etcetera

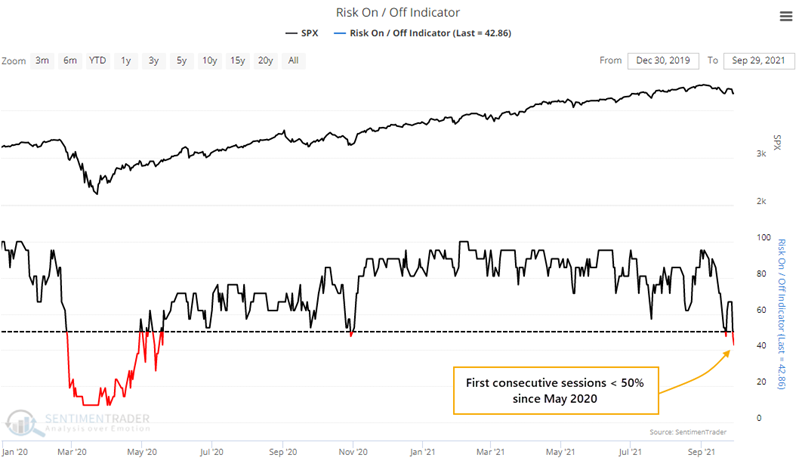
Winding down. Investor sentiment is retreating rapidly from optimism, and behavior has flipped to risk-off mode. This is the first time that our Risk-On / Risk-Off composite has been below 50% on consecutive days since May 2020. That's a record dating back 22 years.

risk on risk off composite indicator

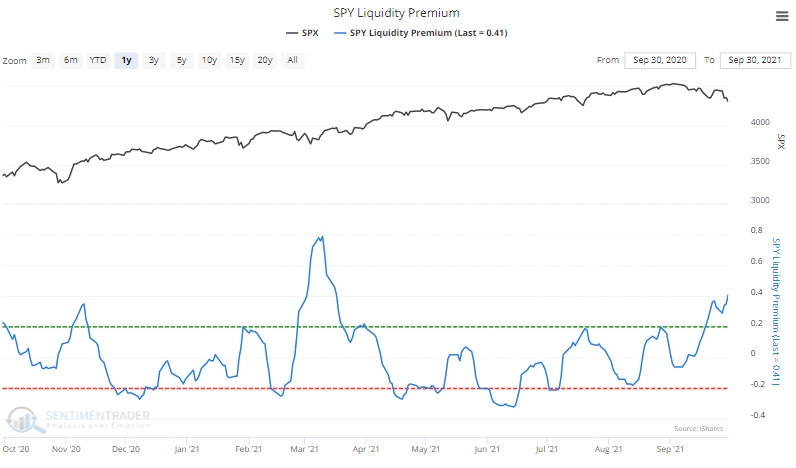
Looking for liquidity. One of the dozens of indicators in the Risk-On / Risk-Off composite is the Liquidity Premium. This shows the demand from traders for the most liquid instruments available and rises when traders panic.

spy liquidity premium

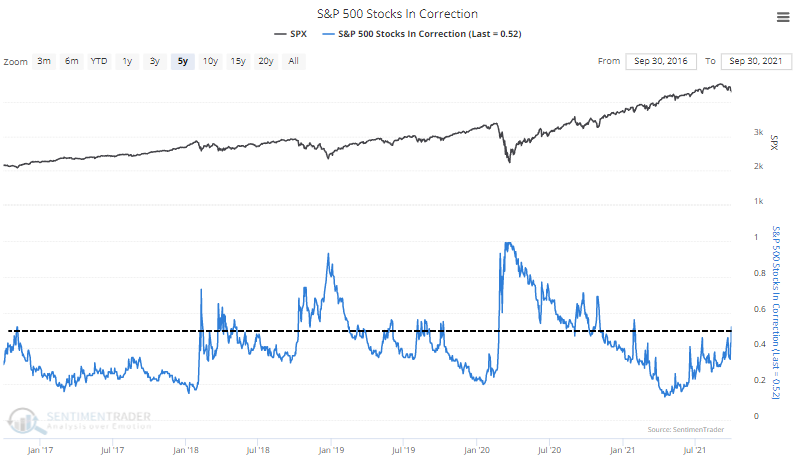
Half in correction. More than 50% of S&P 500 companies are now in a correction, down at least 10% from their highs. During healthy markets, this usually stays below 40%. Risk of a sustained pullback is higher in the indexes when most of its member stocks are struggling.

s&p 500 members in correction down 10%

PRODUCTS
SentimenTrader
Trading Tools
Indicators & Data API
‍
Strategies & Scanner
‍
Research Reports
FREE
RESOUrCES
Simple Backtest
Calculator
Simple Seasonality
Calculator
The Kelly Criterion
Calculator
Sentiment Geo Map
‍
Public Research Reports
‍
Pricing
Bundle pricing
‍
Announcements
‍
FAQ
COMPANY
‍
About
‍
In the News
‍
Testimonials
‍
Client Success Stories
CONTACT
‍
General Inquiries
‍
Media Inquiries
‍
Financial Professionals Inquiries
‍
© 2025 Sundial Capital Research Inc. All rights reserved.
Setsail Marketing
TermsPrivacyAffiliate Program
Risk Disclosure: Futures and forex trading contains substantial risk and is not for every investor. An investor could potentially lose all or more than the initial investment. Risk capital is money that can be lost without jeopardizing ones’ financial security or life style. Only risk capital should be used for trading and only those with sufficient risk capital should consider trading. Past performance is not necessarily indicative of future results.

Hypothetical Performance Disclosure: Hypothetical performance results have many inherent limitations, some of which are described below. No representation is being made that any account will or is likely to achieve profits or losses similar to those shown; in fact, there are frequently sharp differences between hypothetical performance results and the actual results subsequently achieved by any particular trading program. One of the limitations of hypothetical performance results is that they are generally prepared with the benefit of hindsight. In addition, hypothetical trading does not involve financial risk, and no hypothetical trading record can completely account for the impact of financial risk of actual trading. for example, the ability to withstand losses or to adhere to a particular trading program in spite of trading losses are material points which can also adversely affect actual trading results. There are numerous other factors related to the markets in general or to the implementation of any specific trading program which cannot be fully accounted for in the preparation of hypothetical performance results and all which can adversely affect trading results.

Testimonial Disclosure: Testimonials appearing on this website may not be representative of other clients or customers and is not a guarantee of future performance or success.