
China's Chip Export Exemption

Based on News: China exempts chips used by carmakers from export curbs
Source Link: bbc_business
Related Symbol: [SMH (Semiconductors (SMH)), ON (ON Semiconductor Corp), LSCC (Lattice Semiconductor Corp.), NXPI (NXP Semiconductors NV), GM (General Motors C)]
Key Points
- China exempts automotive chips from export curbs, easing supply chain concerns for carmakers.
- Historical backtests show semiconductors (SMH) with 78% positive 1-month returns, median 2.34%, suggesting resilience.
- Mixed performance across assets; semiconductors show consistency, while automakers like GM exhibit higher volatility.
Current Market Focus
China's decision to exempt chips used by carmakers from export restrictions aims to support its domestic automotive industry and mitigate ongoing supply chain disruptions. This policy shift reflects strategic industrial intervention, similar to past events like the U.S. easing Huawei restrictions in 2019 or the EU's rare earth magnet support in 2021. Historical parallels suggest such measures often trigger mixed but generally positive market reactions.
The immediate market reaction has been cautiously optimistic, particularly for semiconductor stocks and automotive manufacturers reliant on Chinese chip supplies. The following analysis explores how identified symbols-SMH, ON, LSCC, NXPI, and GM-have historically performed around similar trade policy events, using comprehensive backtest summaries to gauge potential outcomes.
Historical Event References (Event & Date)
- Trump's Rare Earths Deal With Australia to Fight China Summary:US and Australia signed a pact to boost rare earth access, addressing strategic supply chain needs. (Date: 2025-10-22 (Source: Bloomberg))
- ASML says geopolitics, new export restrictions remain risks Summary:Germany granted case-by-case exemptions for machine tool exports to Chinese industrial customers despite broader controls. (Date: 2024-02-14 (Source: Reuters))
- EXCLUSIVE EU considers help for rare earth magnet production - sources Summary:EU proposes support for rare earth magnet production, vital for electric car motors, to boost home output. (Date: 2021-08-23 (Source: Reuters))
- India, big vaccine exporter, now seeks imports as COVID-19 cases surge Summary:India imposed export bans on COVID-19 vaccines in 2020 but granted selective exemptions to key partners like COVAX. (Date: 2021-04-13 (Source: Reuters))
- EXCLUSIVE Trump admin slams China's Huawei, halting shipments from Intel, others - sources Summary:U.S. halts shipments to Huawei, targeting 5G tech, while allowing less sophisticated exports under adjusted policies. (Date: 2021-01-17 (Source: Reuters))
- What U.S. Sanctions Mean for Iran's Coronavirus Fight Summary:U.S. exempts humanitarian goods like medicine and medical supplies from trade sanctions during COVID-19. (Date: 2020-04-06 (Source: Bloomberg))
- In a slump Summary:Japan tightened export controls on tech materials to South Korea in 2019, sparking industry tensions. (Date: 2019-07-08 (Source: Bloomberg))
- US eases some restrictions on China's Huawei, reportedly ... Summary:US temporarily eased trade restrictions on Huawei to minimize supply chain disruptions. (Date: 2019-05-21 (Source: CNBC))
- Exclusive: U.S. approves landmark crude oil export swaps with Mexico Summary:U.S. approves limited crude oil exports to Mexico, marking a key exception to the long-standing export ban. (Date: 2015-08-14 (Source: Reuters))
- China Cuts Export Quotas for Rare Earths by 35% Summary:China reduced rare earth export quotas by 35% in 2011, impacting global supply for high-tech industries. (Date: 2010-12-29 (Source: Bloomberg))
Resilient with strong long-term gains
SMH, representing the broader semiconductor sector, has historically shown resilience to trade policy shifts, with a tendency toward positive returns over longer horizons. The backtest summary indicates mixed short-term performance but strong consistency over 1-month and longer periods.
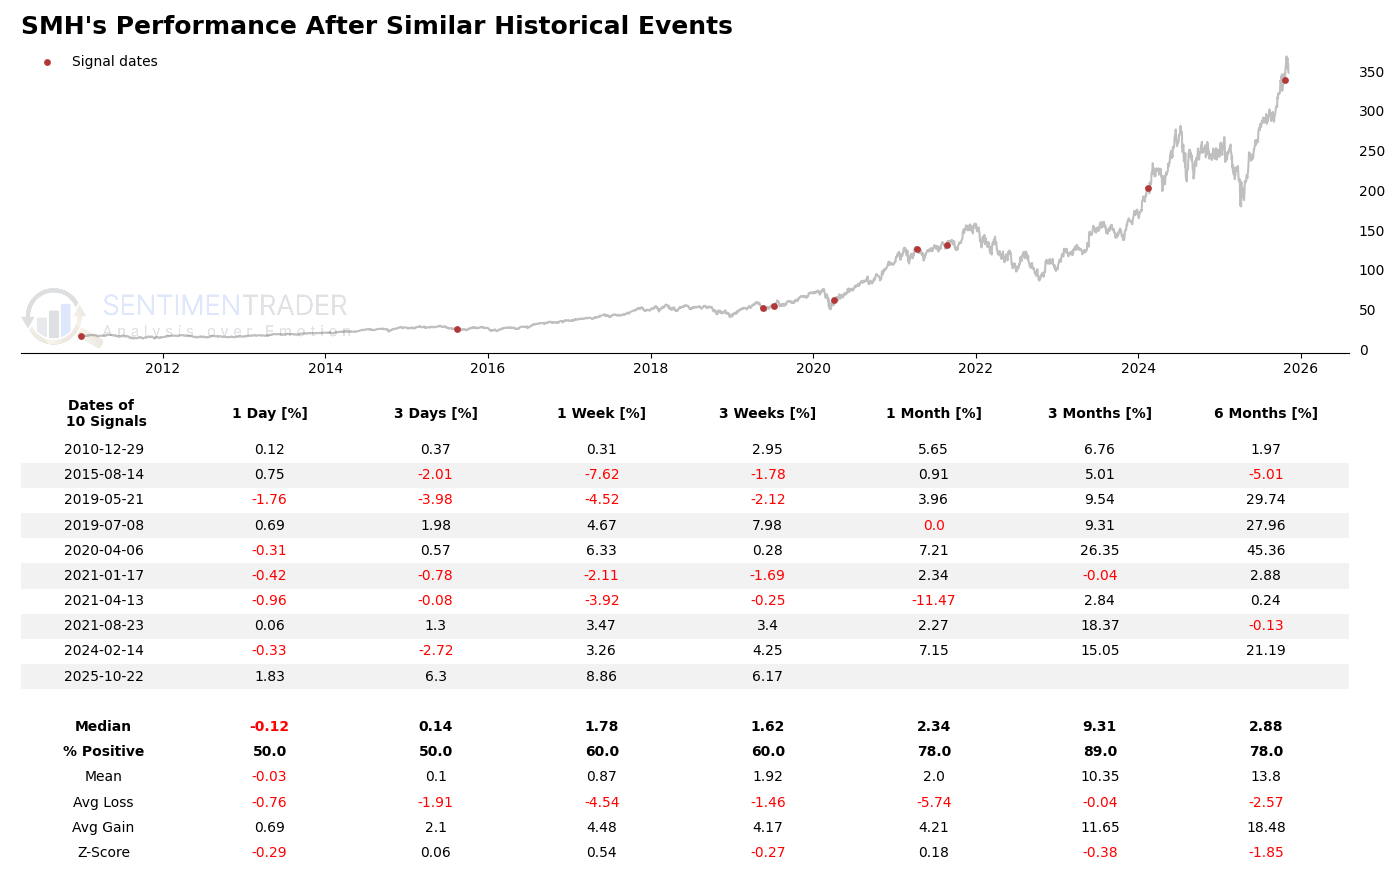
SMH's summary statistics reveal a median 1-month return of 2.34%, with 78% of events yielding positive results. The 3-month median jumps to 9.31% (89% positive), highlighting improving returns over time. Z-scores are neutral near-term but turn negative for 6 months (-1.85), suggesting less statistical significance despite high avg gains (18.48%). Extreme events include a 45.36% 6-month gain post-2020-04-06, underscoring upside potential during supply chain relief.
Volatile with high-reward potential
ON Semiconductor exhibits higher volatility in response to trade policy events, with a split between significant gains and losses. Historical performance shows a 67% positive rate for 1-month returns, but deeper drawdowns in some cases.
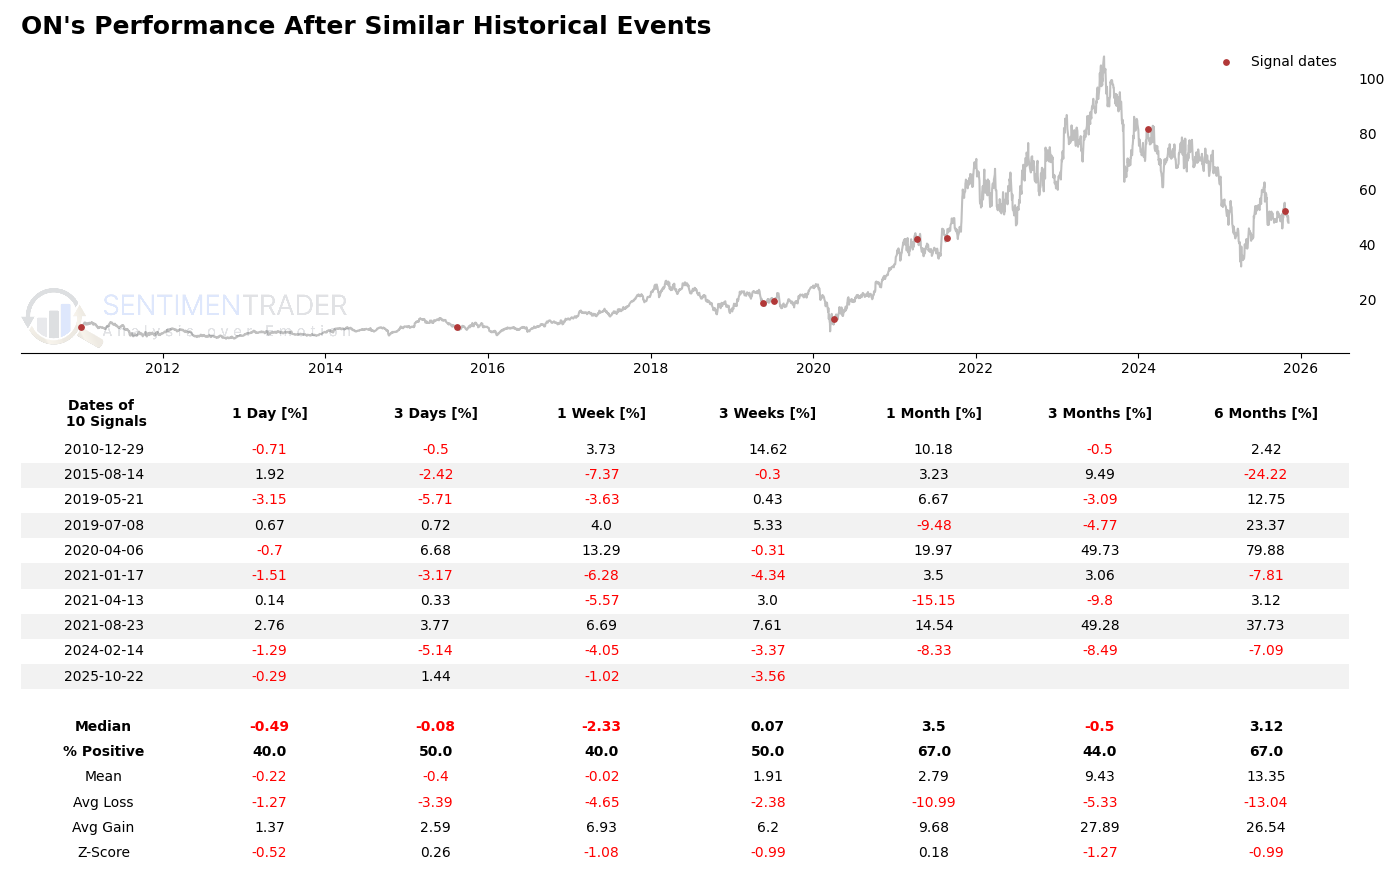
ON's 1-month median return is 3.5%, yet the mean (2.79%) is dragged down by extreme losses (avg loss: -10.99%). The 3-month mean (9.43%) masks wide dispersion, with events like 2020-04-06 delivering 49.73% gains but 2024-02-14 showing -8.49%. The 6-month avg gain (26.54%) far exceeds losses (-13.04%), suggesting asymmetric upside.
Consistent mid-term outperformer
LSCC has demonstrated strong performance consistency, particularly over 3-month and 6-month horizons, with 78% and 89% positive rates, respectively. The asset tends to rebound from short-term volatility.
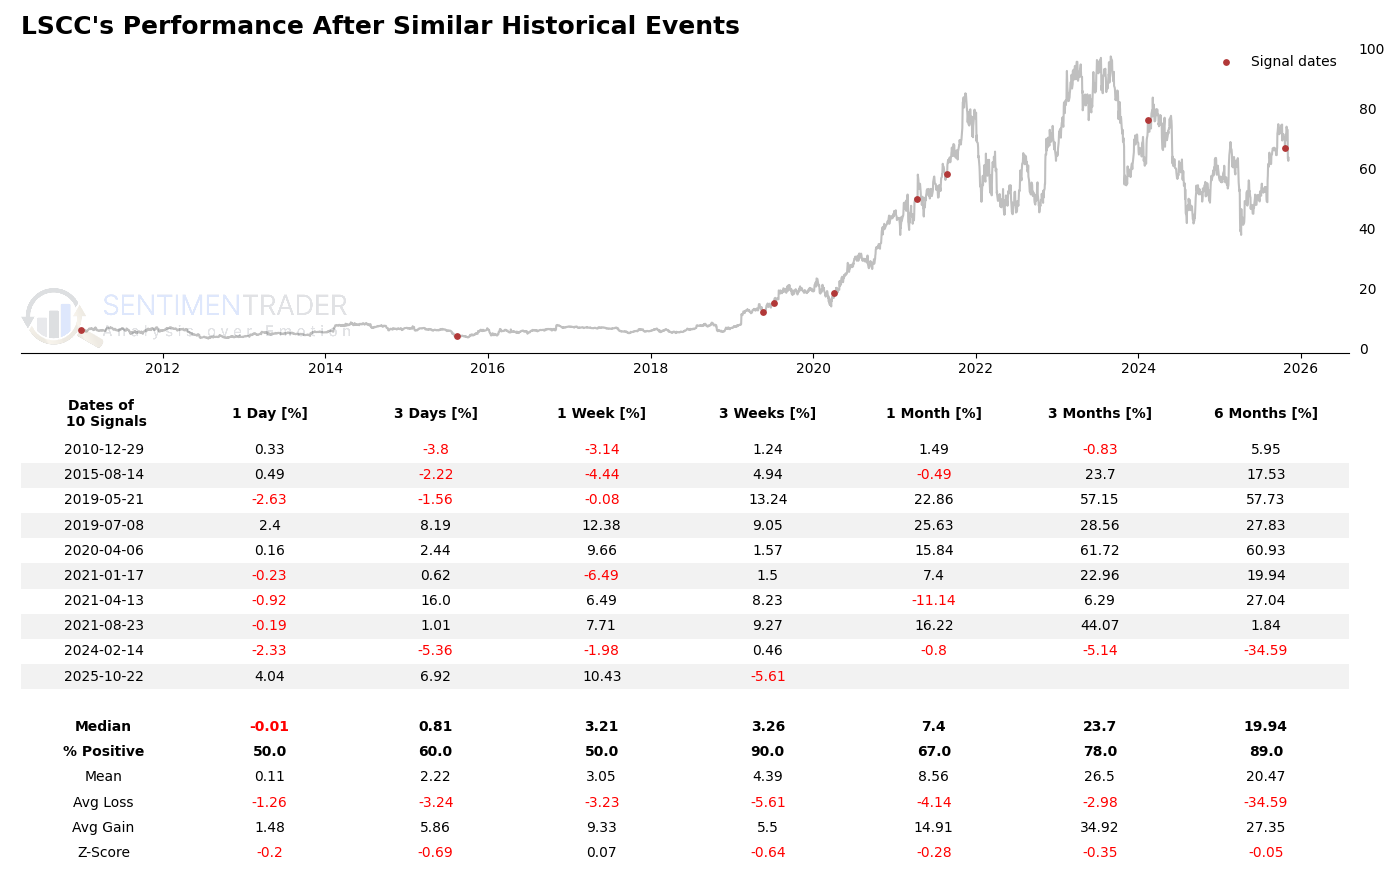
LSCC's 3-month median return (23.7%) and mean (26.5%) are standout metrics, supported by 78% positive events. The 6-month avg gain (27.35%) dwarfs losses (-34.59%), though the latter reflects outlier risk (e.g., -34.59% post-2024-02-14). Notably, 90% of 3-week periods were positive, with median 3.26% returns.
Stable with long-term upside
NXPI shows stability in shorter holding periods, with improving returns over time. The 1-month median (1.53%) and 78% positive rate suggest reliability, while 3-month returns (median 10.78%) reflect compounding upside.
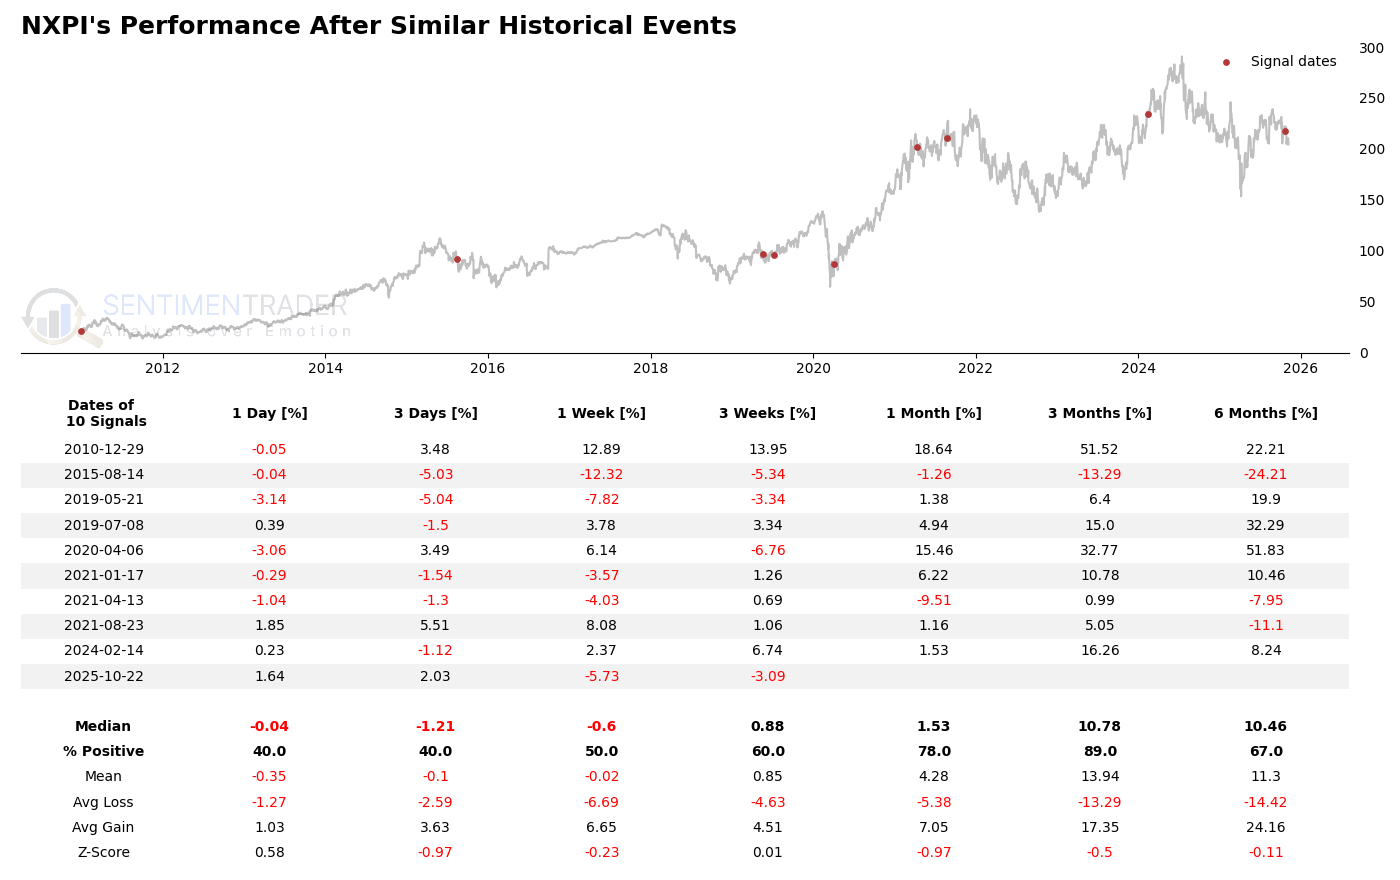
NXPI's 3-month mean (13.94%) exceeds the median (10.78%), skewed by events like 2010-12-29 (+51.52%). The 6-month avg gain (24.16%) is double the avg loss (-14.42%), indicating favorable risk/reward. Z-scores are neutral, but the 89% 3-month positive rate underscores consistency.
Short-term resilience, long-term variability
GM displays short-term resilience (60% positive 1-week returns) but higher variability over longer periods, with only 33% positive 6-month returns. The asset is sensitive to macro supply chain shifts.
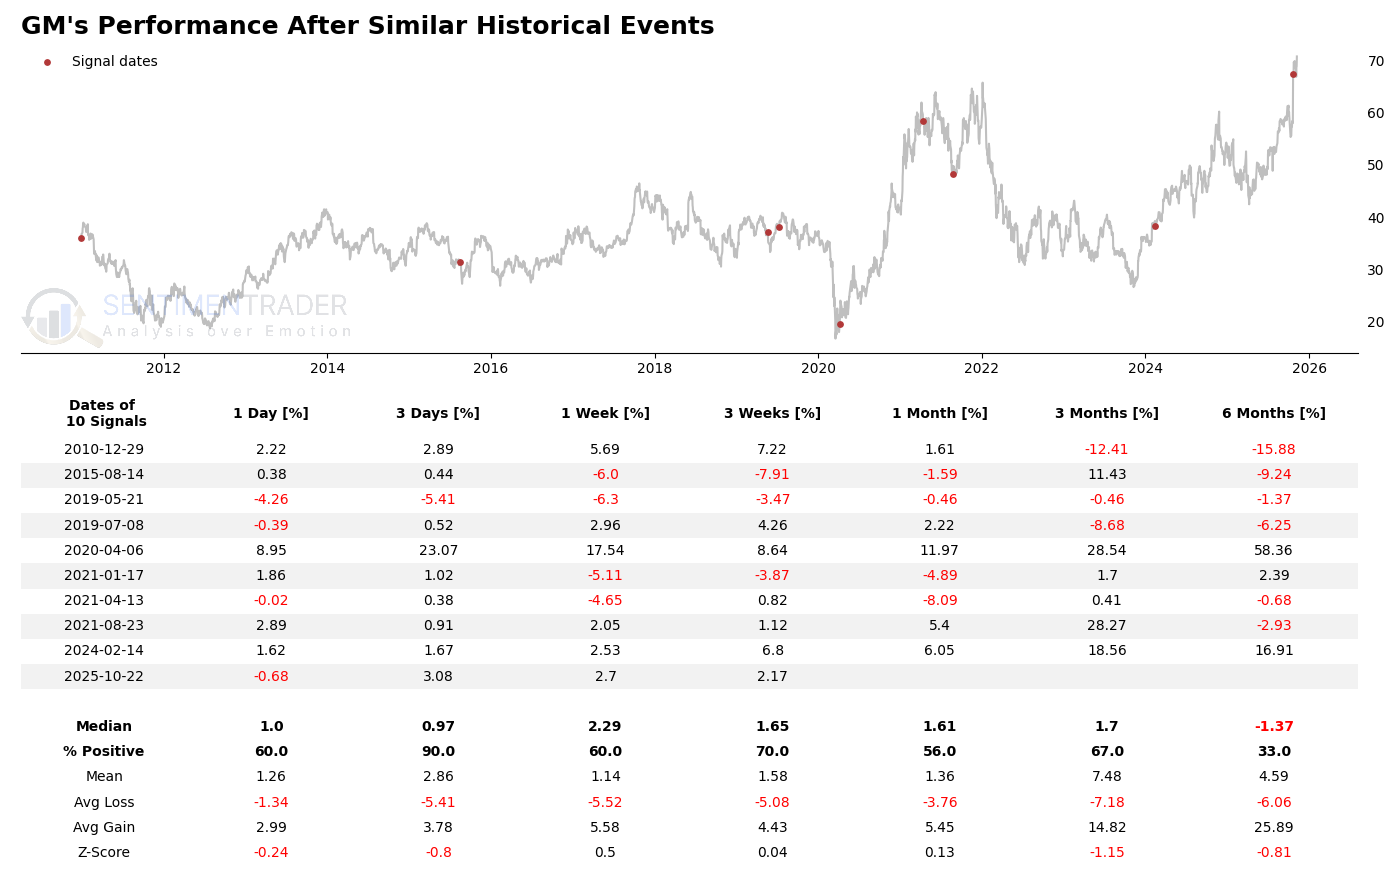
GM's 1-week median (2.29%) and 60% positive rate contrast with a 6-month median (-1.37%). Extreme events include a 58.36% 6-month gain post-2020-04-06, but 4 of 9 6-month periods were negative. The 3-month mean (7.48%) is buoyed by outliers like 2020-04-06 (+28.54%).
What the research tells us...
China's chip export exemption is likely to benefit semiconductor stocks (SMH, LSCC, NXPI) most consistently, given their historical median returns of 2-10% over 1-3 months and high positive rates (78-89%). ON and GM offer higher upside potential but with greater volatility, as seen in their wider dispersions and outlier events. Key risks include geopolitical escalation or weaker-than-expected automotive demand. Investors should monitor SMH's 6-month Z-score (-1.85) for mean reversion signals and GM's short-term resilience (60% positive 1-week returns) for tactical opportunities. Historical extremes-like LSCC's 61.72% 3-month gain-highlight selective upside but require careful risk management.
Disclaimer
This report is generated automatically based on publicly available information, SentimenTrader's proprietary finance news filter tool and Backtest Engine, with AI assistance. It should be noted that the framework and narrative of this analysis were developed through an interactive dialogue process with an AI assistant, combining data-driven insights from SentimenTrader's tools. A record of this process may be found per requesting. It is intended for informational purposes only and does not constitute financial advice or a recommendation to buy or sell any securities. Market conditions can change rapidly, and past performance is not indicative of future results. Always conduct your own thorough research and consult with a qualified financial advisor before making any investment decisions. The accuracy and completeness of the information are not guaranteed.