
Cheap energy speculation

Key Points
- Dean has written several compelling notes lately regarding crude oil and homebuilders
- This piece focuses on crude oil/energy
- Below, we present an example of one inexpensive way to speculate on a bounce in energy
Betting on a rally in oil
In this piece dated 2025-01-30, Dean's research suggested the potential for a bounce in crude oil over the next two to three months. As you can see from the annual seasonal chart for crude oil futures below, betting on energy during this time of year is generally not the worst idea in the world.
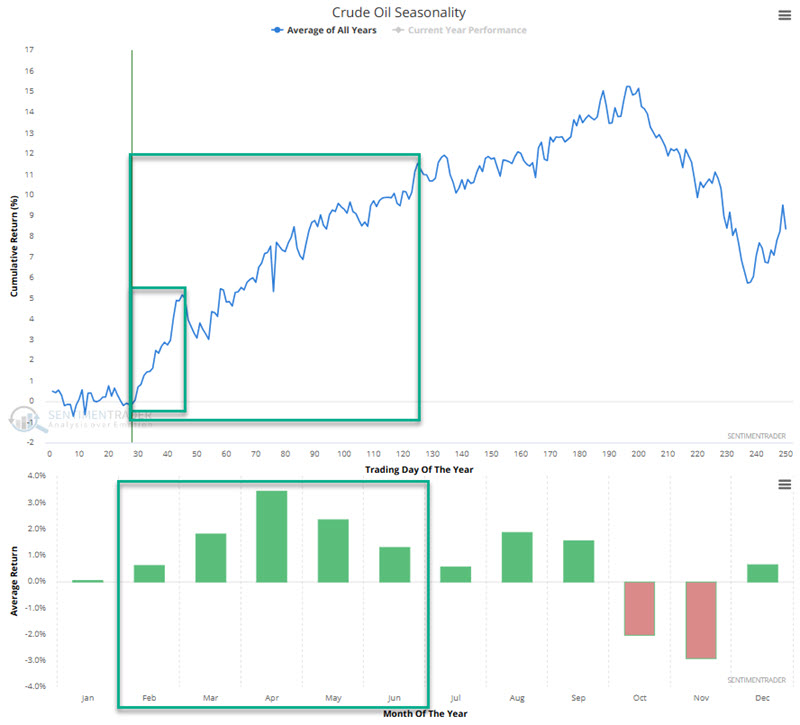
Let's reiterate here that seasonality is merely an average of what has happened in the past and is NOT a roadmap to what will happen in any given year and that Dean's original piece was based more on a specific price pattern in crude oil futures. With those caveats in mind, I looked for a potential example trade using options on the United States Oil Fund ETF (ticker USO) to take advantage of a bounce in oil.
The good news is that USO trades roughly 30,000 options a day. The bad news is that that volume is very spread out across various expiration months, and bid/ask spreads are prohibitively wide. The table below (courtesy of Optionsanalysis.com) displays the near-the-month options for April 17 2025 USO options.
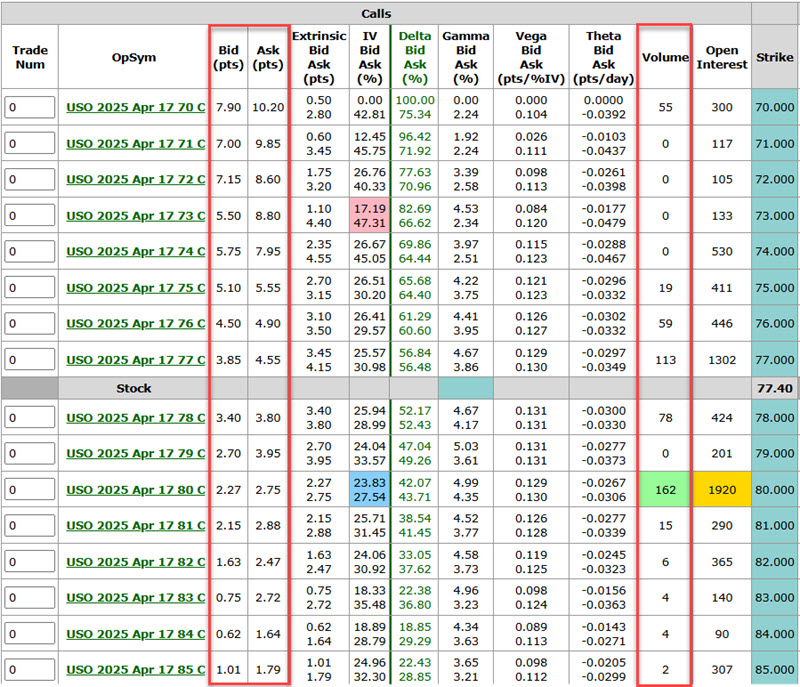
Note the significant gaps between the bid and ask prices. Consider if we bought the at-the-money Apr17 77 strike price call to appreciate the implications. If we bought using a market order (not recommended), we would pay $455 ($4.55 x 100 shares of USO). If we changed our mind instantly and decided to sell it, we would only receive $385 ($3.85 x 100 shares of USO) in proceeds. As a direct result of the wide bid/ask spread, we would lose -$70, or -15.4%.
It is possible (and certainly recommended) to mitigate this by using limit orders. However, a fill is not guaranteed, and you are still exposed to "bid/ask spread only" risk.
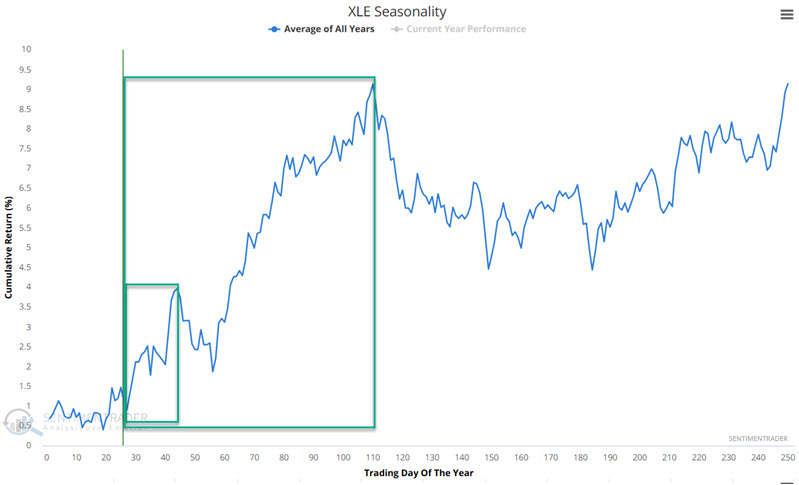
Based on this, I turned my attention to the Energy Select Sector SPDR Fund (ticker XLE). The chart below notes that XLE has a seasonal expectation in the weeks and months ahead similar to crude oil.
Betting on oil using a proxy
For the record, what follows is an "example" and not a specific "recommendation" (at Sentimentrader, we are analysts and not advisors). With that in mind, consider a trader who thinks that crude oil-and, by extension, the highly correlated energy sector-will "pop" sometime in the next several months. However, the trader is not interested in making a huge capital commitment.
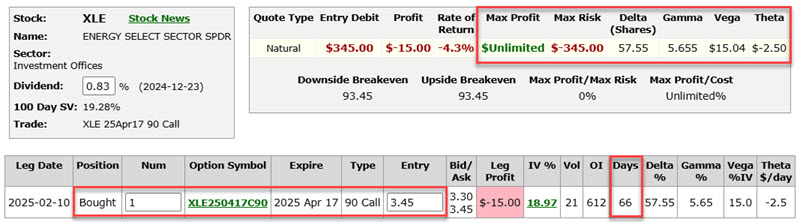
One alternative is to buy 100 shares of XLE at $90.51 a share, which would require a commitment of $9,051. Another alternative for a trader looking to commit less capital would be to buy the XLE April 17 2025 90 strike price call option at $3.45, requiring a capital commitment of $345.
The particulars for this position appear below (courtesy of Optionsanalysis.com).
The risk curves-i.e., the expected dollar gain or loss based on the price of XLE shares as of four different dates (the red line is today) leading up to option expiration (the black line)-appear in the chart below.
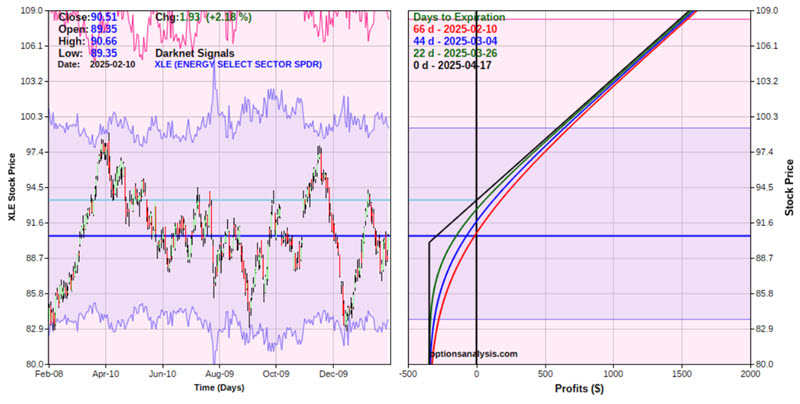
Things to note:
- The cost to enter this position trading a 1-lot is $345
- The worst-case scenario is that the position is held until expiration (April 17) and that XLE shares are trading at $90 or below, in which the entire $345 will be lost
- The Delta for this position is 57.55 (which means that this position is presently roughly equivalent to holding 57 shares of XLE - though note that Delta will change as time goes by and XLE price fluctuates)
- The Gamma for this position is 5.655 (which means that for each $1 XLE shares gain or lose, this position will gain or lose 5.655 Delta points)
- The Vega for this position is $15.04 (which means that if option implied volatility rises one percentage point, this position will gain roughly $15.04, and vice versa; In other words, an increase in volatility will result in more time premium being built into the price of the option)
- The Theta for this position is -$2.50 (which means that this position will lose $2.50 in time premium due solely to the passage of one day's time)
- The breakeven for this price is $93.45 (strike price of $90 plus premium paid of $3.45)
- Above $93.45, the option price will gain point-for-point with the stock
Thoughts on position sizing and position management
Let's say a trader has a $25K account and is willing to commit a maximum of 3% to an option trade. 25K x 0.03 = $750. So, this trader could buy two calls for $690 ($345 premium x 2 options).
Deciding how to manage the position is up to each individual trader. The first question to answer is, "If XLE declines, will I simply hold until expiration in hopes of a bounce (risking the entire premium), or will I consider cutting a loss early." Note that there is no correct answer; it is only a matter of personal preference.
As an example of a plan for managing the position, if things go right, a trader holding a 2-lot might consider selling half the position if XLE retests its previous recent highs near $98 a share and letting the other ride in hopes of a more significant gain.
Again, the above are "examples" of one approach to managing the position, not specific recommendations.
What the research tells us...
Dean's research suggests the potential for a rally in crude oil and-hopefully, in this case-by extension, a rally in the energy sector of the stock market. For traders looking to make a play but not willing to make large capital commitments, an option position can be a viable alternative. But do pay attention to the fact that 100% of the option premium paid can be lost if the underlying security does not do what you hope.