
Chasing Rumble's (RUM) Breakout? Here's What the Historical Data Shows

Key points:
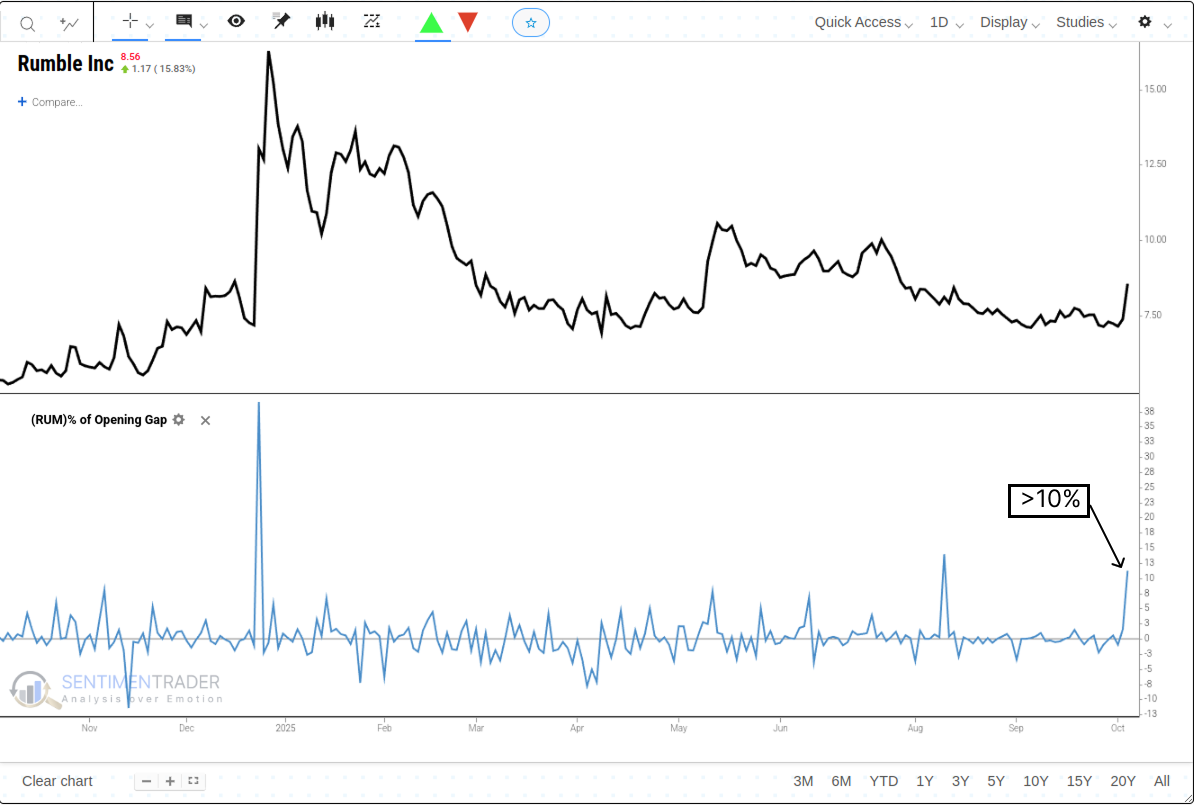
- Rumble Inc (RUM) surged last Friday, October 3rd, opening with a gap of 11.23%.
- A historical backtest of similar large opening gaps for RUM reveals an extremely volatile and inconsistent precedent.
- The data highlights a distinct "pop and drop" pattern, with a strong median return after two days that quickly fades in the subsequent weeks.
- Subscribers can use the Backtest engine to evaluate the specific historical risk/reward profile of price patterns for any individual stock.
Assessing the Outlook for a Volatile Stock with the Backtest Engine
Last Friday, October 3rd, Rumble Inc (RUM), a video-sharing platform and cloud services provider, surged at the opening bell, gapping up 11.23%. This type of explosive move, often referred to as an "Episodic Pivot," generates significant interest from traders and investors alike.
Rumble Inc. operates a suite of digital media and cloud infrastructure services. Its primary offering is rumble.com, a video-sharing platform, alongside its subscription-based community platform, locals.com. The company is also expanding into enterprise solutions with Rumble Cloud, offering infrastructure-as-a-service to business clients.
While such a move can seem intuitively bullish, it is crucial to consult the historical data to understand the potential outcomes for this specific stock. Does this momentum tend to continue for RUM, or does it typically fade?
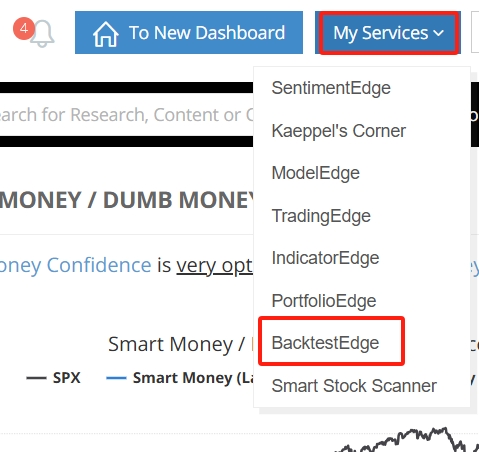
On the Sentimentrader homepage, click on My Services and select BacktestEdge.
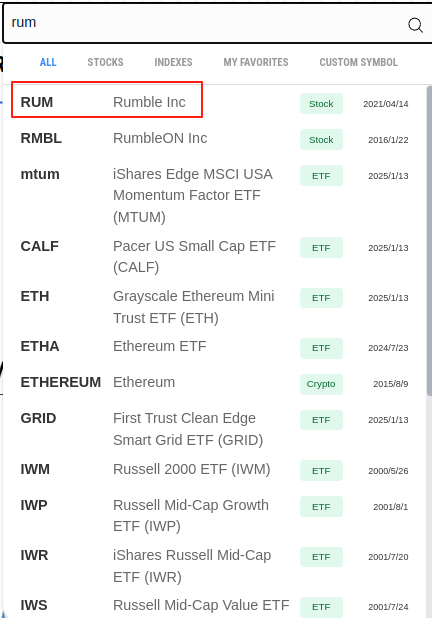
In the Search Box, type the stock symbol RUM and select Rumble Inc.
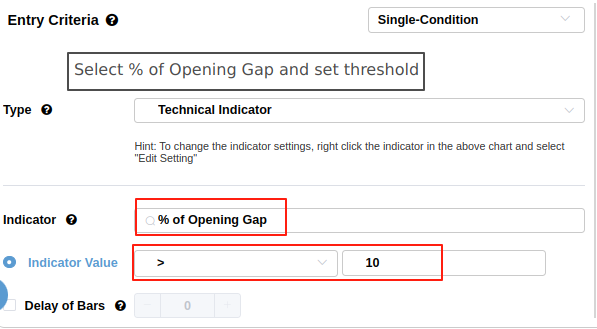
In the Entry Criteria section, we will define the event. Select Technical Indicator, % of Opening Gap, greater than (>), and type in an indicator value of 10. For this analysis, we can leave the default exit conditions to view the full range of historical performance across different time frames. For related backtest, click here.
Assessing the Historical Risk/Reward Profile
Once the backtest is complete, the results tables allow us to analyze the historical tendencies for this specific setup.
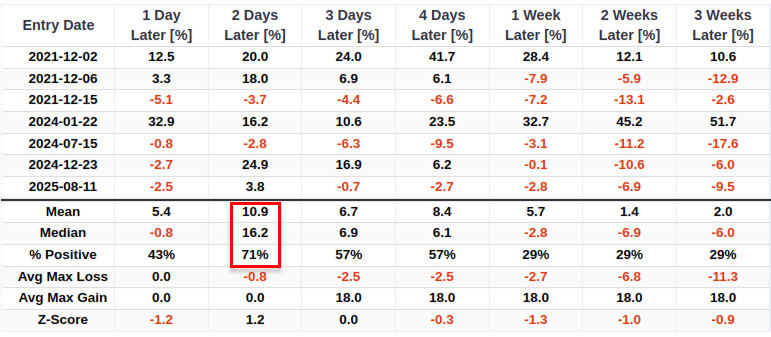
The historical data reveals a distinct and challenging "pop and drop" pattern. A powerful median return of +16.2% materializes just two days after the signal, suggesting a very short-term speculative frenzy. However, that strength evaporates almost immediately. The median returns turn sharply negative by the one-week (-2.8%), two-week (-6.9%), and three-week (-6.0%) marks. Furthermore, the win rates, after peaking at 71% on day two, fall to a mere 29% for these subsequent time frames.
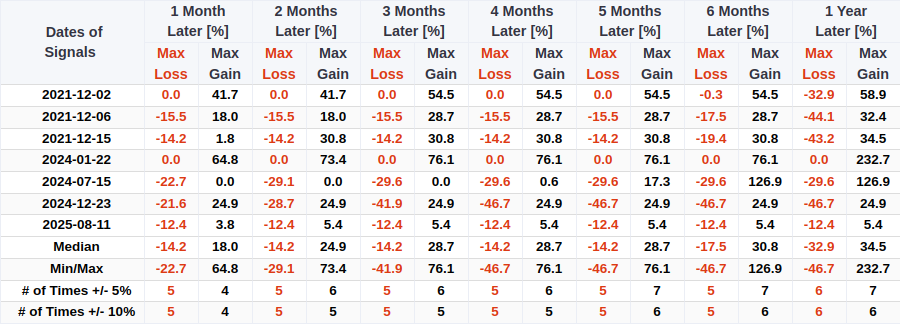
A look at the maximum gain and loss over longer time frames further highlights the stock's historical volatility. This long-term volatility is consistent with the "pop and drop" nature seen in the short-term data, painting a picture of a stock prone to extreme price swings. The median maximum loss over the subsequent year was a significant -32.9%. The data shows that historical signals have been followed by both extreme gains (e.g., a max gain of +232.7%) and extreme losses (e.g., a max loss of -46.7%), indicating a highly unpredictable path.
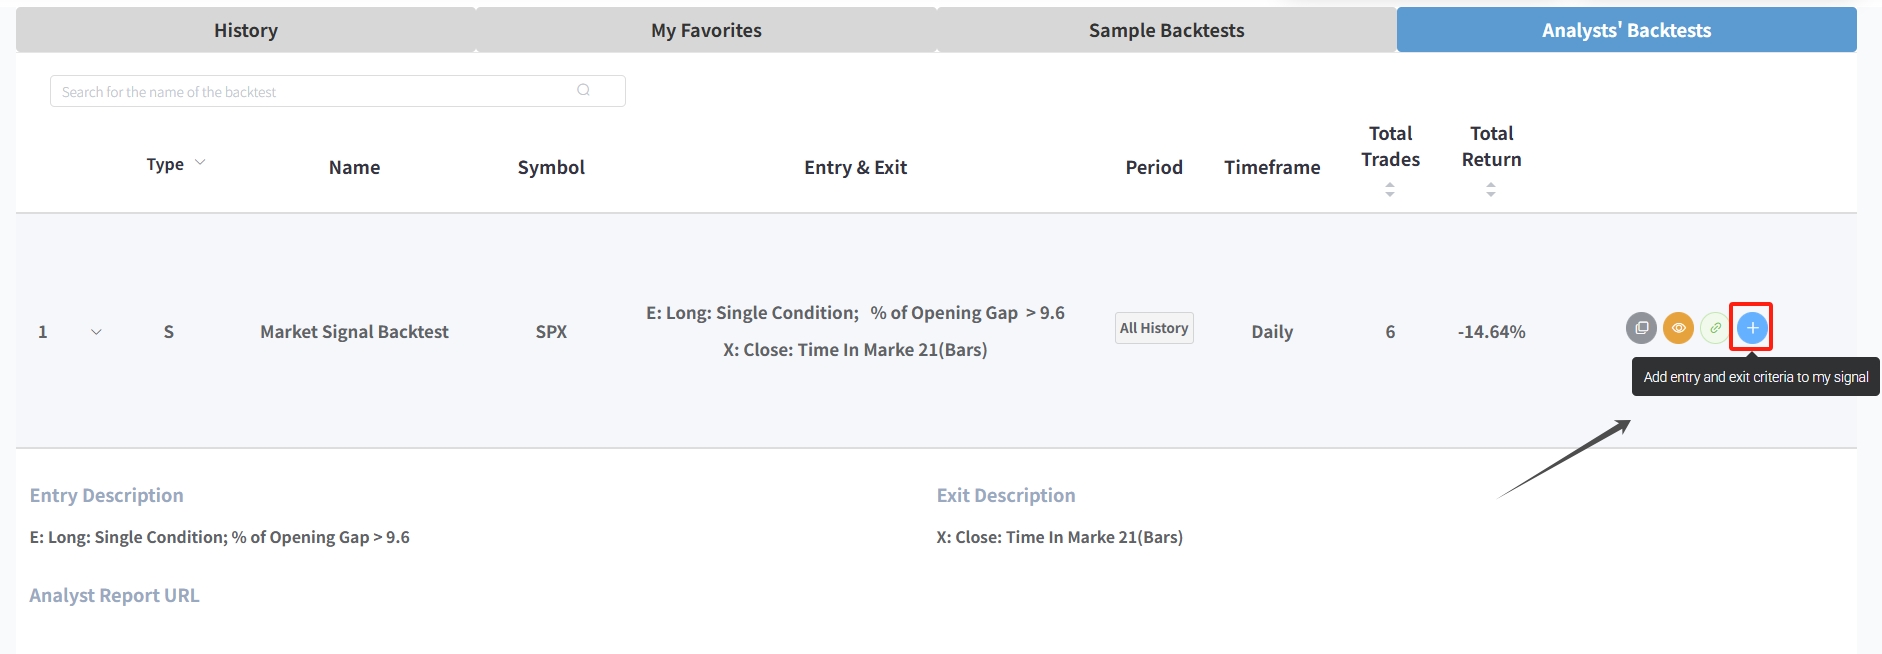
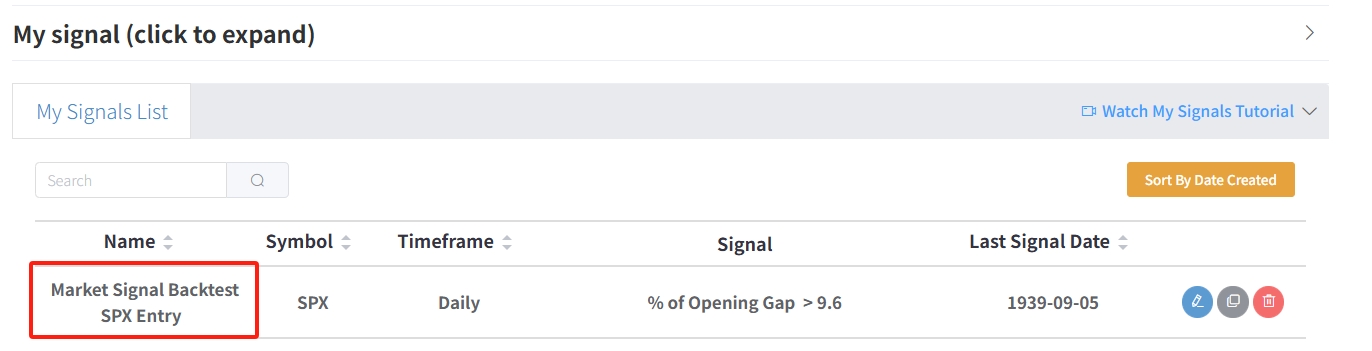
Never miss a crucial signal again. The Analysts' Backtests interface now features a "+ Add to My Signals" button that lets you instantly import entry and exit criteria from any analyst's backtest (e.g., a Trend Tracking Backtest, Market Signal Backtest, or other strategy) into your personal My Signals List.
What the research tells us...
Rumble Inc (RUM) experienced a large 11.23% opening gap, a pattern that can often attract bullish attention. However, a historical backtest of similar gaps for this specific stock does not show a consistent bullish edge. Instead, the data-driven precedent is characterized by a brief, two-day surge followed by a rapid fade, extreme volatility, and significant long-term drawdown risk.
This case study demonstrates the importance of using the Backtest engine to go beyond intuition. While a large opening gap might seem bullish on the surface, a data-driven look at the historical precedents for RUM reveals a much more complex and volatile risk profile, allowing for a more informed decision-making process.