Key points:
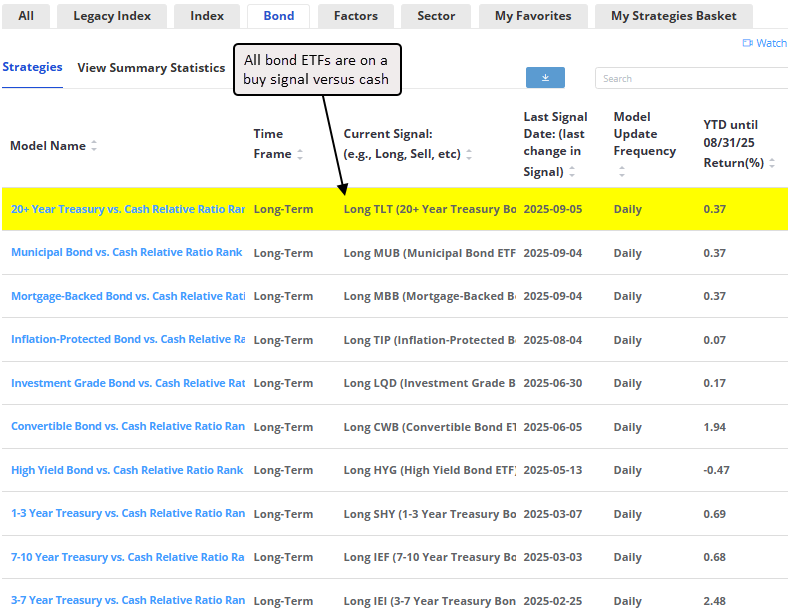
- All bond ETFs are now flashing relative strength buy signals against cash
- Similar precedents suggest a broad bond ETF rallies (yield lower) over the next six months
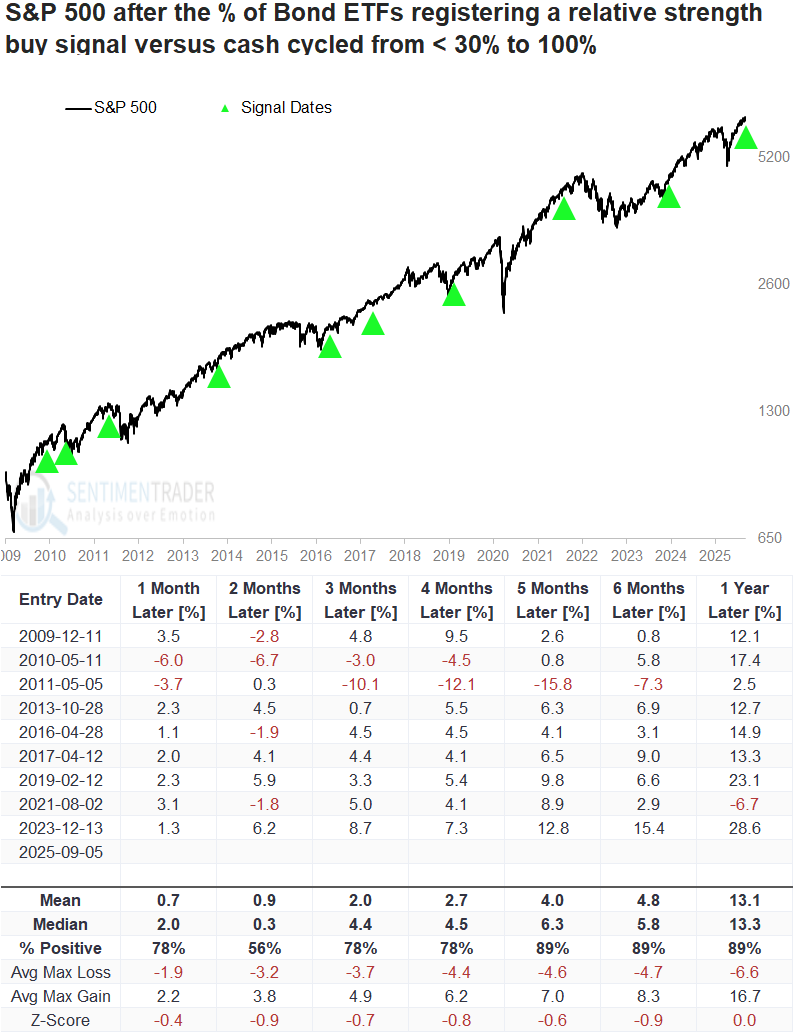
- The S&P 500 rallied in all but one case, six and twelve months later
A message from the bond market
Last week's soft employment report triggered a sharp move in Treasuries, sending yields across the curve plunging as investors quickly priced in a more dovish Fed policy outlook. The decline in yields was enough to push the final component of our relative strength timing system into buy territory, officially generating a bond signal for the 20+ Year Treasury ETF (TLT).
With that shift, all ten measures across a diverse set of fixed-income categories now favor bonds over cash. This broad-based confirmation underscores a decisive momentum swing in favor of duration and away from short-term cash proxies.
You can track these relative strength timing systems in the "BOND" folder under the Strategies section of the website. Click
here for the link.
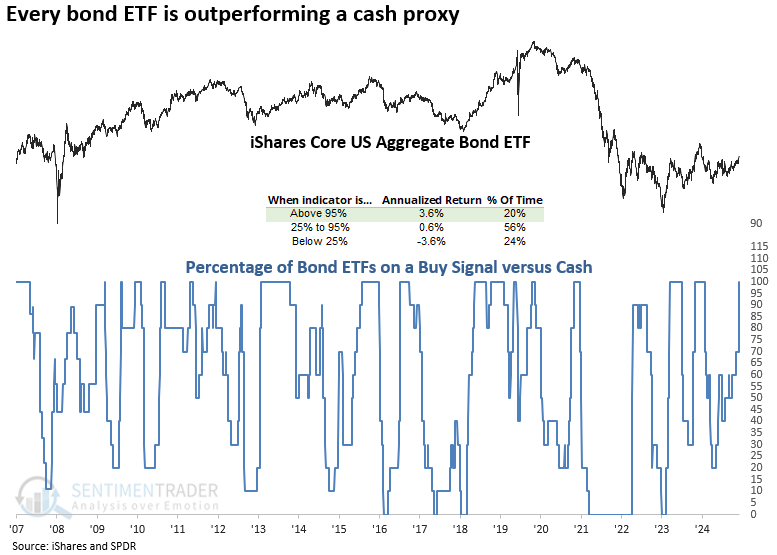
As shown in the chart below, when all bond systems remained on a buy signal versus cash, the iShares Aggregate Bond ETF (AGG) delivered an annualized return of 3.6%, notably outperforming periods when fewer systems were aligned.
A more favorable bond environment
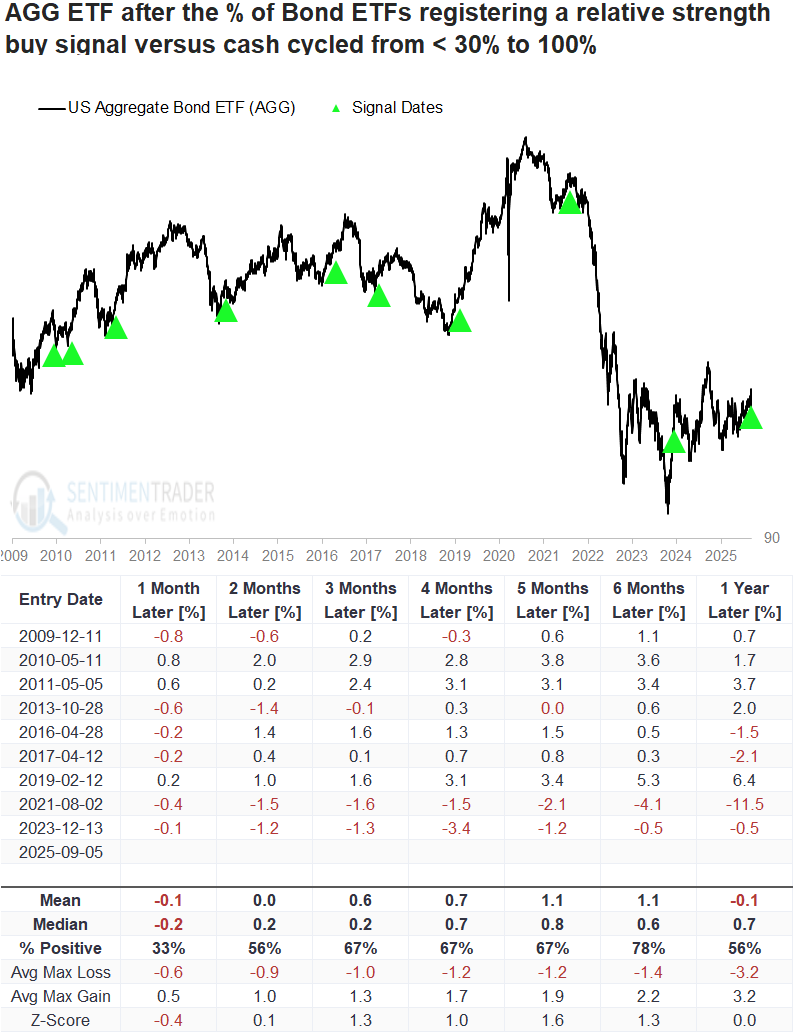
Although the sample size is small due to data limitations, whenever the percentage of Bond ETFs on a relative strength buy signal compared to cash cycled from below 30% to 100%, the iShares Aggregate Bond ETF (AGG) rallied 78% of the time over the subsequent six months.
The sole instance of a significant loss was in 2021. Notably, this coincided with an inflationary surge, as CPI stood at 5.3% and advanced to a peak of 9.1% within the subsequent 10 months.
Junk bonds
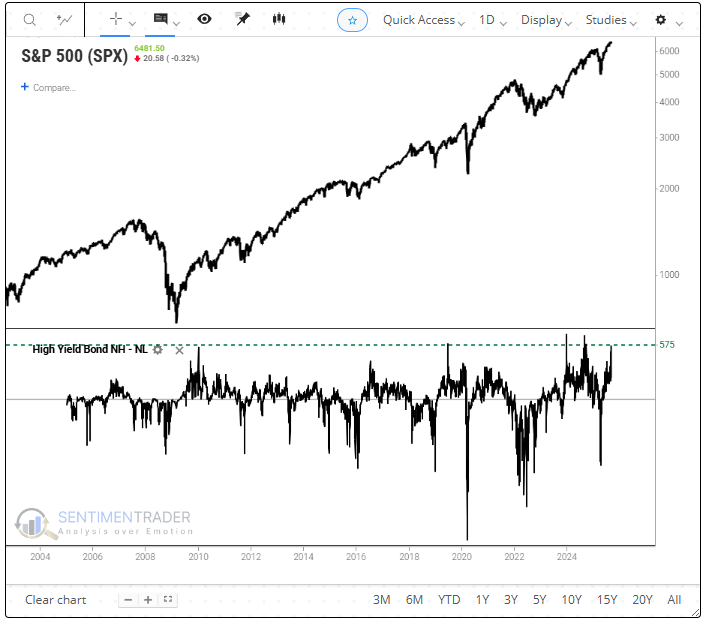
On Friday, the spread between 52-week highs and lows for high-yield bonds surged to its 4th-highest level on record. While employment trends remain a concern, junk bond traders show little sign of worry. Historically, the S&P 500 has never peaked when this spread was as elevated as it is now. Furthermore, the IBOX High-Yield Index closed at a record high to end the week.
In nearly every instance, the S&P 500 rallied over the subsequent five, six, and twelve months when bonds outperformed cash. The sole exception was 2011, when the European debt crisis triggered a pronounced drawdown.
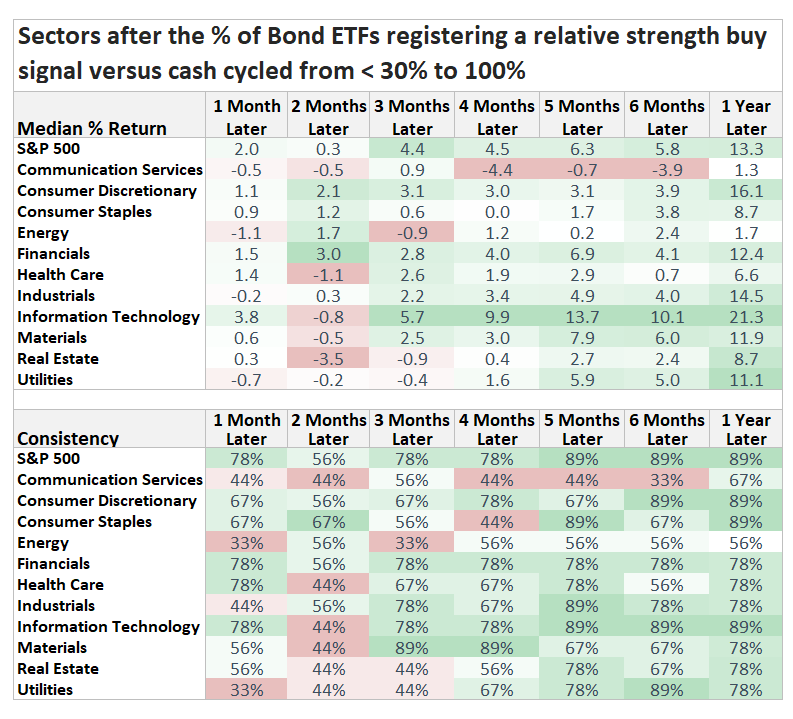
The consumer discretionary and technology sectors were the best-performing sectors over the following year. Both of those groups currently maintain favorable long-term relative trend conditions, aligning with historical tendencies.
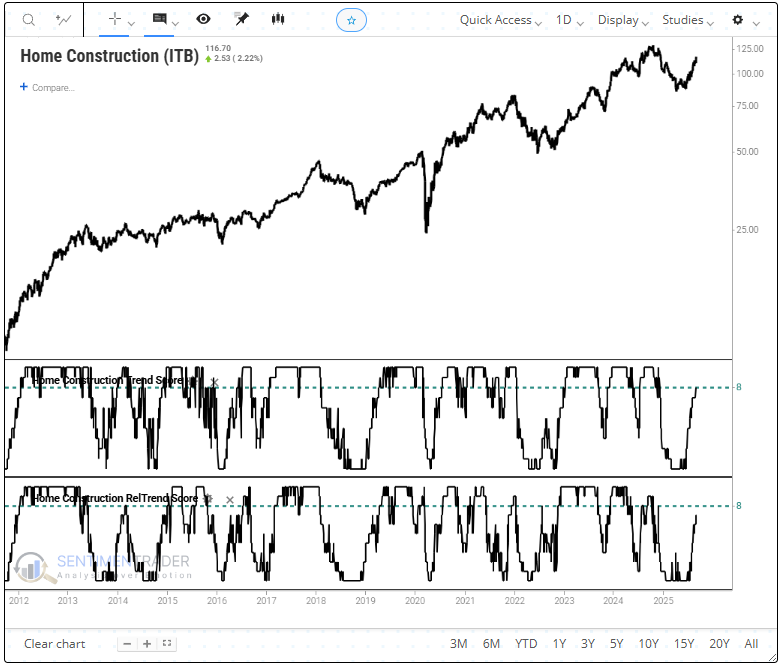
The housing sector tends to benefit meaningfully from lower yields, so it's no surprise that the trend scores for the home construction ETF (ITB) have improved significantly.
What the research tells us...
Our relative strength timing system, which compares bonds to a cash proxy, has now triggered buy signals across 10 major bond ETFs. Historically, similar broad-based improvements in fixed income have been followed by sustained rallies in bond markets, consistent with an environment of falling yields. This constructive backdrop has also tended to spill over into equities, particularly benefiting growth-oriented areas such as Consumer Discretionary and Technology.
Importantly, one of the system's key components-high-yield ("junk") bonds-shows no signs of deterioration. In prior cycles, weakness in this segment often preceded periods of economic stress. The absence of such weakness today suggests that, despite a soft labor market, credit markets are not signaling elevated risk. Together, these factors indicate an improving bond environment that is supportive of both fixed income and equity markets.

