Products
SentimenTrader Trading Tools
‍
Backtest Engine
My Trading Toolkit
Correlation Analysis
Seasonality
Market Prediction
Indicators & Data API
‍
Proprietary Indicators & Charts
Market Data API
Strategies & Scanner
‍
50+ Trading Strategies
Smart Stock Scanner
Smart Option Scanner
Research Reports
‍
Research Solutions
Reports Library
Free Resources
Simple Backtest Calculator
Simple Seasonality Calculator
The Kelly Criterion Calculator
Sentiment Geo Map
Public Research Reports
Education
Sentiment Indicators
Technical Indicators
Pricing
Company
About
In the News
Testimonials
Client Success Stories
Contact
Log inLoginSign up
< BACK TO ALL REPORTS

Canada triggers an optimism index sell signal

Dean Christians
2022-06-15
The Optimism Index reversed from an optimistic level relative to its recent range, triggering a sell signal for the Canadian ETF (EWC). After similar signals, the ETF has fallen 69% of the time.

Key points:

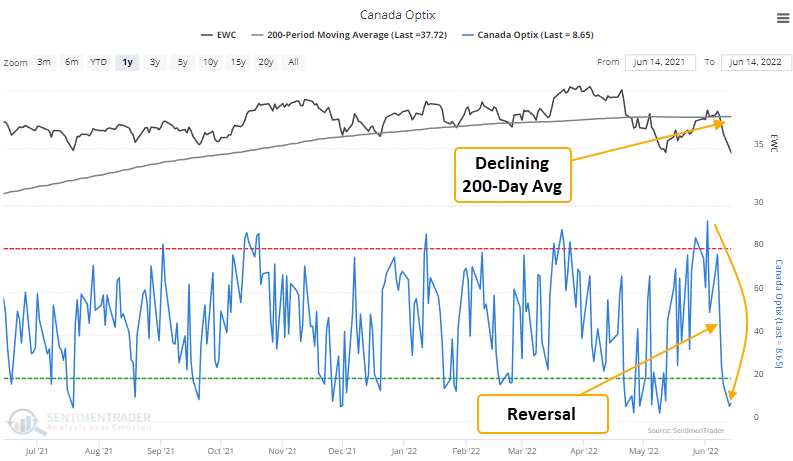
  • The optimism index for the Canadian ETF (EWC) reversed lower relative to its recent range
  • The long-term trend for the ETF shows a declining 200-day moving average 
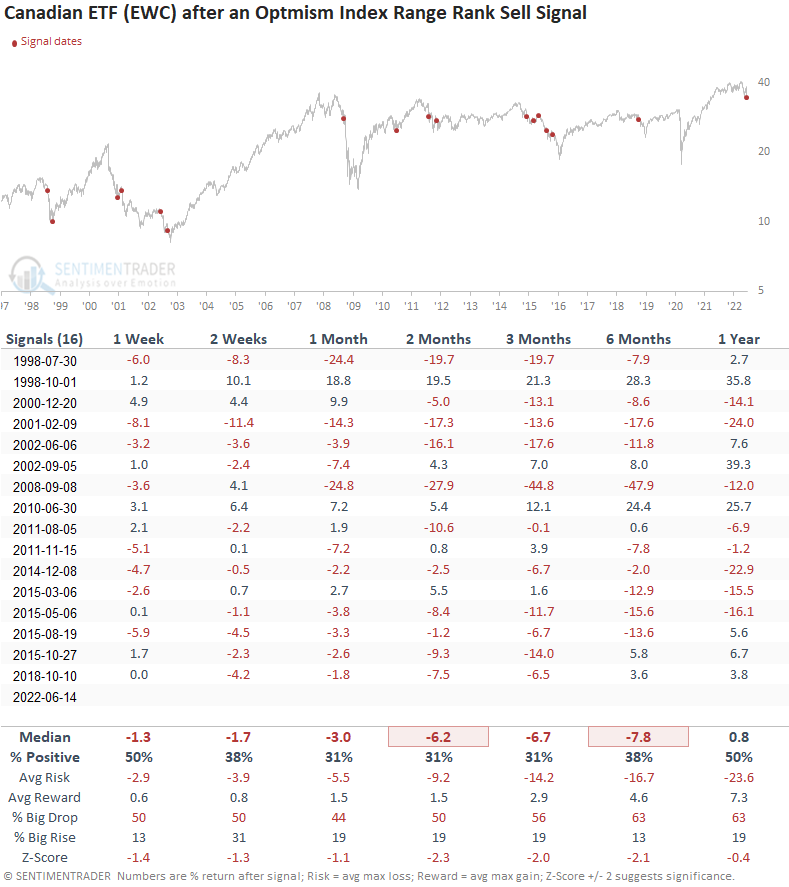
  • Canada has fallen 69% of the time over the next 2 months after other signals

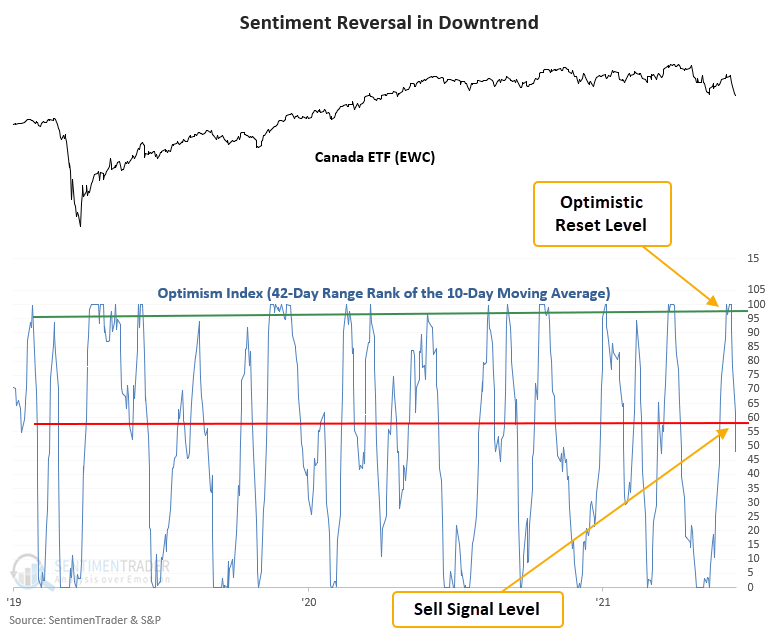
Using the optimism index to identify bearish sentiment reversals in downtrends

A trading model that uses the Optix Index to identify when sentiment reverses from a period of optimism issued a sell signal for the Canadian ETF (EWC) at the close of trading on 6/14/22. 

Sentiment signals work best when they reverse from an extreme

The model applies a 42-day range rank to the 10-day moving average of the Optimism Index for the Canadian ETF (EWC). As a reminder, the range rank indicator measures the current value relative to all other values over a lookback period. 100 is the highest, and 0 is the lowest. An optimistic reset condition occurs when the range rank for the Optix Index crosses above the 99th percentile. A new sell signal triggers when the range rank crosses below the 58th percentile. Within five days of the cross, the 5-day rate of change for the EWC ETF must be <= -2.5% and the 200-day moving average must be sloping downward. I use one final condition to avoid signals after a significant decline. Once the 252-day rate of change for the ETF crosses below -31%, an alert cannot occur again until the ETF closes at a new high.

The Canadian ETF (EWC) has fallen 69% of the time after other signals

This model generated a sell signal 16 times over the past 24 years. After the others, the Canadian ETF's future returns, win rates, and risk/reward profiles look unfavorable across all time frames. The signal shows a negative return at some point in the first 2 months in 14 out of 16 instances. 

What the research tells us...

When the optimism index reverses from its recent range within an established downtrend, it signals that traders have become more pessimistic about the future direction of stocks. Using the Optix index to measure that change in sentiment, similar setups to what we're seeing now have preceded falling prices for the EWC ETF across almost all time frames.

Country ETFs like Canada, with a heavy weighting toward natural resources, have outperformed the S&P 500 on a YTD basis by a wide margin. I've shared several notes highlighting buy signals in the energy sector, with the most recent alert coming last week. So, I'm treating the sell signal from Canada as a friendly reminder that eventually, everything succumbs to the pressure of a bear market. Remember, energy stocks peaked 6 months after the S&P 500 in the 2007-08 bear market.

PRODUCTS
SentimenTrader
Trading Tools
Indicators & Data API
‍
Strategies & Scanner
‍
Research Reports
FREE
RESOUrCES
Simple Backtest
Calculator
Simple Seasonality
Calculator
The Kelly Criterion
Calculator
Sentiment Geo Map
‍
Public Research Reports
‍
Education
Sentiment Indicators
‍
Technical Indicators
‍
Pricing
Bundle pricing
‍
FAQ
‍
Announcements
‍
COMPANY
‍
About
‍
In the News
‍
Testimonials
‍
Client Success Stories
CONTACT
‍
General Inquiries
‍
Media Inquiries
‍
Financial Professionals Inquiries
‍
© 2026 Sundial Capital Research Inc. All rights reserved.
Setsail Marketing
TermsPrivacyAffiliate Program
Risk Disclosure: The information and tools provided are for research and analytical purposes only and are not intended as investment advice. Market analysis involves uncertainty, and outcomes may differ from expectations. Users should conduct their own due diligence and consider their individual circumstances before making any financial decisions. Past performance is not necessarily indicative of future results.

Hypothetical Performance Disclosure: Hypothetical performance results have many inherent limitations, some of which are described below. No representation is being made that any account will or is likely to achieve profits or losses similar to those shown; in fact, there are frequently sharp differences between hypothetical performance results and the actual results subsequently achieved by any particular trading program. One of the limitations of hypothetical performance results is that they are generally prepared with the benefit of hindsight. In addition, hypothetical trading does not involve financial risk, and no hypothetical trading record can completely account for the impact of financial risk of actual trading. for example, the ability to withstand losses or to adhere to a particular trading program in spite of trading losses are material points which can also adversely affect actual trading results. There are numerous other factors related to the markets in general or to the implementation of any specific trading program which cannot be fully accounted for in the preparation of hypothetical performance results and all which can adversely affect trading results.

Testimonial Disclosure: Testimonials appearing on this website may not be representative of other clients or customers and is not a guarantee of future performance or success.