
Can the financials sector flip the script?

Key points:
- Looking for a contrarian idea? The Financials sector could be due for a reversion to the mean relative to the broader stock market
- The percentage of financial sector stocks that are outperforming the broader market recently flashed an oversold signal
- Likewise, our Corporate Insider Velocity indicator recently flashed a subtle "under the radar" signal that could prove bullish in the months ahead
- Buying into a lagging sector while it continues to lag can be an exercise in frustration. Nonetheless, the bottom line is that now may be an opportune time to revisit - and prepare to act regarding - the down-and-out Financials sector
Financials have badly lagged the overall market
The Financials sector has been a relative "dog" relative to the overall market for some time now. The chart below shows the performance of the State Street Financials Select Sector SPDR ETF (XLF) relative to the State Street SPDR S&P 500 ETF Trust (SPY).
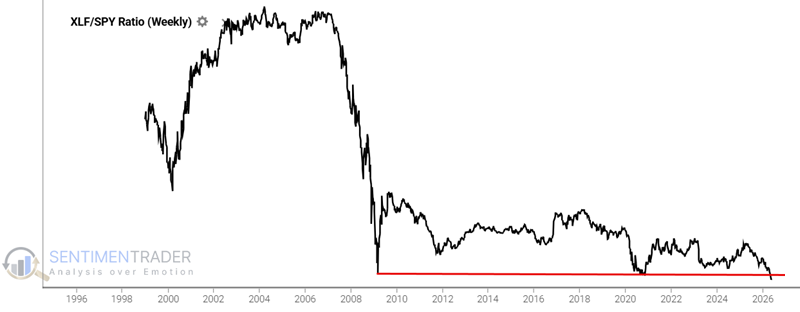
As you can see, the relative performance of financials has just plunged to a new low. Does this mean that this relationship is "due" to revert to the mean anytime soon? Not necessarily. But for those who are willing to speculate, it does offer an intriguing opportunity.
A possible sign of an internal reversal is taking place "below the surface"
The indicator we will look at now is titled the Financials - % of Stocks with a 42-Day RSRR >= 80% indicator. Yes, it's a mouthful. But here's what it actually does:
This indicator shows the percentage of stocks in the Financials index whose 42-day Relative Strength Ratio (RSR) Rank is currently at or above 80%. The RSR measures a stock's performance relative to the S&P 500, and the Rank shows where the current RSR value sits within its own historical range over the lookback period. The chart below shows the raw daily data.
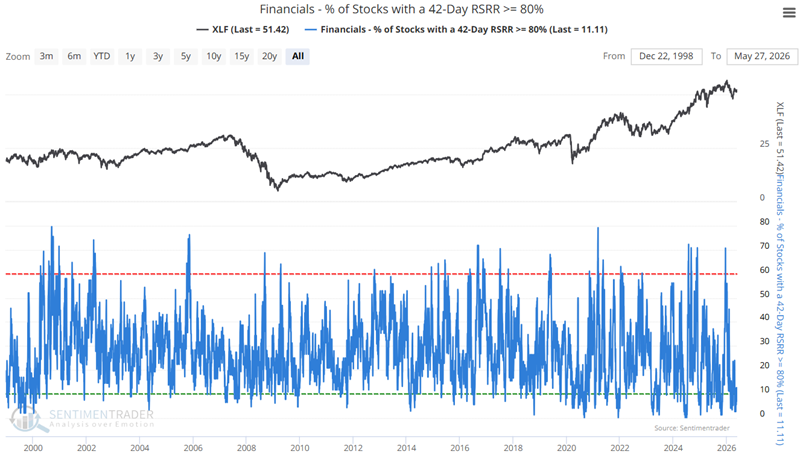
As you can see, the data fluctuates widely from high to low and back. No surprise, the number has mostly been on the low end of the range of late. But is it getting overdone?
The chart below highlights all dates - including overlaps - when the 100-day average was below 16.5. The most recent signal occurred on May 27th.
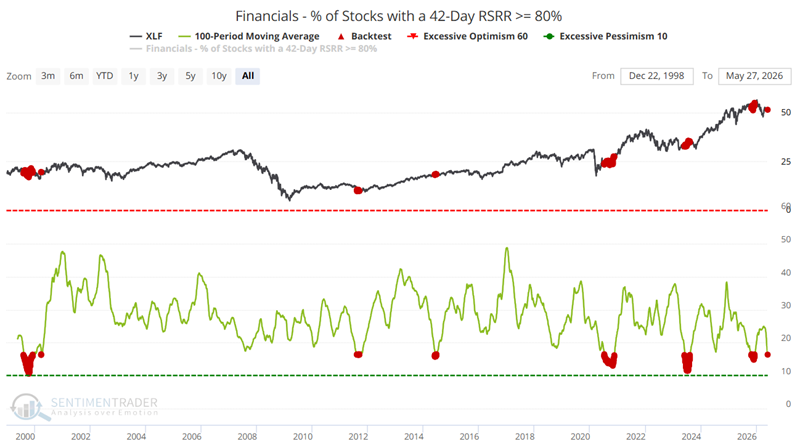
The table below summarizes XLF performance following all dates highlighted in the chart above.

The obvious thing that pops out from the table above is the 1 Year results. A 100% win rate and a near 25% median return are compelling. Of course, nothing is ever guaranteed. Note that the flurry of signals that occurred in November and December of 2025 is presently underwater. Will XLF rally in the months ahead to flip things to positive? Well, that is the $64,000 question, isn't it?
To narrow down results a bit, the test below looks only at those occasions when the 100-day average for the indicator crossed below 16.5 for the first time in four months. This modification removes many of the overlapping signals from the previous test and creates more of a trading system approach.
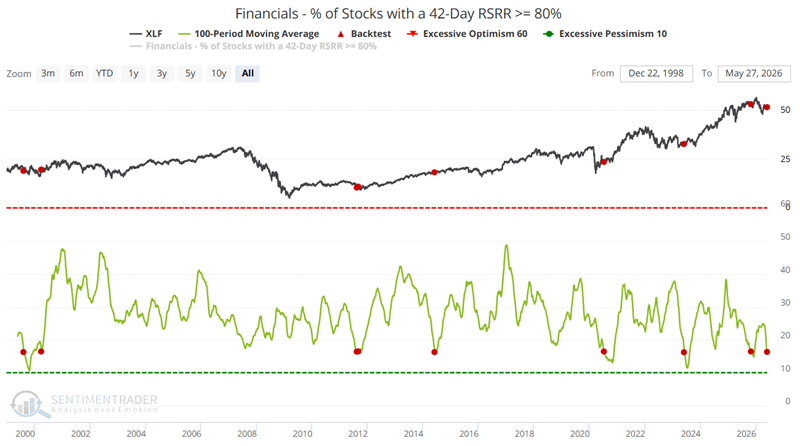
The table below summarizes subsequent XLF performance following the signals highlighted in the chart above. The 1 Year results remain compelling.

The table below shows XLE performance on a signal-by-signal basis during the first year after each signal highlighted above.
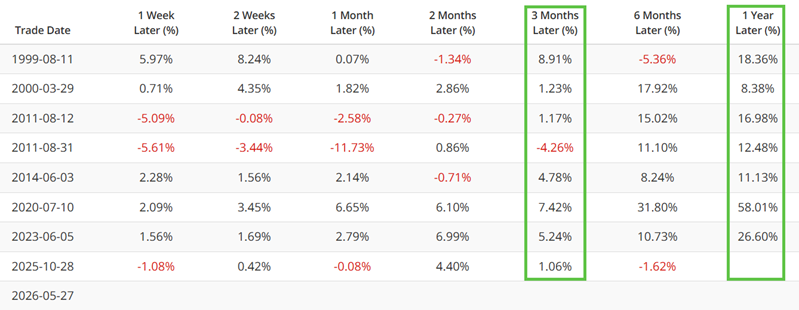
Given the oversold nature of XLF performance relative to SPY, the data above adds weight to the argument that a reversal of fortune for financial stocks could be in the offing.
Corporate Insider Velocity may be offering another clue
Our corporate insider velocity indicator considers the rate of change in corporate insider buying and selling in a given sector and can flash clues that are not always apparent in raw buying and selling data. To wit, the chart below highlights all weeks when the 50-week average of our Corporate Insider Velocity - XLF indicator crossed above 8.2 for the first time in four months. The most recent signal occurred back on March 30th. The good news is that this signal occurred just one trading day after the most recent low for XLF on March 27th. The bad news is that the advance in XLF has amounted to only 6.3% (versus over 18% for SPY).
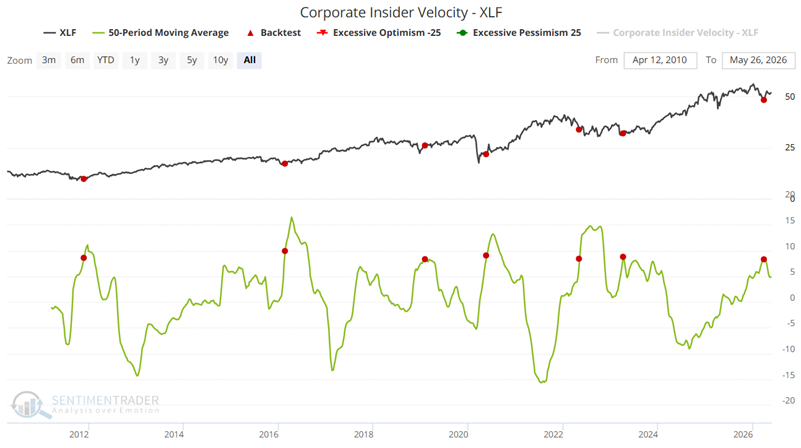
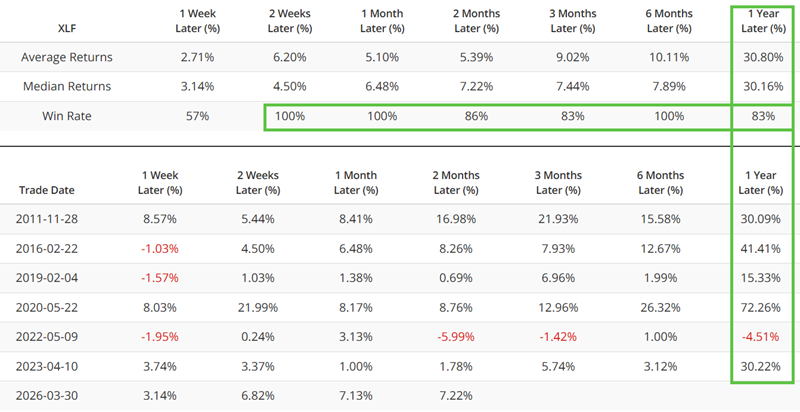
Still, the recent signals bode well for XLF in the months ahead if it follows the historical pattern of previous signals, as shown in the table below. Note the tendency for gains to grow significantly between the 2, 3, and 6-month post-signal periods (single-digit median returns) and 1-year (30% median return).
What the research tells us…
I generally prefer a trend-following and/or momentum approach to trading, i.e., buying what is showing strength and "letting it ride" (with a stop-loss in place to prevent catastrophic losses when things go the wrong way). That said, counter-trend trading can be lucrative if implemented properly. Betting on the financial sector right now is absolutely a counter-trend approach. As we have seen, this sector has been badly lagging the overall market. Could a turning point in that trend be in the offing? The evidence presented above argues in the affirmative. Aggressive traders might consider buying shares of XLF, or call options on XLF, to try to profit if the financial sector begins to assert itself in the months ahead.