
Can the Bull Market Last for Another Year?

NOTE: I am away this week, but have chosen to recycle a few timely notes from the archive. Please note that the piece below is the original article from December 2023, originally titled "Could the bull market run another three years?"
Note also that since the end of 2023, the S&P 500 index has gained 43% and the Nasdaq 100 index has gained 65%.
Key points
- In a series of articles in April 2023 (see here, here, and here), we introduced the Benner Cycle, purportedly created by a man named Samuel Benner in 1875, which consists of major cycles and minor cycles
- In the past 100 years, overall market performance has been uniformly positive during favorable periods for the minor Benner cycle
- A new favorable minor Benner cycle begins on January 1st and extends through December 2026
The "Benner Cycle" chart
The chart below was purportedly created by Samuel Benner in 1875.
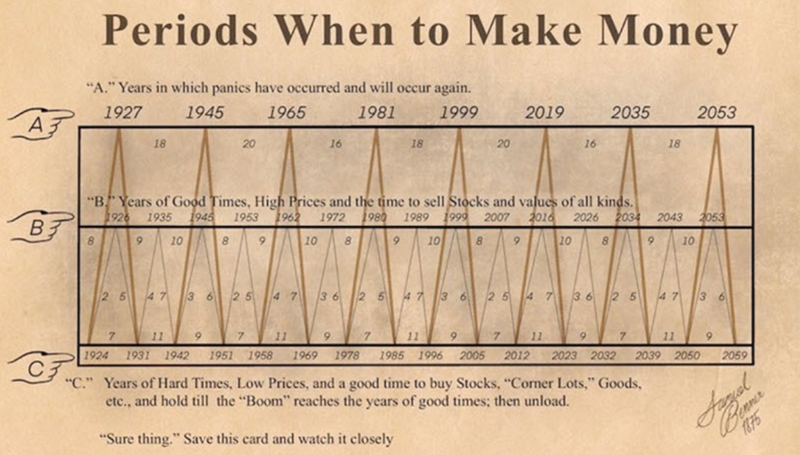
The brownish/yellow lines in the chart above highlight "major" cycles, and the light gray line highlights "minor" cycles. At the close of trading for 2023, the major cycle will turn "neutral" until the end of 2032. On the other hand, the minor cycle will turn "favorable" until the end of 2026.
What might this mean for stock investors? Let's take a closer look.
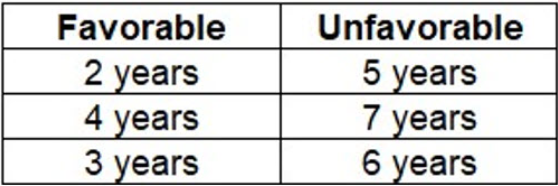
The minor Benner cycle pattern
The "minor" cycle in the chart above (the light gray line) starts by rising from 1924 to 1926 (favorable), then declines from 1926 to 1931. It then rises for four years, declines for seven, and then completes its pattern by increasing for three years before falling for six. From there (1951), the overall pattern repeats, as shown in the table below.
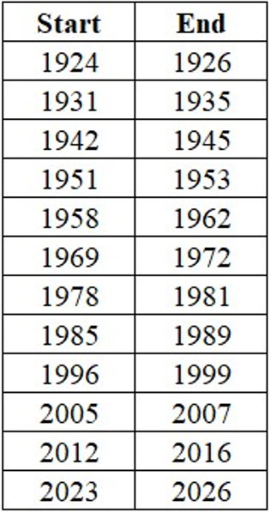
Favorable years within the minor Benner cycle
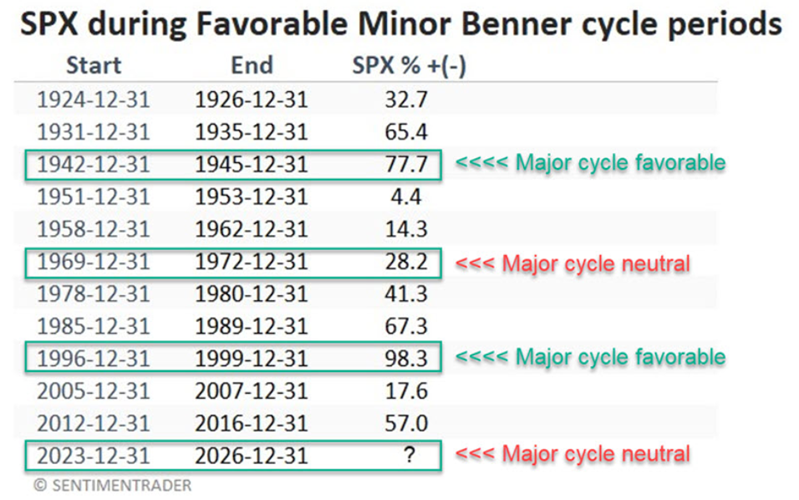
The list below contains all the "favorable" years the minor Benner cycle indicated. Note that for all tests, we initiate a new cycle period at the close of December 31st of the stated year and use monthly S&P 500 Index closing prices to track the results.
The next minor cycle favorable period begins on December 31, 2023, and extends through December 31, 2026.
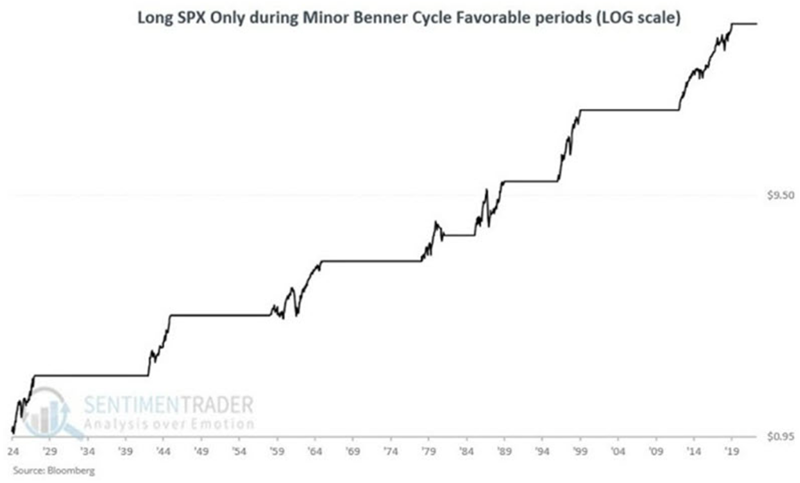
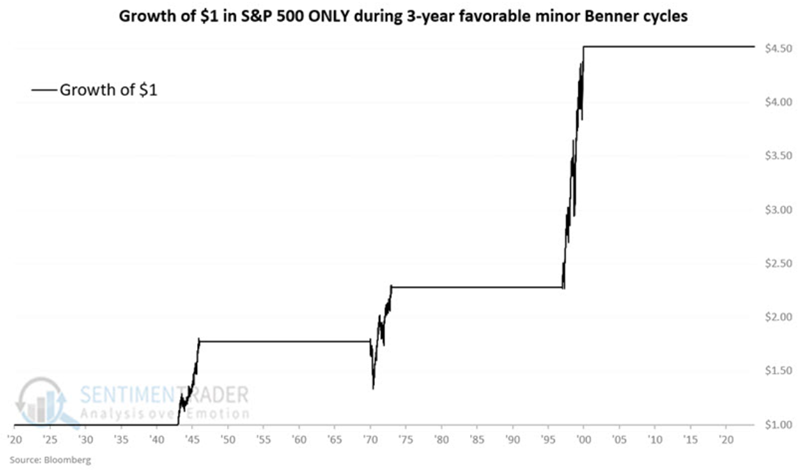
The chart below displays the growth of $1 invested only during the periods listed above (on a logarithmic scale) using monthly data. A hypothetical investment of $1 has grown to $51.33.
NOTE: This chart is updated through late 2023 and does NOT reflect the market advance in 2024 and 2025.
Focusing on minor 3-year cycles
In the earlier Benner cycle graphic, you can note that there have only been three favorable 3-year minor cycles - from 1942 to 1945, 1969 to 1972, and 1996 to 1999. The first and third occurrences happened for the record, while the major Benner cycle was favorable. The only previous instance when the minor cycle was favorable, and the major cycle was neutral, occurred from 1969 to 1972. Even if we include all three, the sample size is still too small to draw conclusions from. Nevertheless, for the sake of historical perspective, we will take a closer look at these three previous 3-year favorable minor cycle periods.
The table below displays the cycle-by-cycle results for all favorable minor cycles, with the three 3-year favorable periods highlighted.
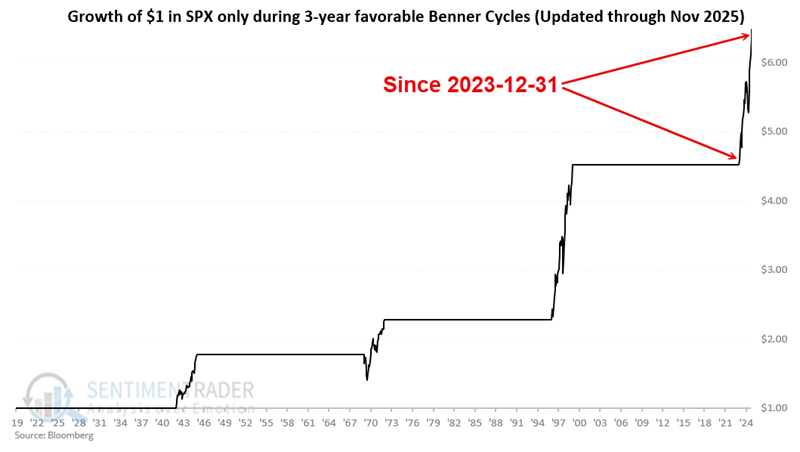
The chart below displays the growth of $1 invested in the S&P 500 Index only during the three previous favorable 3-year minor cycles.
The table below displays:
- The period dates
- The cumulative S&P 500 % performance during the period
- The maximum gain achieved during the period
- The maximum % drawdown from the point of entry (i.e., the largest open loss experienced during this period)
- The maximum % drawdown from any peak within the 3-year period
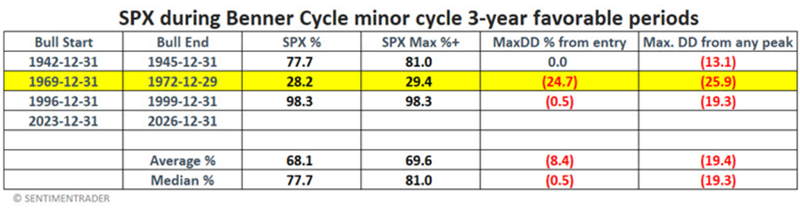
As you can see, the single precedent for the "Major cycle neutral, minor cycle favorable for three years" configuration (highlighted in yellow) witnessed a gain of +28.2% (i.e., less than 10% per annum), and an investor who bought in on 1969-12-31 suffered a -24.7% loss before the market rebounded.
UPDATE NOTE: As this is written, since 2023-12-31:
- The S&P 500 has gained 44%, so another substantial gain would be required in 2026 to get the overall result up to the Average of 68.1% in the previous cycle
- The maximum % drawdown from the entry price on 2023-12-31 is -1.7%
- The maximum % drawdown from any peak so far is -18.9%, which occurred between December 2024 and April 2025
The chart below updates the S&P 500 performance since December 31, 2023, to the chart above.
What the research tells us…
The reality is that there are few, if any, concrete conclusions that can be drawn. On the one hand, to date, all favorable minor Benner cycle periods have experienced gains. This lends weight to the bullish case, arguing that investors continue to give it the benefit of the doubt. On the other hand, while it is not helpful to draw conclusions from a single precedent, the 24.7% drawdown during the only configuration precedent serves as a reminder that volatility and risk are always factors that each individual investor must plan to manage.