
Calendar compression in fear

Key points:
- The VIX "fear gauge" has been calm, with its Bollinger Bands compressing
- It's unusual to see such calm conditions during this time of year
- A compressed VIX in late July or early August has tended to see a pickup in volatility and a drop in stocks
Anxiety is ebbing fast
Volatility is ebbing fast. That seems like a great thing for investors, because it's comfortable. But historically, it's been something akin to a drug-induced high - feels great for a while, then comes the aftermath of all the bad decisions.
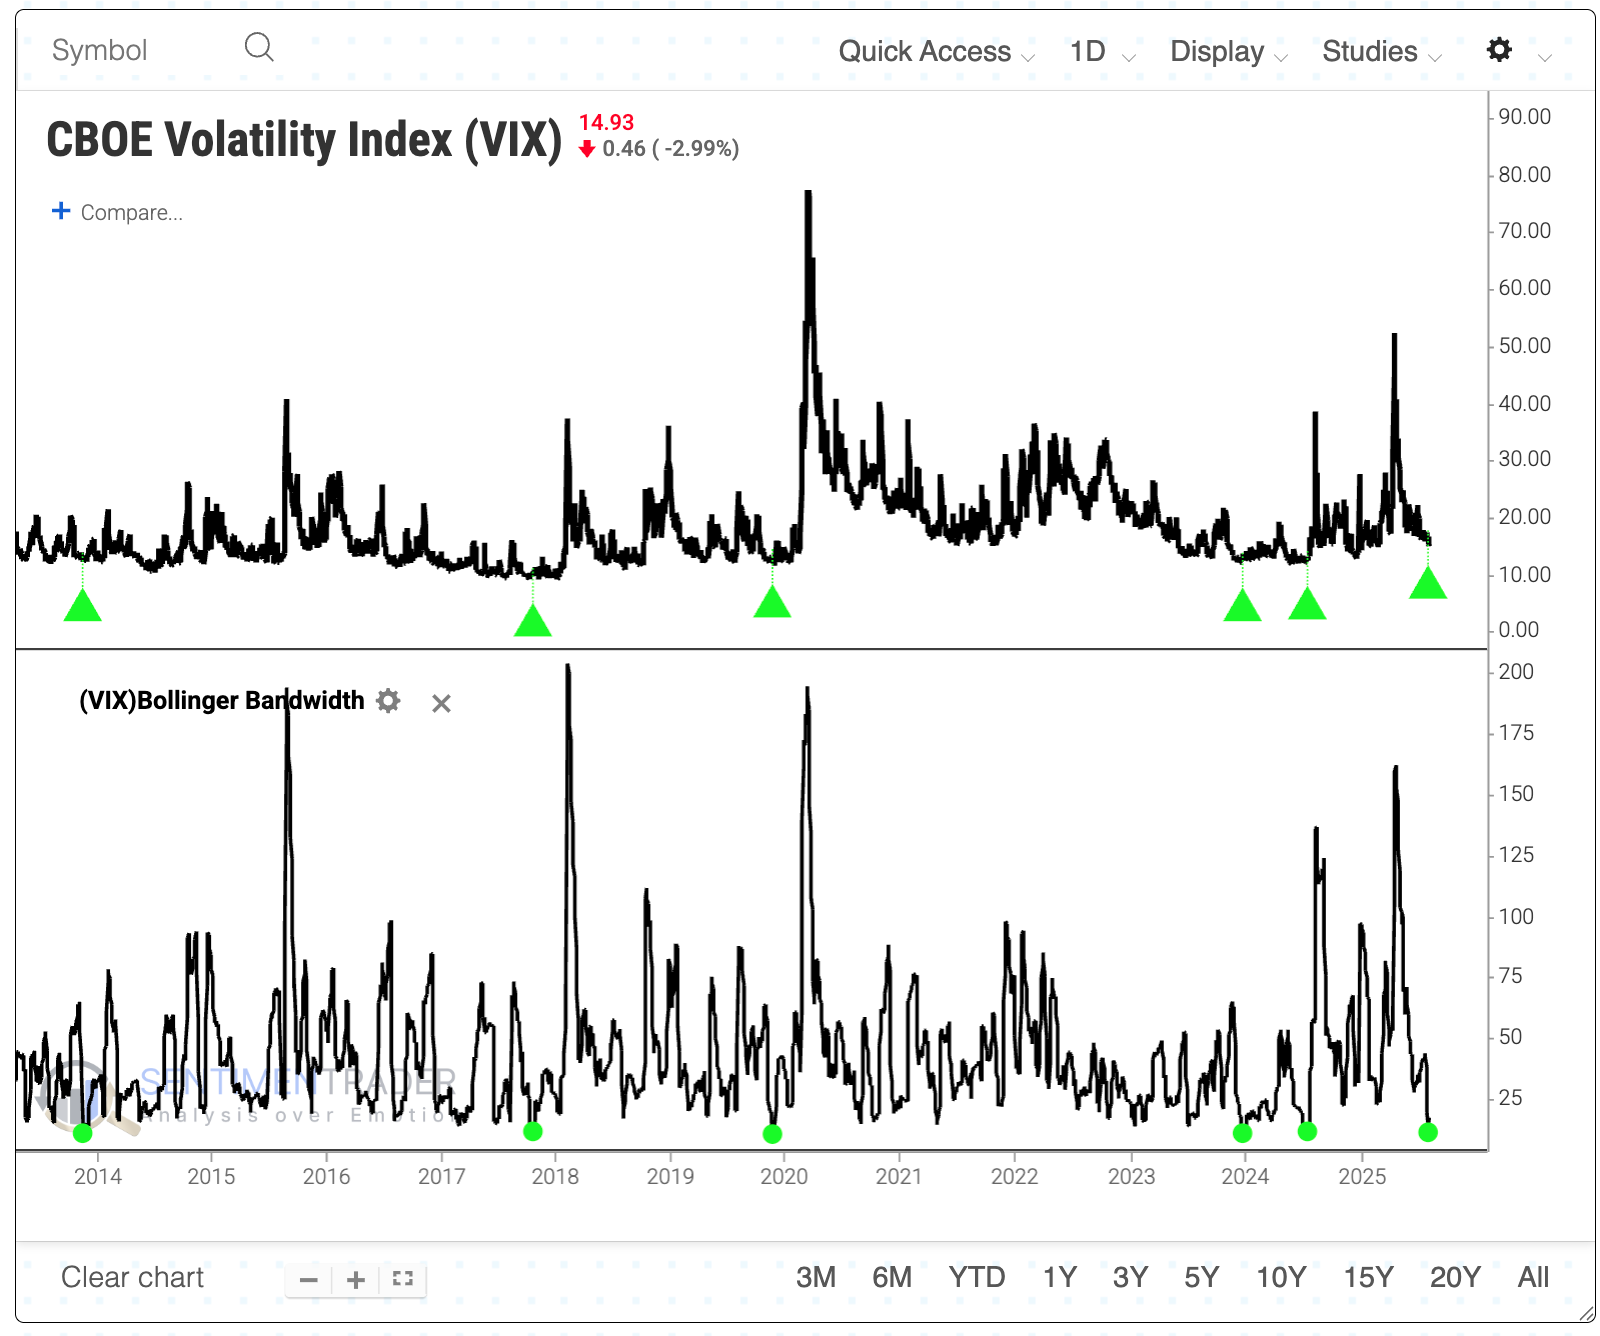
The VIX "fear gauge" is a decent reflection of traders' near-term anxiety. Watching the VIX level can give us a good idea of how much potential movement traders are pricing in; watching how much the VIX moves lets us know just how comfortable traders are with their beliefs.
A good way to visualize this is by measuring the distance between the Bollinger Bands on the VIX. This popular indicator recently dipped to one of its lowest levels in over a decade. Since the end of the global financial crisis in 2008, the VIX's Bbands compressed this tightly only five other times (click here to load this test, then click Run Backtest to see the full results).
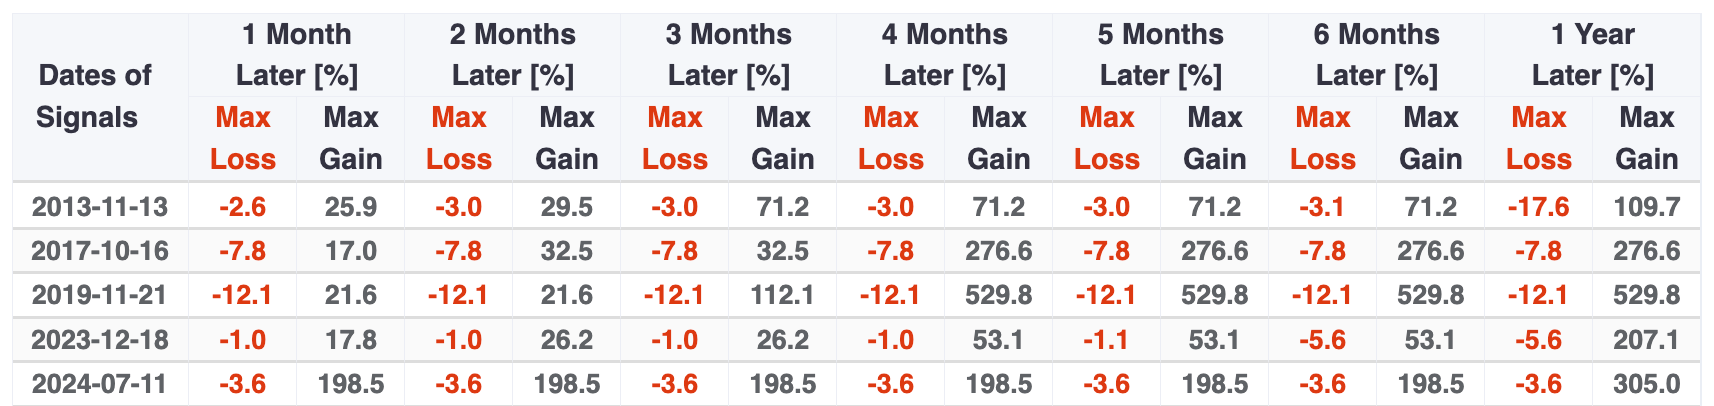
The table of maximum gains and declines in the VIX showed a remarkable skew to the upside. Within the following four months, the VIX jumped by more than 50% every time, while showing no decline larger than 12%. The VIX more than doubled three of the five times.
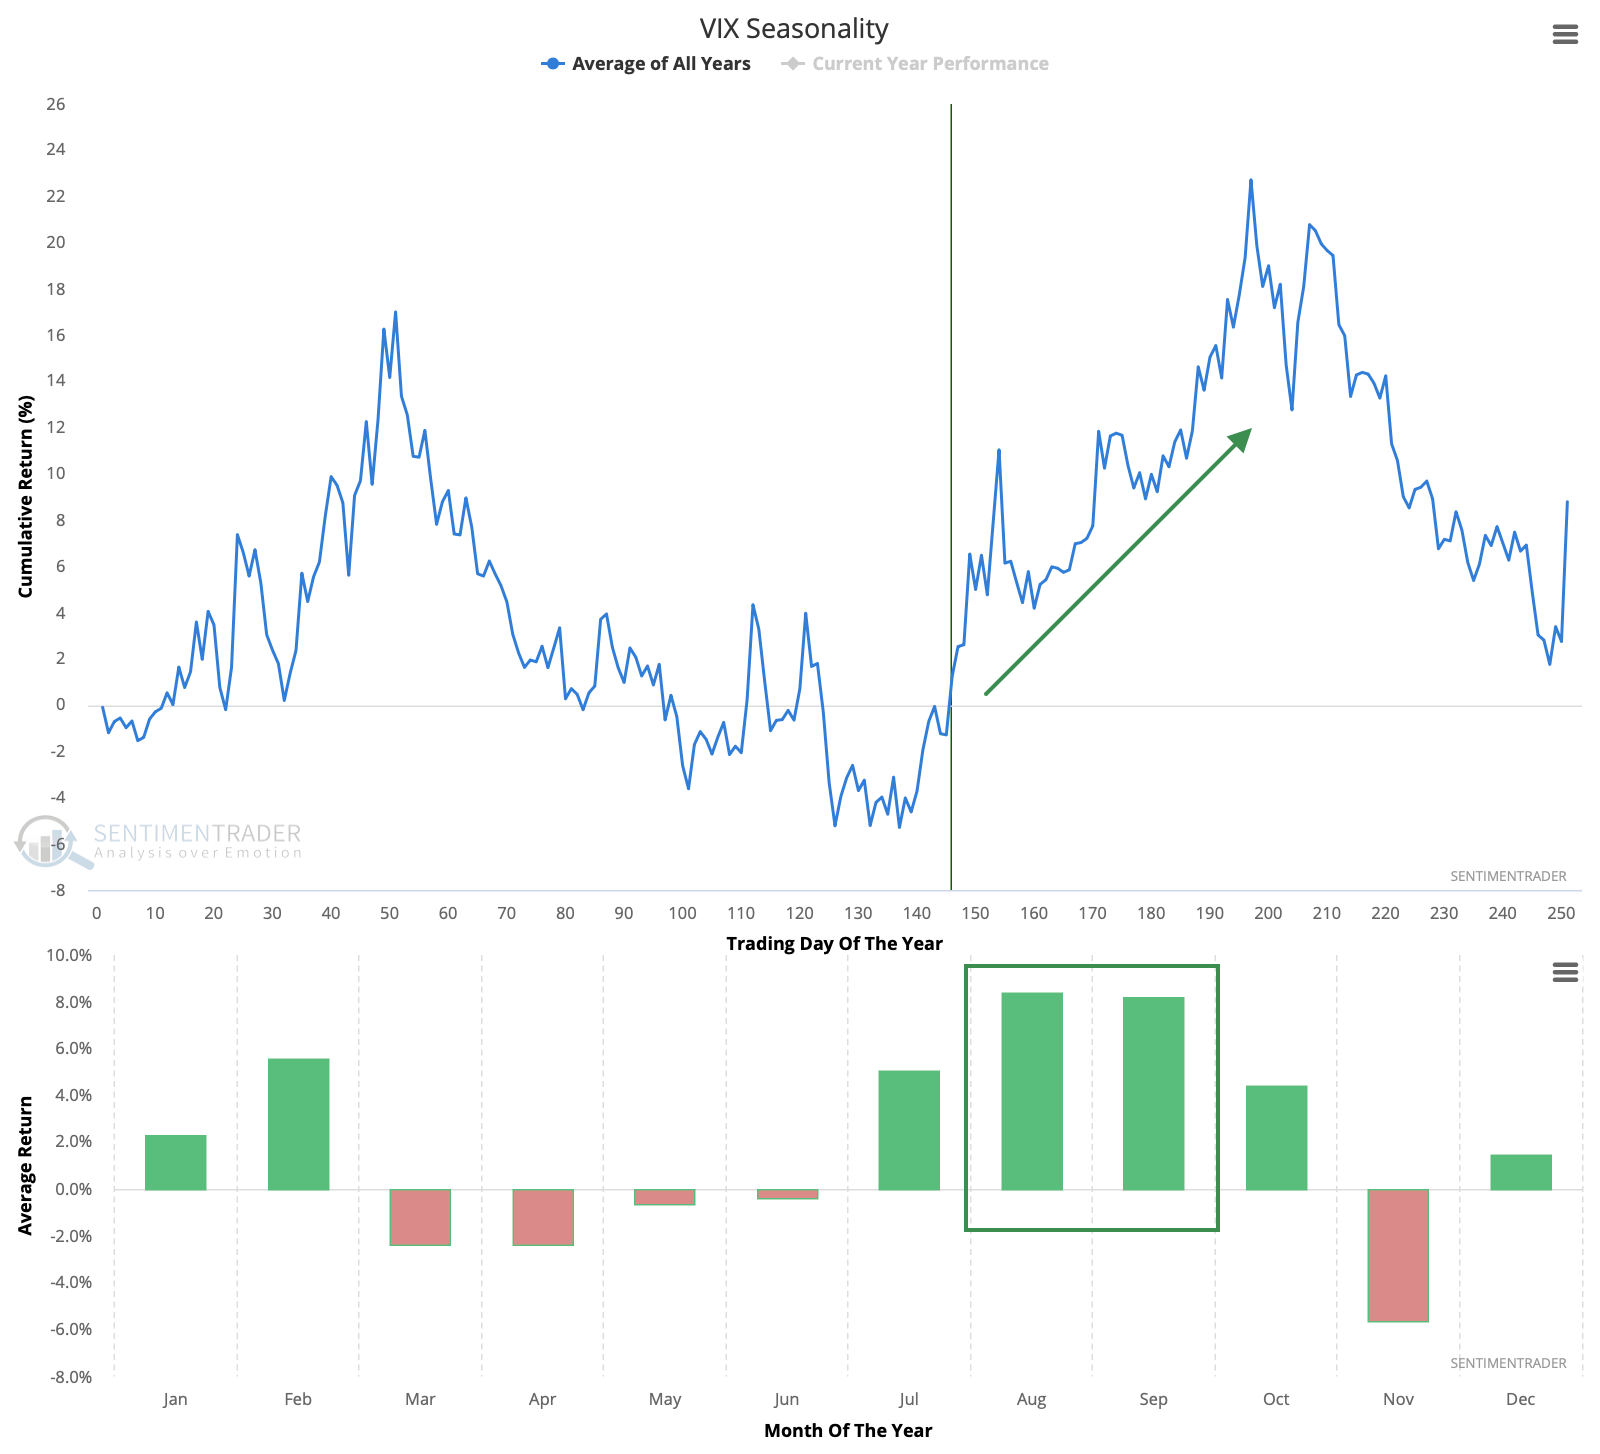
What's especially notable about the current compression is when it is happening. The VIX has had a strong seasonal tendency to rise this time of year.
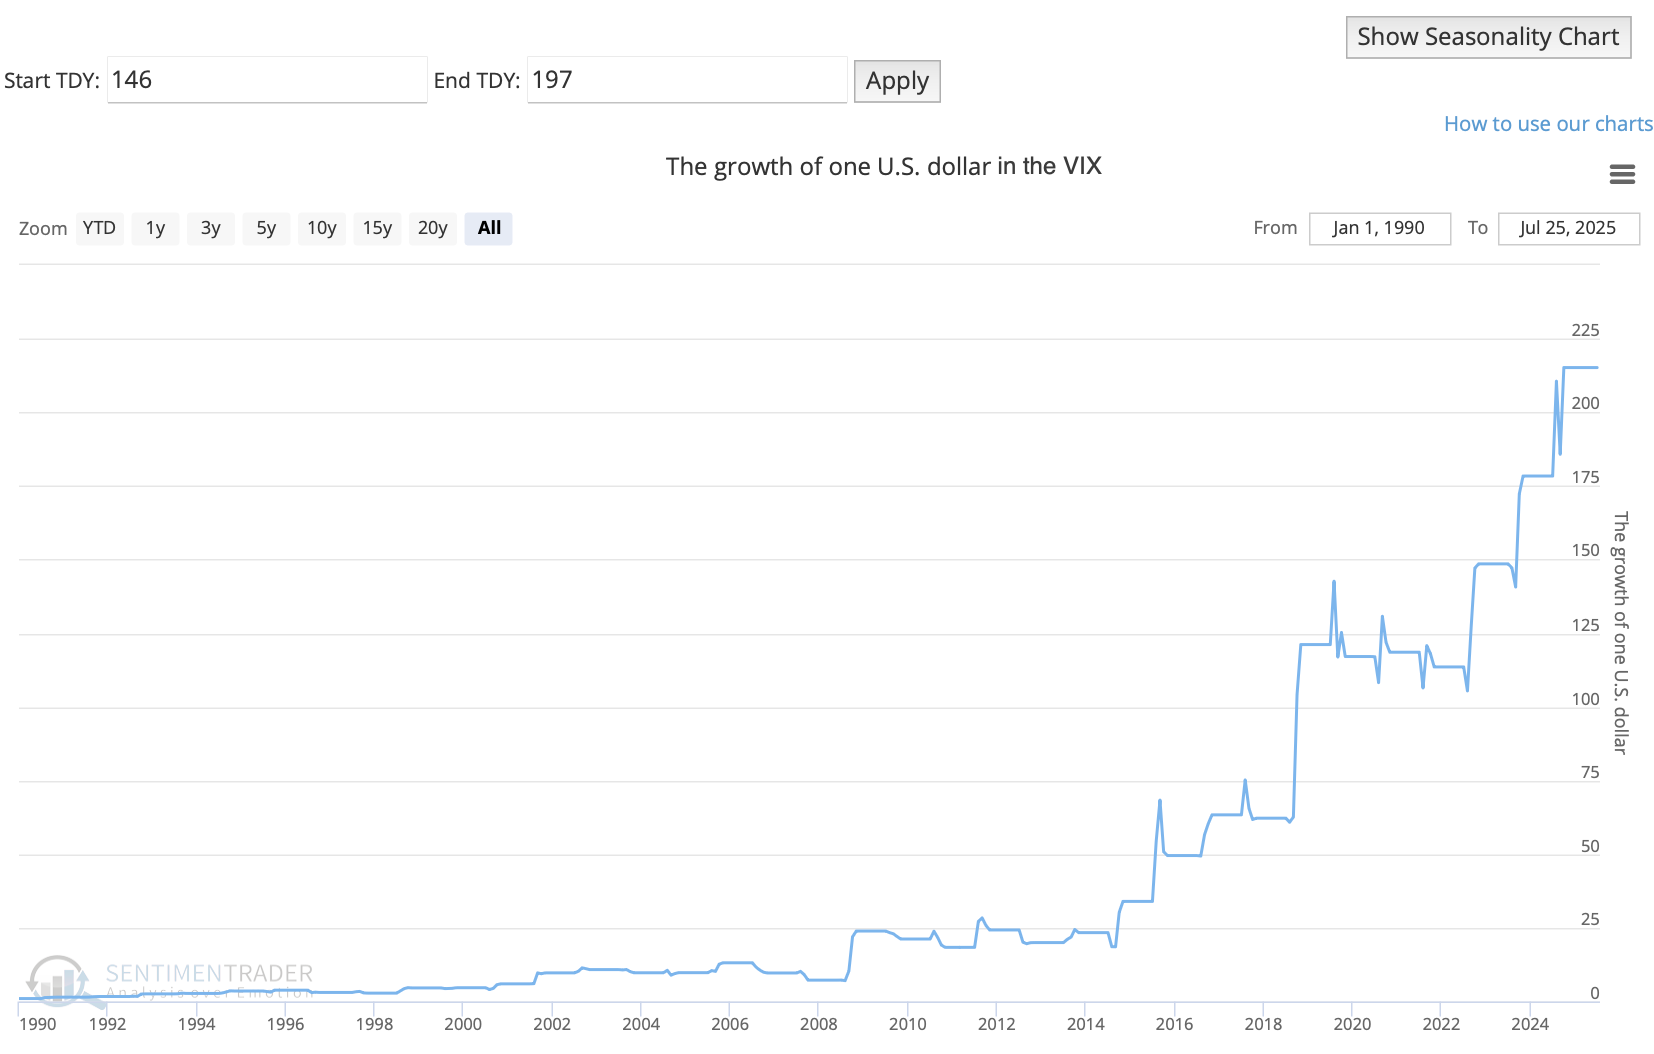
The chart below shows the equity curve of buying the VIX at the current point of the calendar and selling it about 50 days later. This is purely hypothetical because there is no easy way to buy and sell the VIX. The current crop of ETFs is a less-than-perfect substitute and a poor vehicle for nearly everyone.
Combining compression and the calendar
When we combine these two factors, compression and seasonality, we see that the VIX has had a strong tendency to spike quickly.
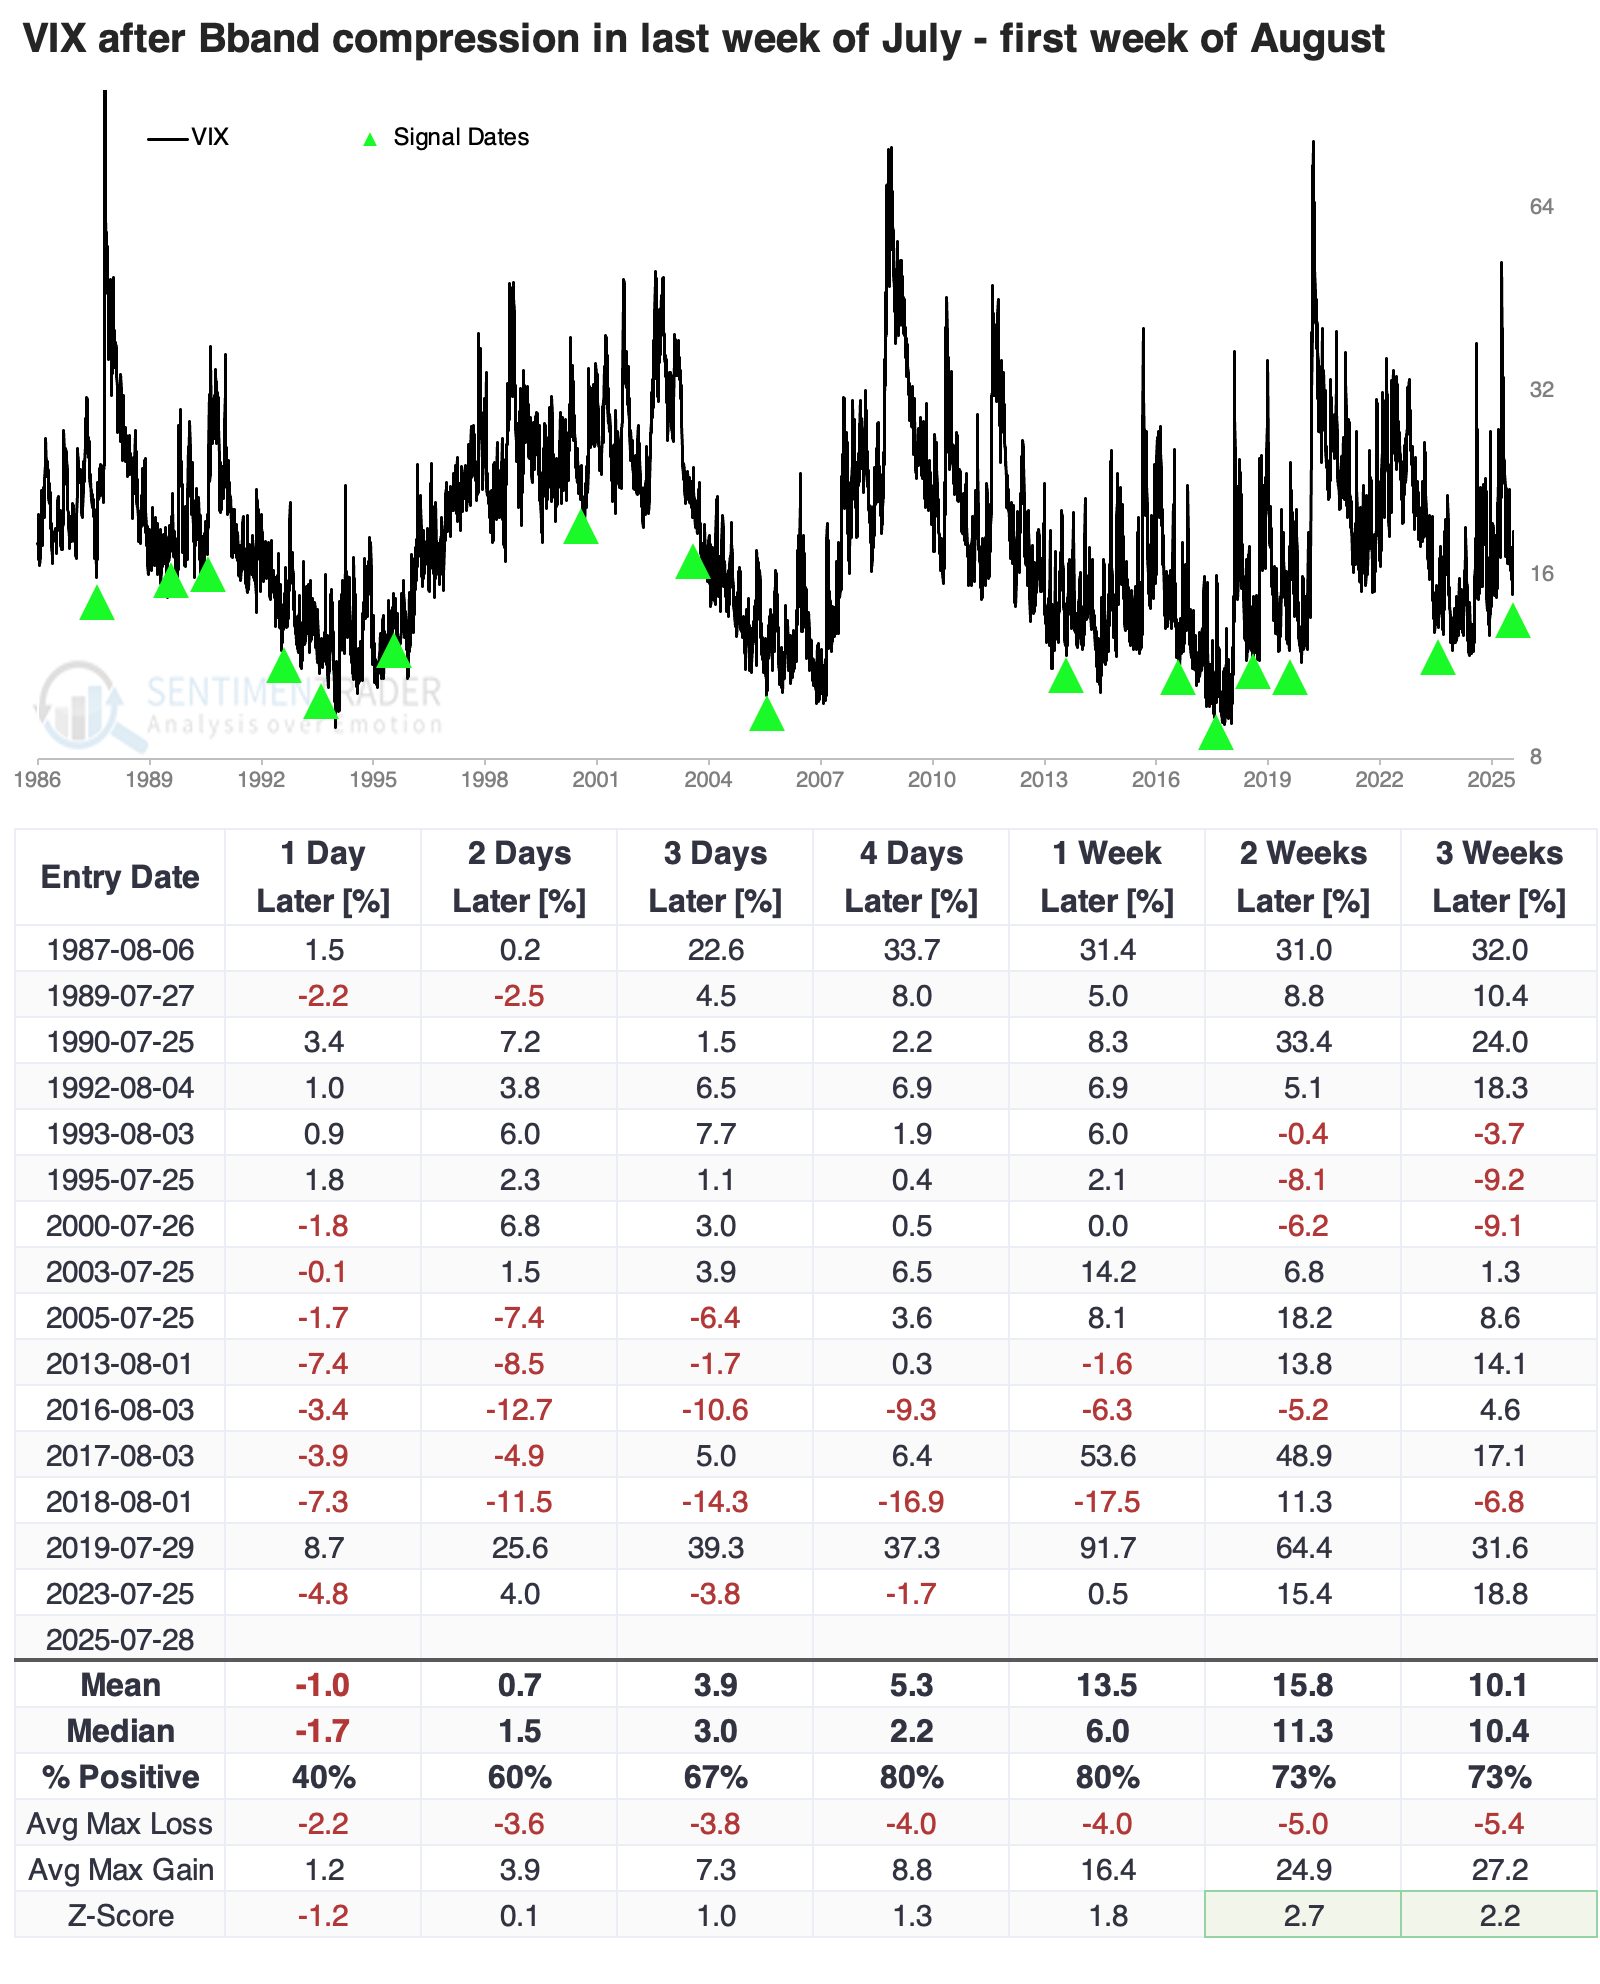
The chart and table below show every time over the past 30 years when the VIX's Bollinger Bands compressed during the last week of July or the first week of August. Over the following week, the gauge rose 80% of the time.
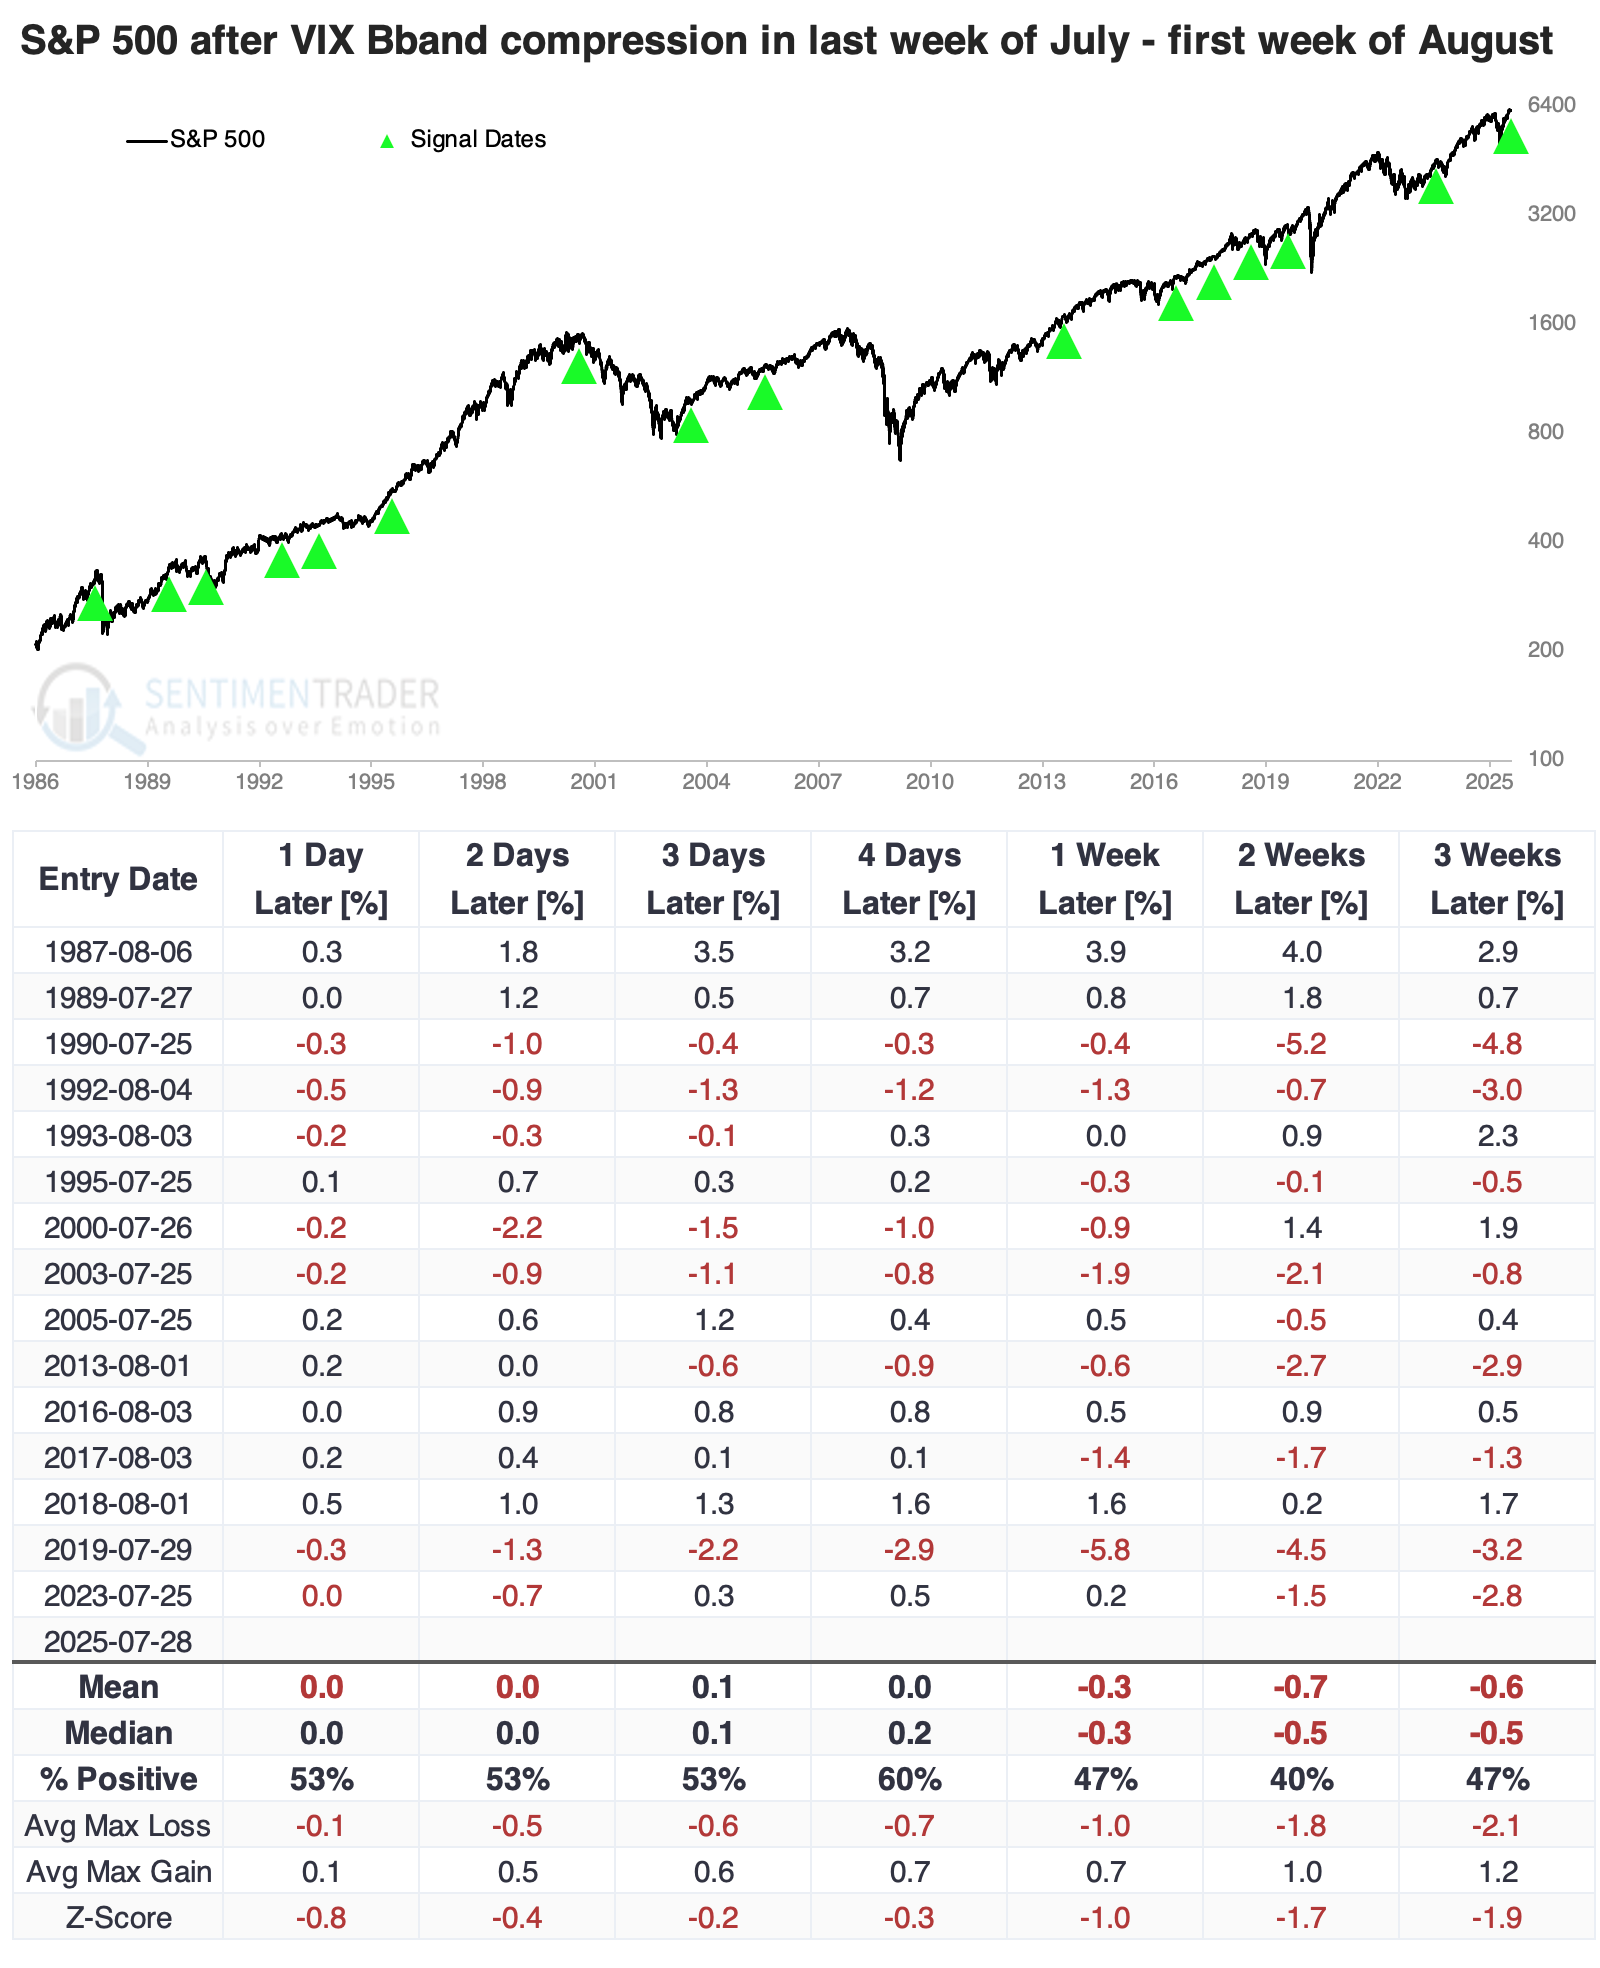
Since the VIX isn't readily tradable, the next-best proxy is the S&P 500. When the VIX rises, it's usually because the S&P fell. Indeed, the S&P tended to decline over the next couple of weeks. The only signals that saw more than a 1% rally both two and three weeks later were August 1987 and July 2000. Gulp.
Looking further ahead
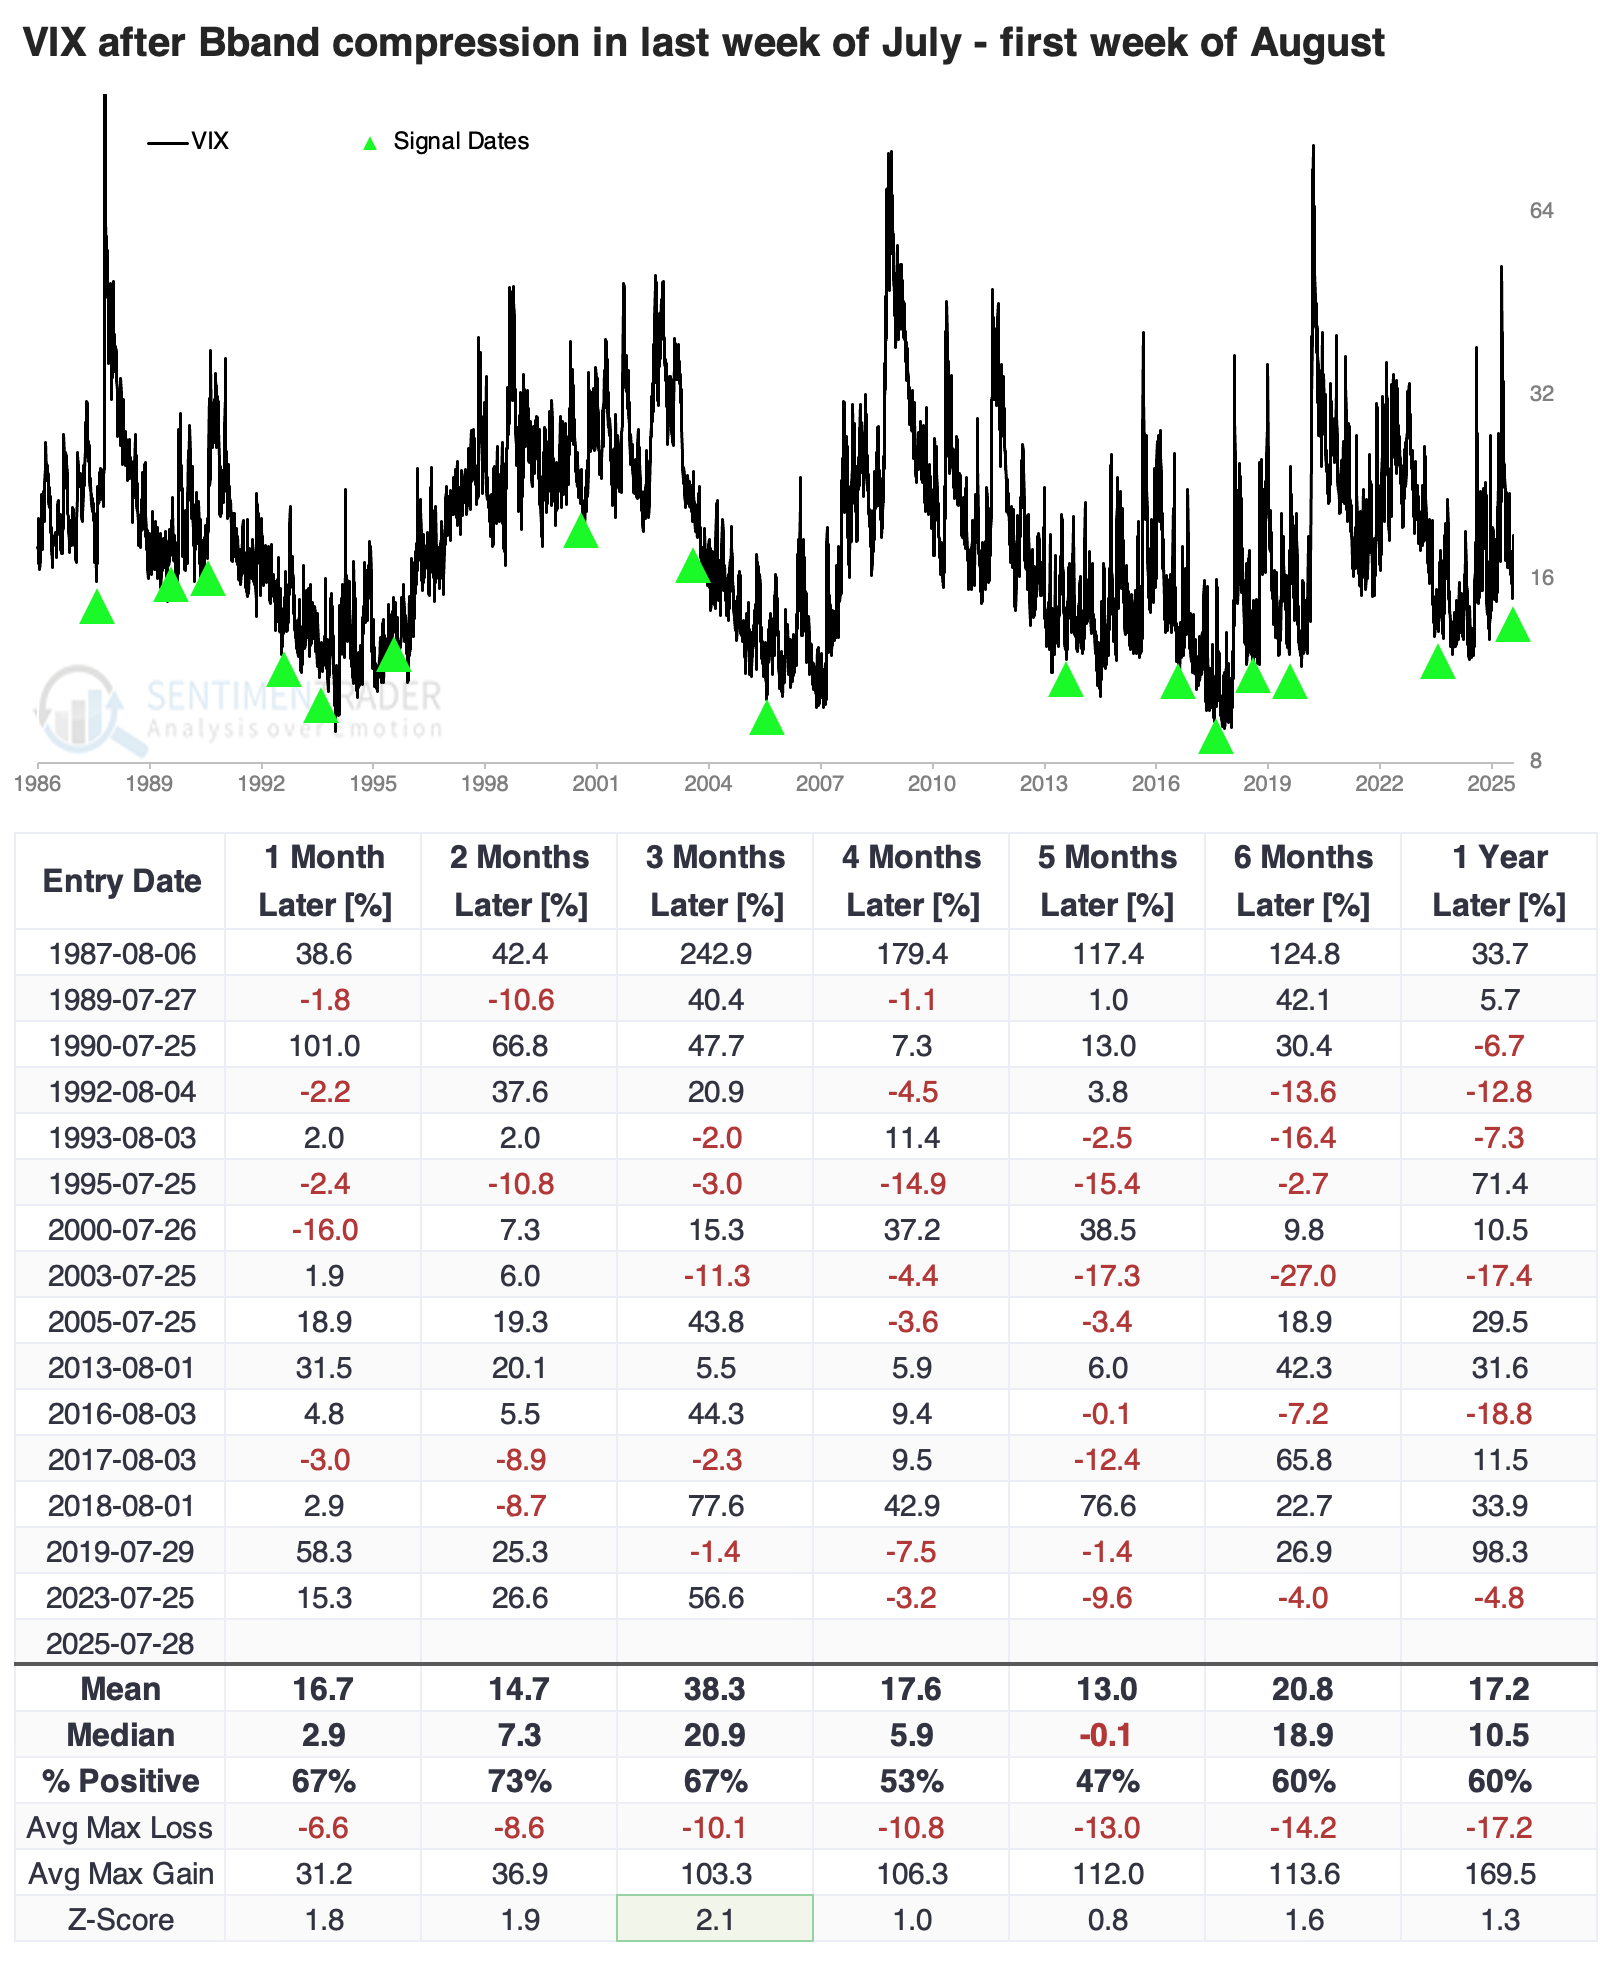
For those with more extended time frames, a seasonally compressed VIX tended to precede a larger-than-average return in the VIX over the following three months, but it was not as consistent as for those with shorter time frames. Volatility spikes do not tend to persist very long.
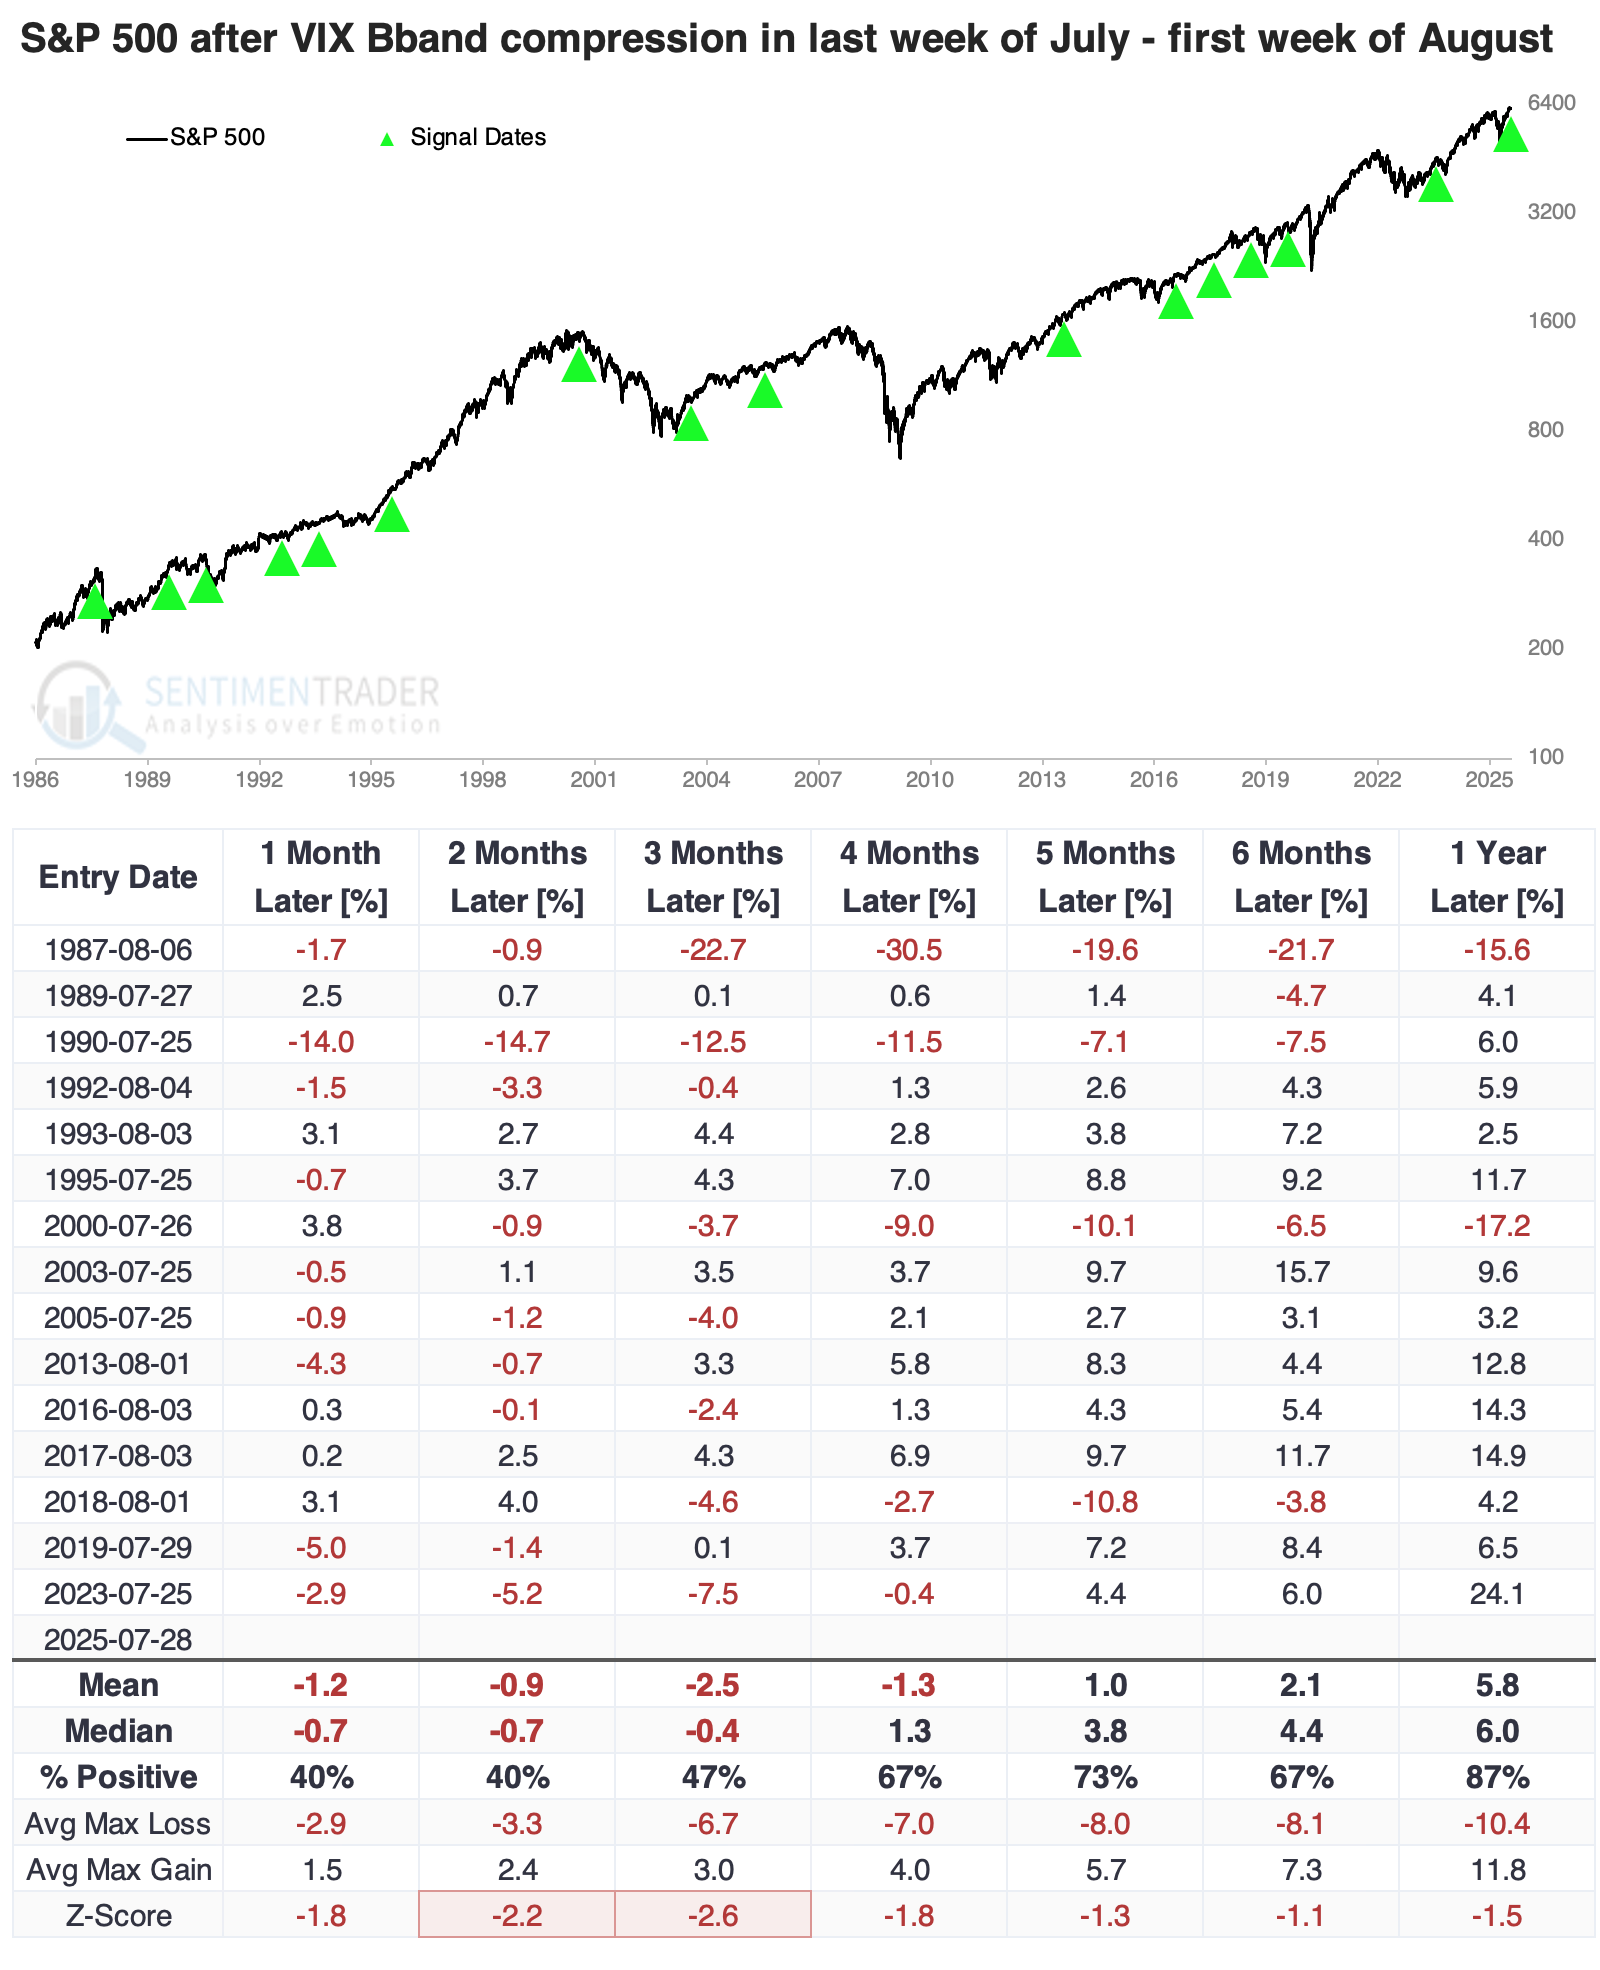
The S&P 500 showed a relatively strong negative bias over the next one to three months. It declined most of the time, showed a poor average return, and an even poorer risk-to-reward ratio. Even up to six months later, average risk outweighed average reward, and the S&P gained more than 10% only twice. Within the following three months, the index lost more than 5% seven times while gaining more than 5% only three times.
Consumer discretionary stocks showed among the worst performances after the VIX became compressed during this time of year. They had among the worst win rates across sectors over short- to medium-term time frames.
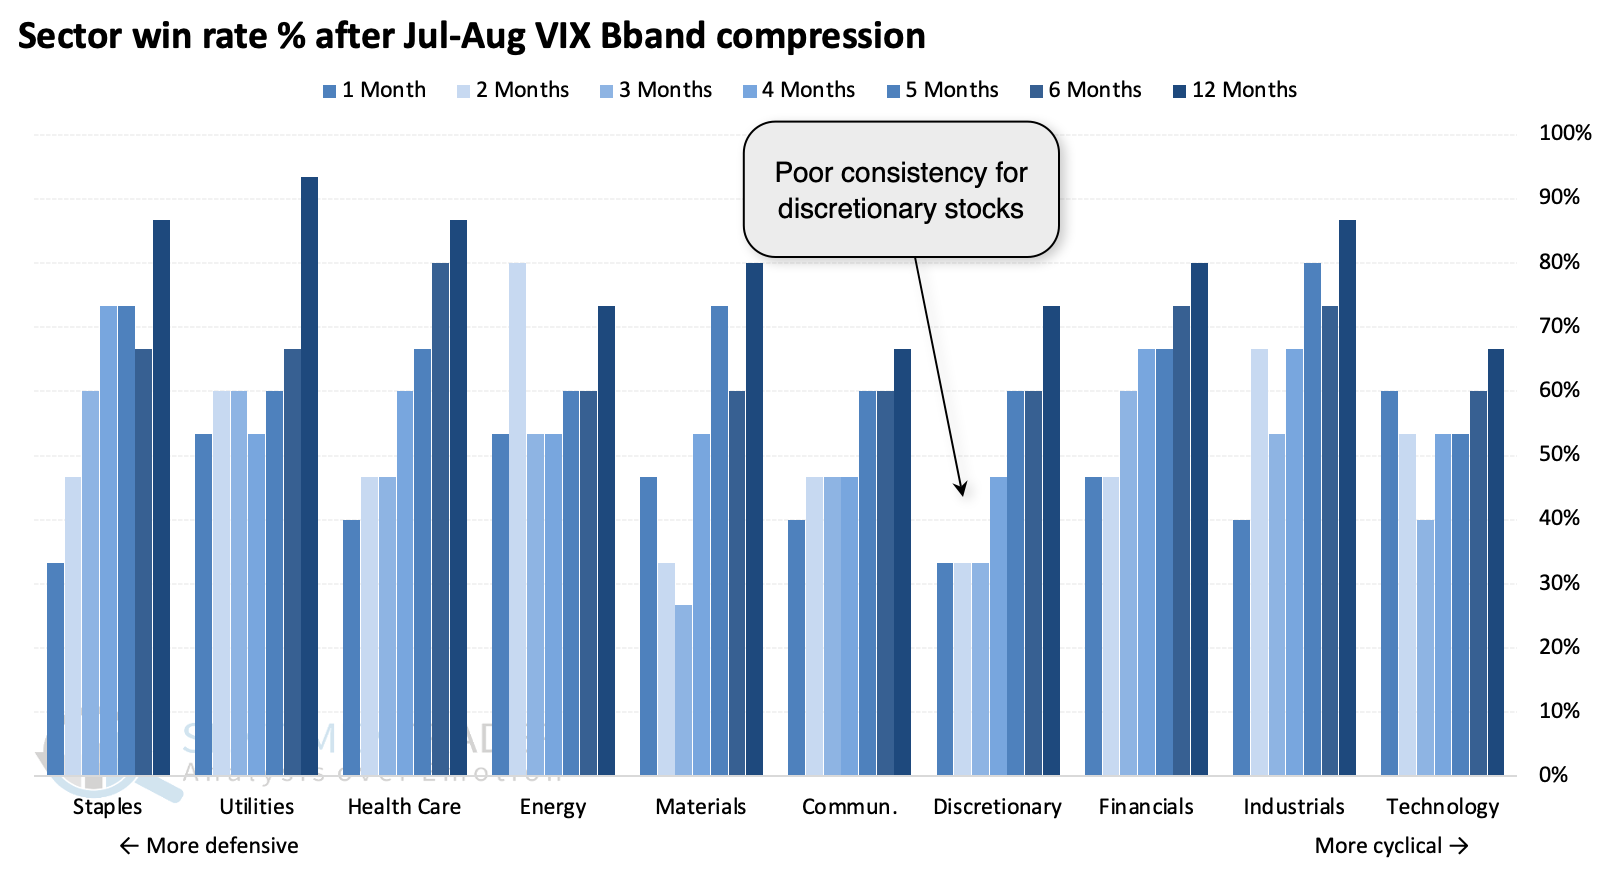
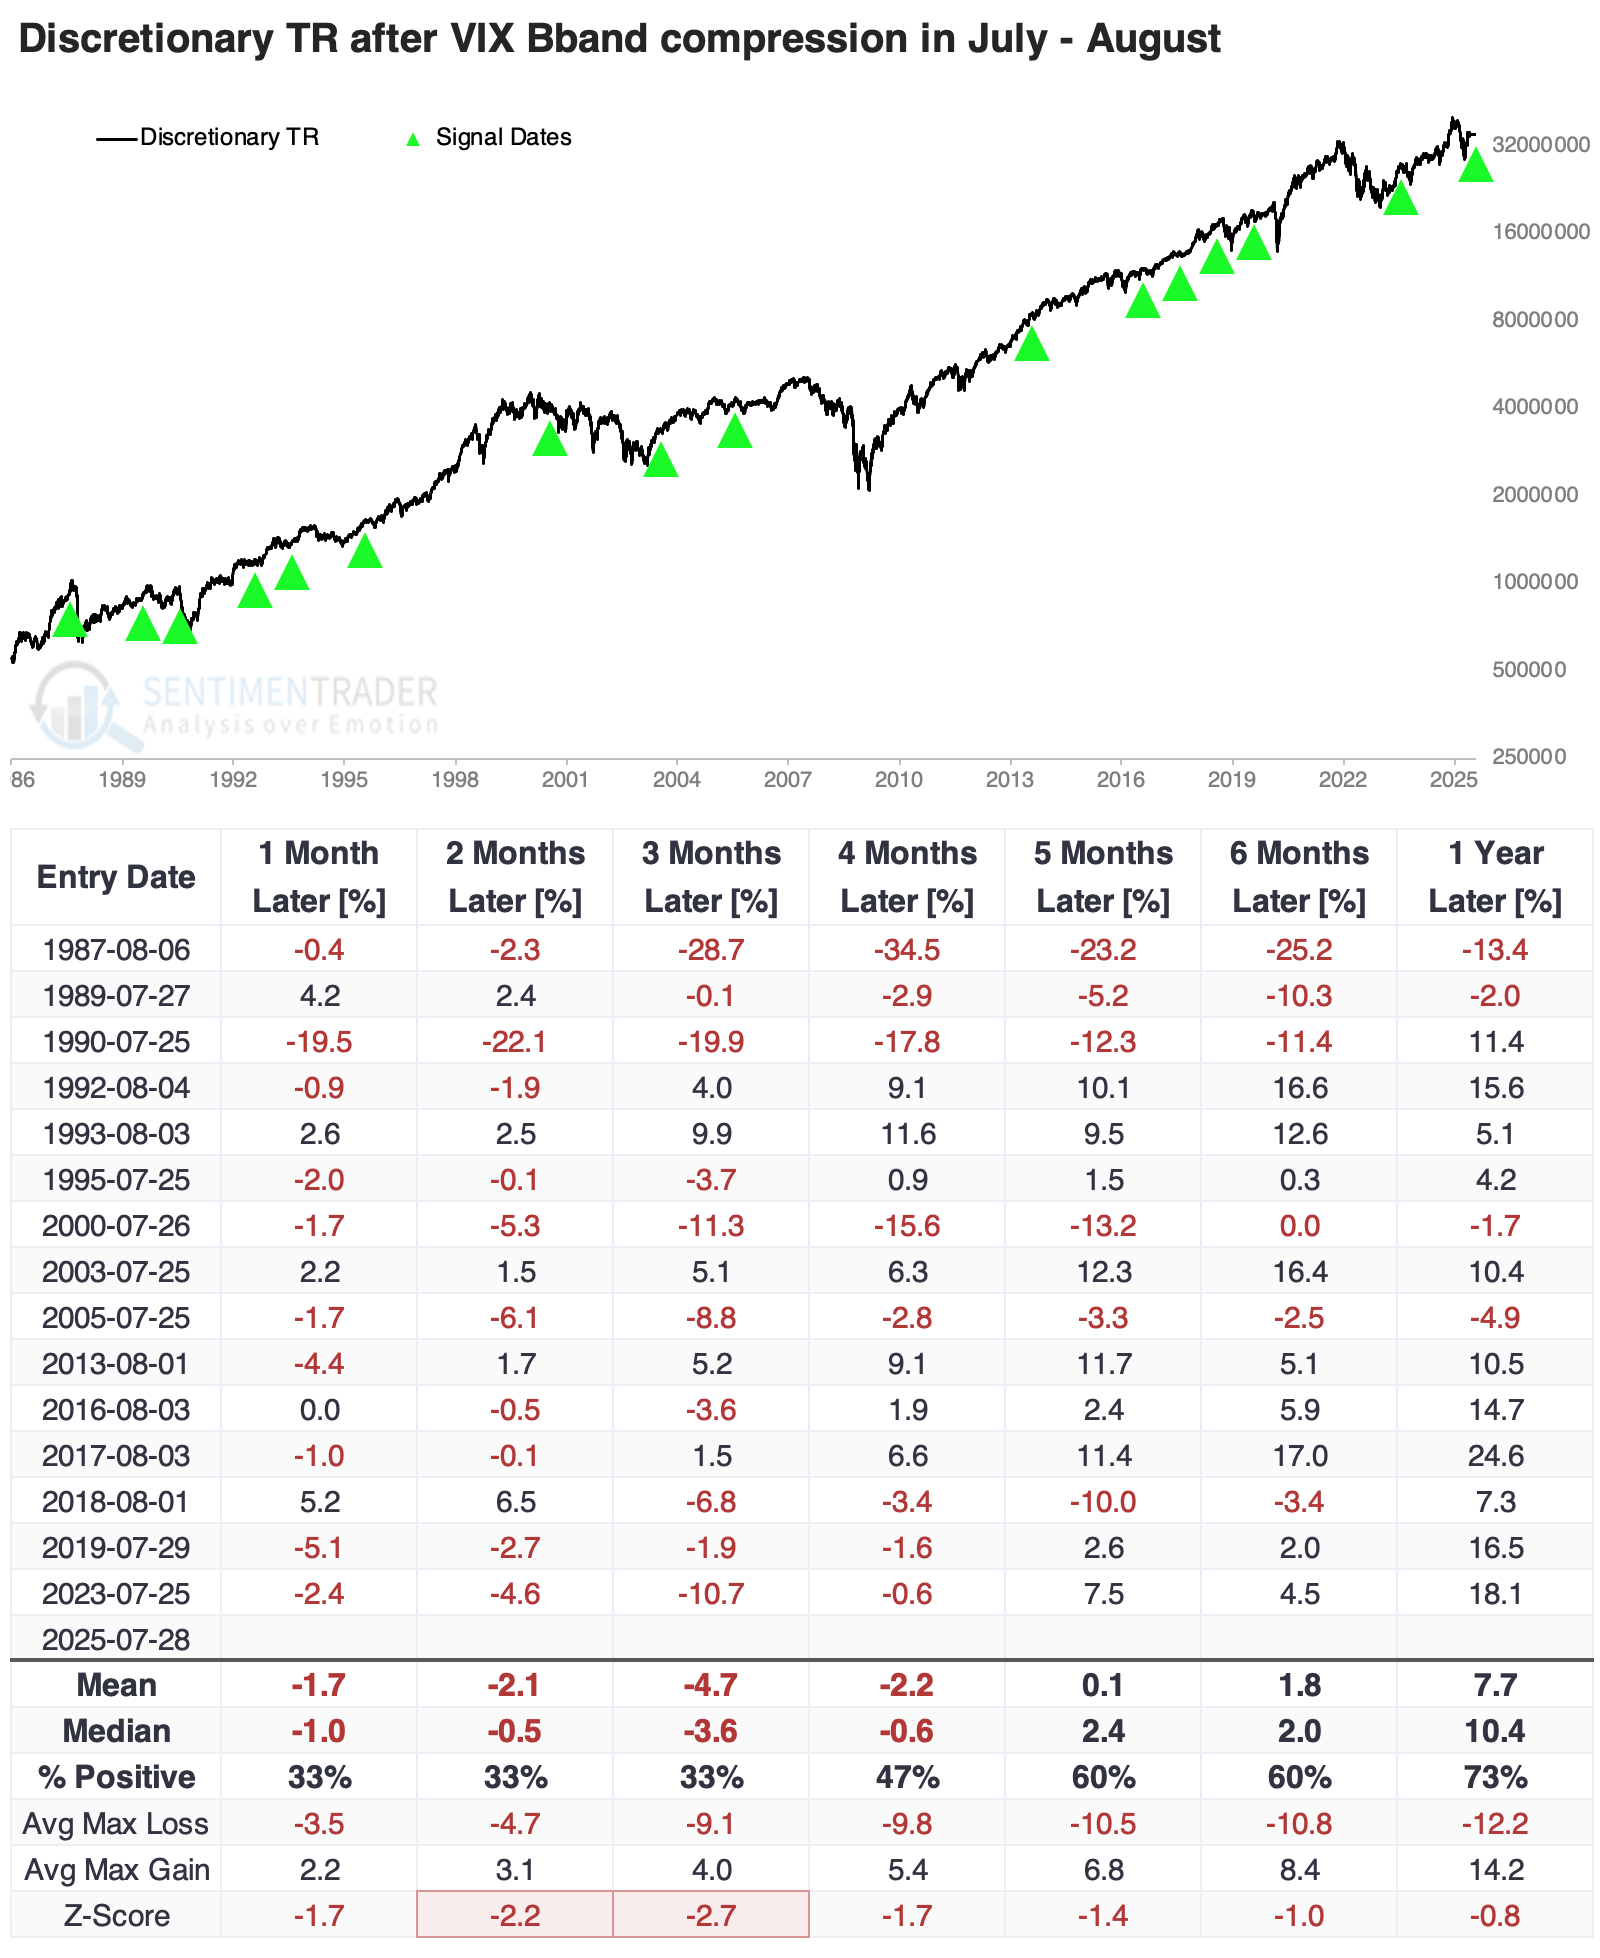
The table below highlights the discretionary sector's total return (price return plus dividends) after these signals. Three months later, roughly the end of October, the sector showed a positive return only a third of the time, a median return of -3.6%, and more than twice as much risk as reward. There were a few exceptions, as usual, but the base case was weakness in the sector.
What the research tells us...
Indications of likely weakness ahead have been few and far between since April. Virtually everything we've discussed on the site has shown a positive expectation for stocks, often over and above their usual positive bias. Even now, there is ample evidence that participation is good, the "correct" sectors are leading, and overall momentum is so strong that it tends to lead to even more.
There is a high hurdle for bearish views on U.S. stocks, and it should take more than one or two modestly negative factors to suggest tempering expectations and a heck of a lot more than that to expect an outright decline worthy of placing a bet. From what we're watching, there is nothing like that latter. But with volatility so calm as we head into the bulk of earnings season and positive tariff headlines, there is decent evidence supporting caution if buyers don't show eagerness to bid up prices in the coming days, especially if the VIX climbs back above 20.