
Bye Biotech - at least for now

Key points
- I wrote about the iShares Biotechnology ETF (ticker IBB) entering a favorable seasonal period in early May. In late June, I wrote another piece suggesting staying the course
- The good news is that in this case, biotech shares acted as hoped and advanced, outpacing the overall market in the process
- The bad news is that it may be a good time to step away from the biotech sector, at least temporarily
Biotech enjoys a rally
In early May, I wrote about the potential for positive results in the biotech sector, which is based heavily on seasonality. The screenshots below are from the original article.
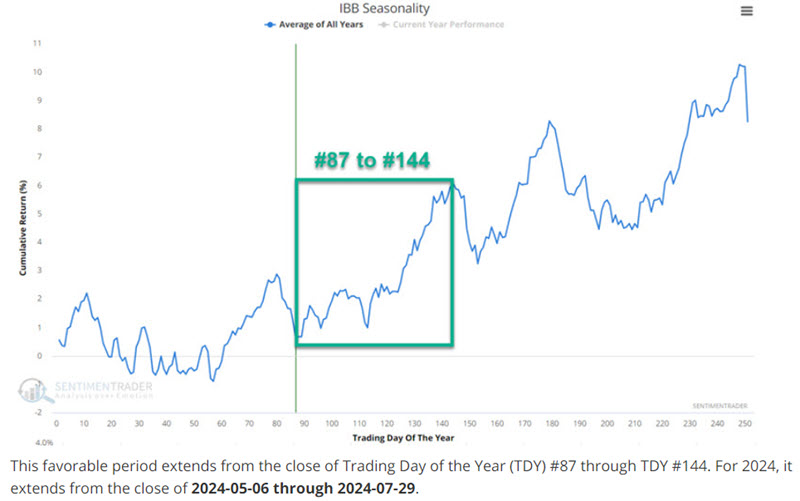
As always, seasonality is not a roadmap. Fortunately, in this case, the sector did what seasonality said it was "supposed to do," i.e., rally. The chart below shows ticker IBB rallied +11.2% from May 6th through July 29th (versus +5.5% for the S&P 500).
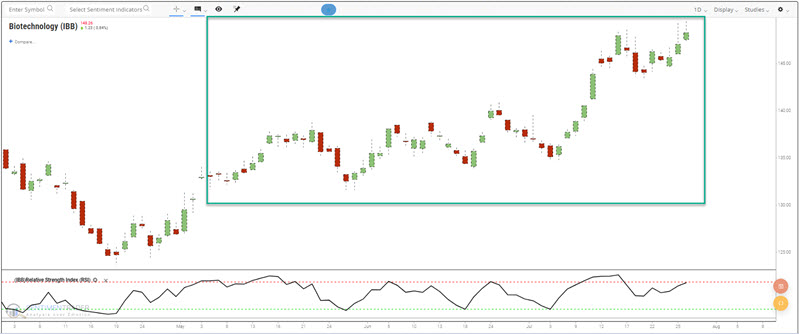
However, it may be time to take a profit - or at least set a reasonably tight trailing stop - in biotech.
Seasonality turns briefly unfavorable
The chart below displays potential seasonal weakness for ticker IBB from Trading Day of Year #144 through TDY #153.
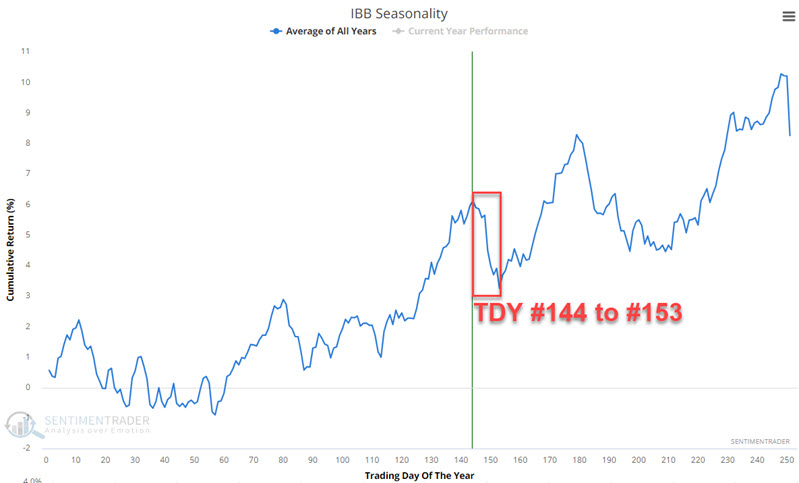
The chart below displays the hypothetical growth of $1 invested in ticker IBB only during this period since 2002.
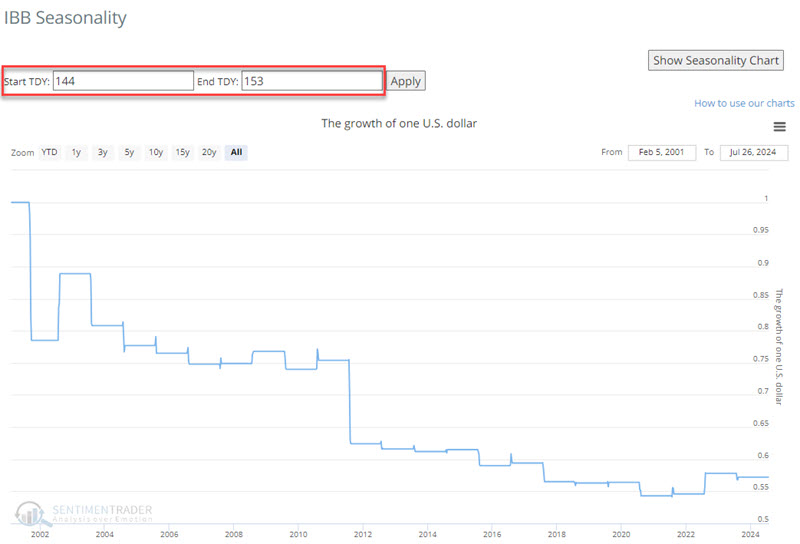
While results are not universally bearish (39% Win Rate), the tendency for weakness is unmistakable.
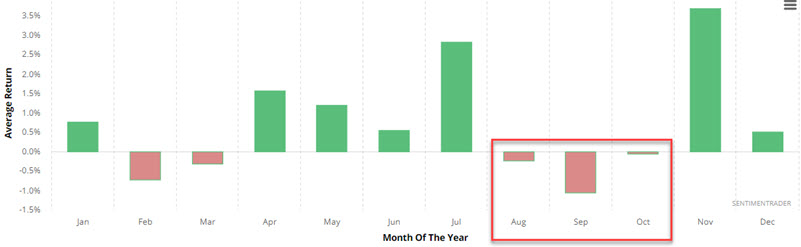
The chart below displays the average monthly results for ticker IBB. Taking a broader look, August through October is the weakest time of year on average.
The chart below displays the growth of $1 invested in ticker IBB only during August, September, and October each year since 2002.
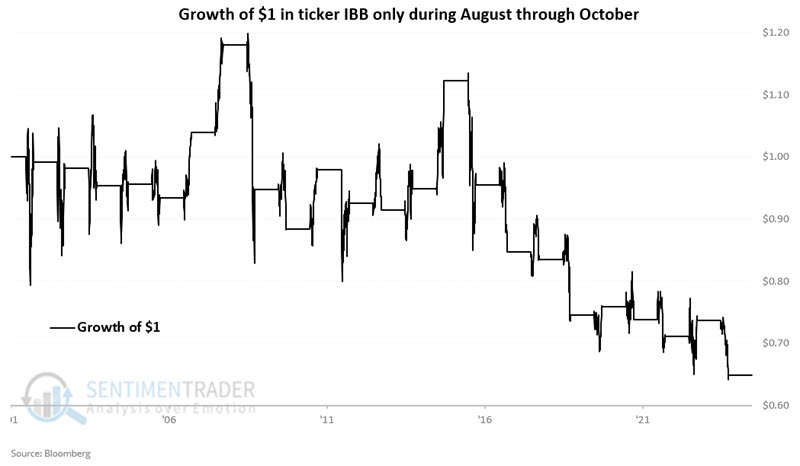 Once again, results are by no means uniformly bearish. But the specter of seasonal weakness looms in the months ahead.
Sentiment is a slight potential headwind
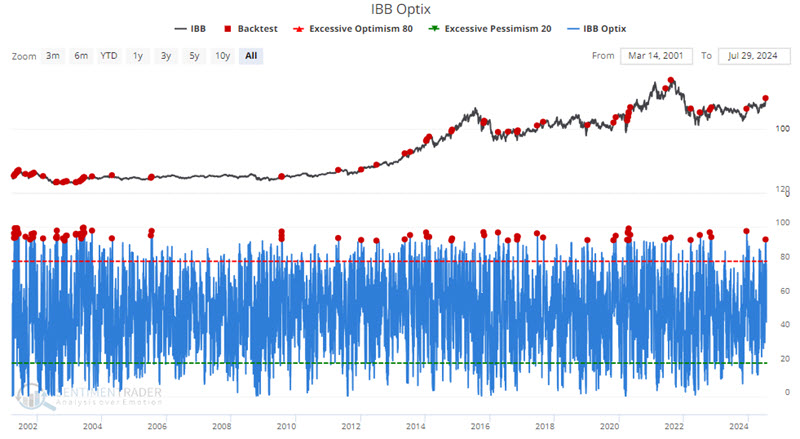
The chart below shows that our IBB Optix indicator recently crossed above 92%. This should not be interpreted as a "sell" signal. However, when combined with what we've just seen with seasonality, it does convey a potentially important message.
The chart below highlights all dates when our IBB Optix indicator crossed above 92%.
The table below summarizes subsequent IBB performance following the dates highlighted in the chart above.
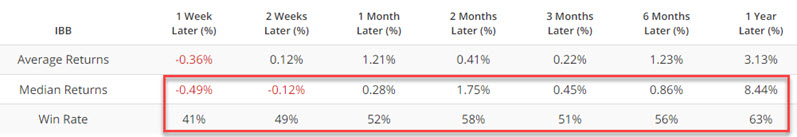
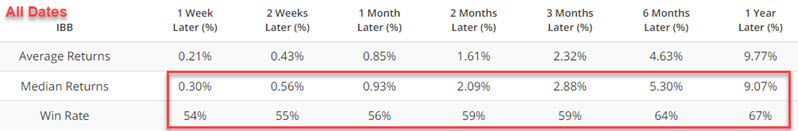
The results are by no means disastrous, and it would be a stretch to categorize them as "bearish." That said, Win Rates and median returns are hardly anything to get excited about. When we compare them to the "average for all dates" in the table below, we see that the results following IBB Optix > 92% dates have been below average across the board (i.e., lower Win Rates and Median Returns for each time frame.
What the research tells us…
The message in the data above is not that the biotech industry is about to fall apart nor that traders should be aggressively playing the short side of IBB. The real message is that the weight of the evidence suggests the potential for the combination of seasonal and sentiment headwinds to affect the biotech sector in the weeks and months ahead and that capital might be better allocated elsewhere. Investors determined to stay the course might at least consider a trailing stop to give the sector more room to move without risking giving back any profits garnered in previous months.