
Buying 5% allocation to RSP, IEMG, HYG

Buying 5% allocations to Invesco S&P 500 Equal-Weight (RSP) and iShares Core MSCI Emerging Markets (IEMG)
The macro outlook for stocks, and emerging market ones in particular, is dire. Whether related to inflation, employment, profitability, energy availability, debt, or pretty much anything else, all the headlines are negative.
One thing I've learned over the decades, however, is that the macro outlook is almost always dire. With the time frame I focus on here, it's less of a concern, but it still appears to be a headwind and it's causing me to be more cautious than I may otherwise be.
The more compelling case for stocks, at least on a medium-term time frame, is the new round of extreme pessimism followed by breadth thrusts.
The spread between our Smart and Dumb Confidence indexes has therefore widened to another extreme, holding above 55%. The S&P 500's annualized return went the spread was above that threshold has been +55.1%.
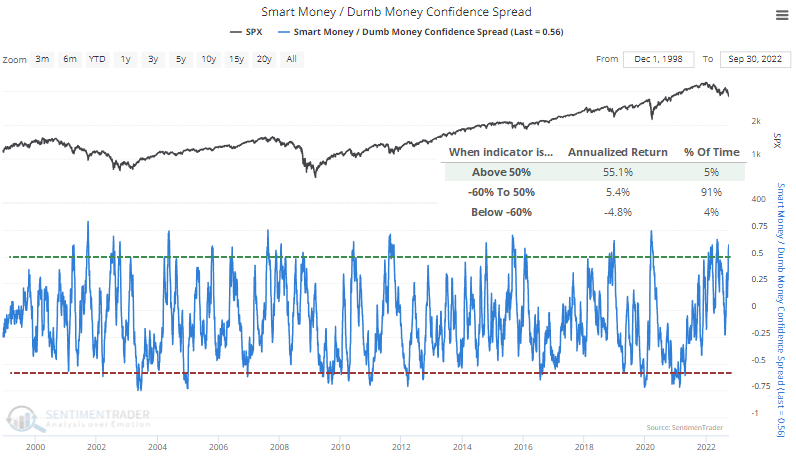
When the spread spent six consecutive days at or above 55%, the S&P 500 rose each time either two or three months later. Out of twelve signals, there was only one loser after two months, which was minimal and was reversed in the weeks following.
As we saw in March 2020, the last two days have witnessed overwhelming buying interest. On the NYSE, five times more securities advanced than declined, and ten times more volume flowed into advancing than declining securities.
Even going back to 1928, this is a rare occurrence. We have less confidence in breadth metrics before 1962, especially before 1950, so we'll limit the lookback to then.
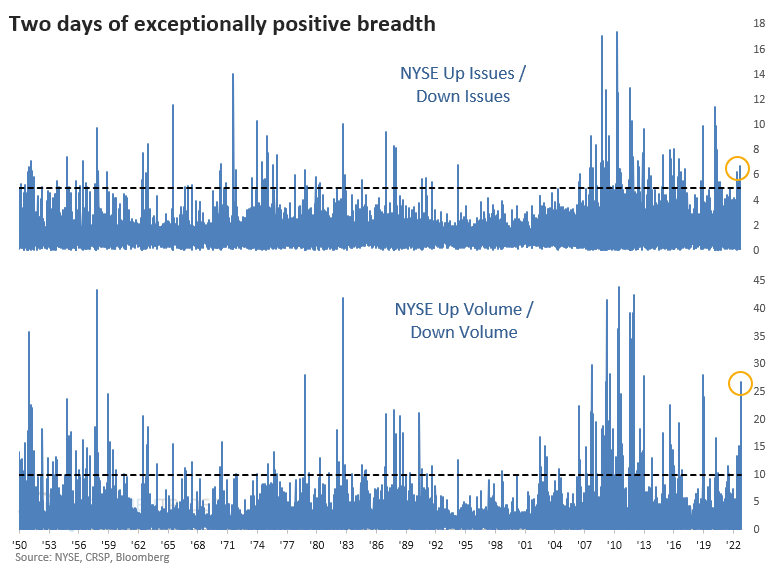
When five times as many securities rose as declined on consecutive sessions, the S&P 500 never suffered a negative one-year return. Even over the next six months, there was only a single small loss. The maximum decline even up to a year later was minuscule on average, though five of them suffered drawdowns larger than -5%. Every signal saw a maximum gain of more than +15% within the following year.
When more than ten times as much volume flowed into advancing versus declining securities, returns were even more consistently positive.
Buying 5% allocation to iShares iBoxx High Yield Corporate Bond ETF (HYG)
For high-yield bonds, we've been waiting for the setup that just triggered. That market had witnessed the worst selling pressure in the 15-year history of the data, in many respects even worse than 2008. We got a thrust off those lows, and now it has settled back. This is the same pattern that emerged around the lows during the financial crisis.
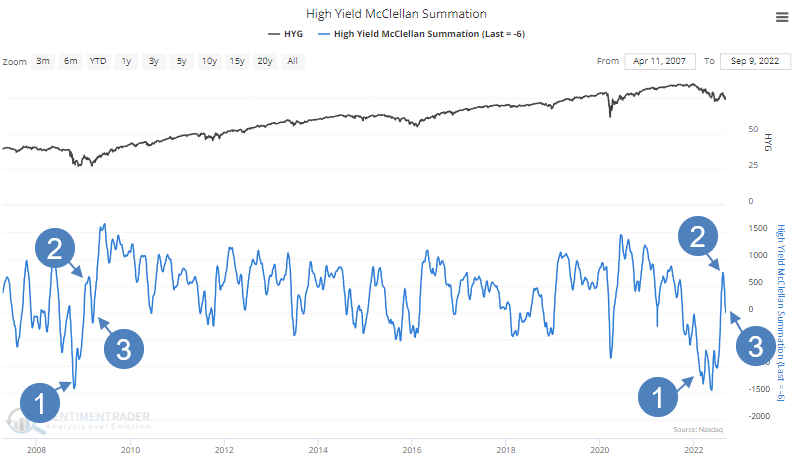
It would be best if we finally saw a consistent pattern of more high-yield bonds at 52-week highs than 52-week lows, and so far we're not. If we do in the weeks ahead, I would likely add further to this position.
Not intended as investment advice. In this account, we roughly follow what has become known as the All-Weather portfolio popularized by Ray Dalio. It allocates across four broad assets, designed to hold up no matter the market environment. The goal is modest positive returns while limiting large, sustained losses. We typically use popular ETFs, with low costs. At times, we will swap out for a fund we believe has better prospects, or simply lower fees if not. At other times, we will diverge quite a bit from baseline allocations, largely depending on the indicators and studies we discuss on the site. The base allocation includes stocks (35%), bonds (35%), gold (5%%), commodities (5%) and cash/other (20%).