
Buyers show overwhelming interest in resolving breadth divergences

Key points:
- The S&P 500 is holding well above its 200-day average even as relatively few member stocks do
- Similar behavior preceded some bull market peaks, though it was not consistent enough to be a warning
- Also alleviating the warning signs is the rapid and overwhelming interest from buyers in recent days
Poor participation, but it's rapidly changing
The healthy market environment has been losing some legs, which is not good. But a spurt of overwhelming buying interest has rapidly alleviated some of that concern.
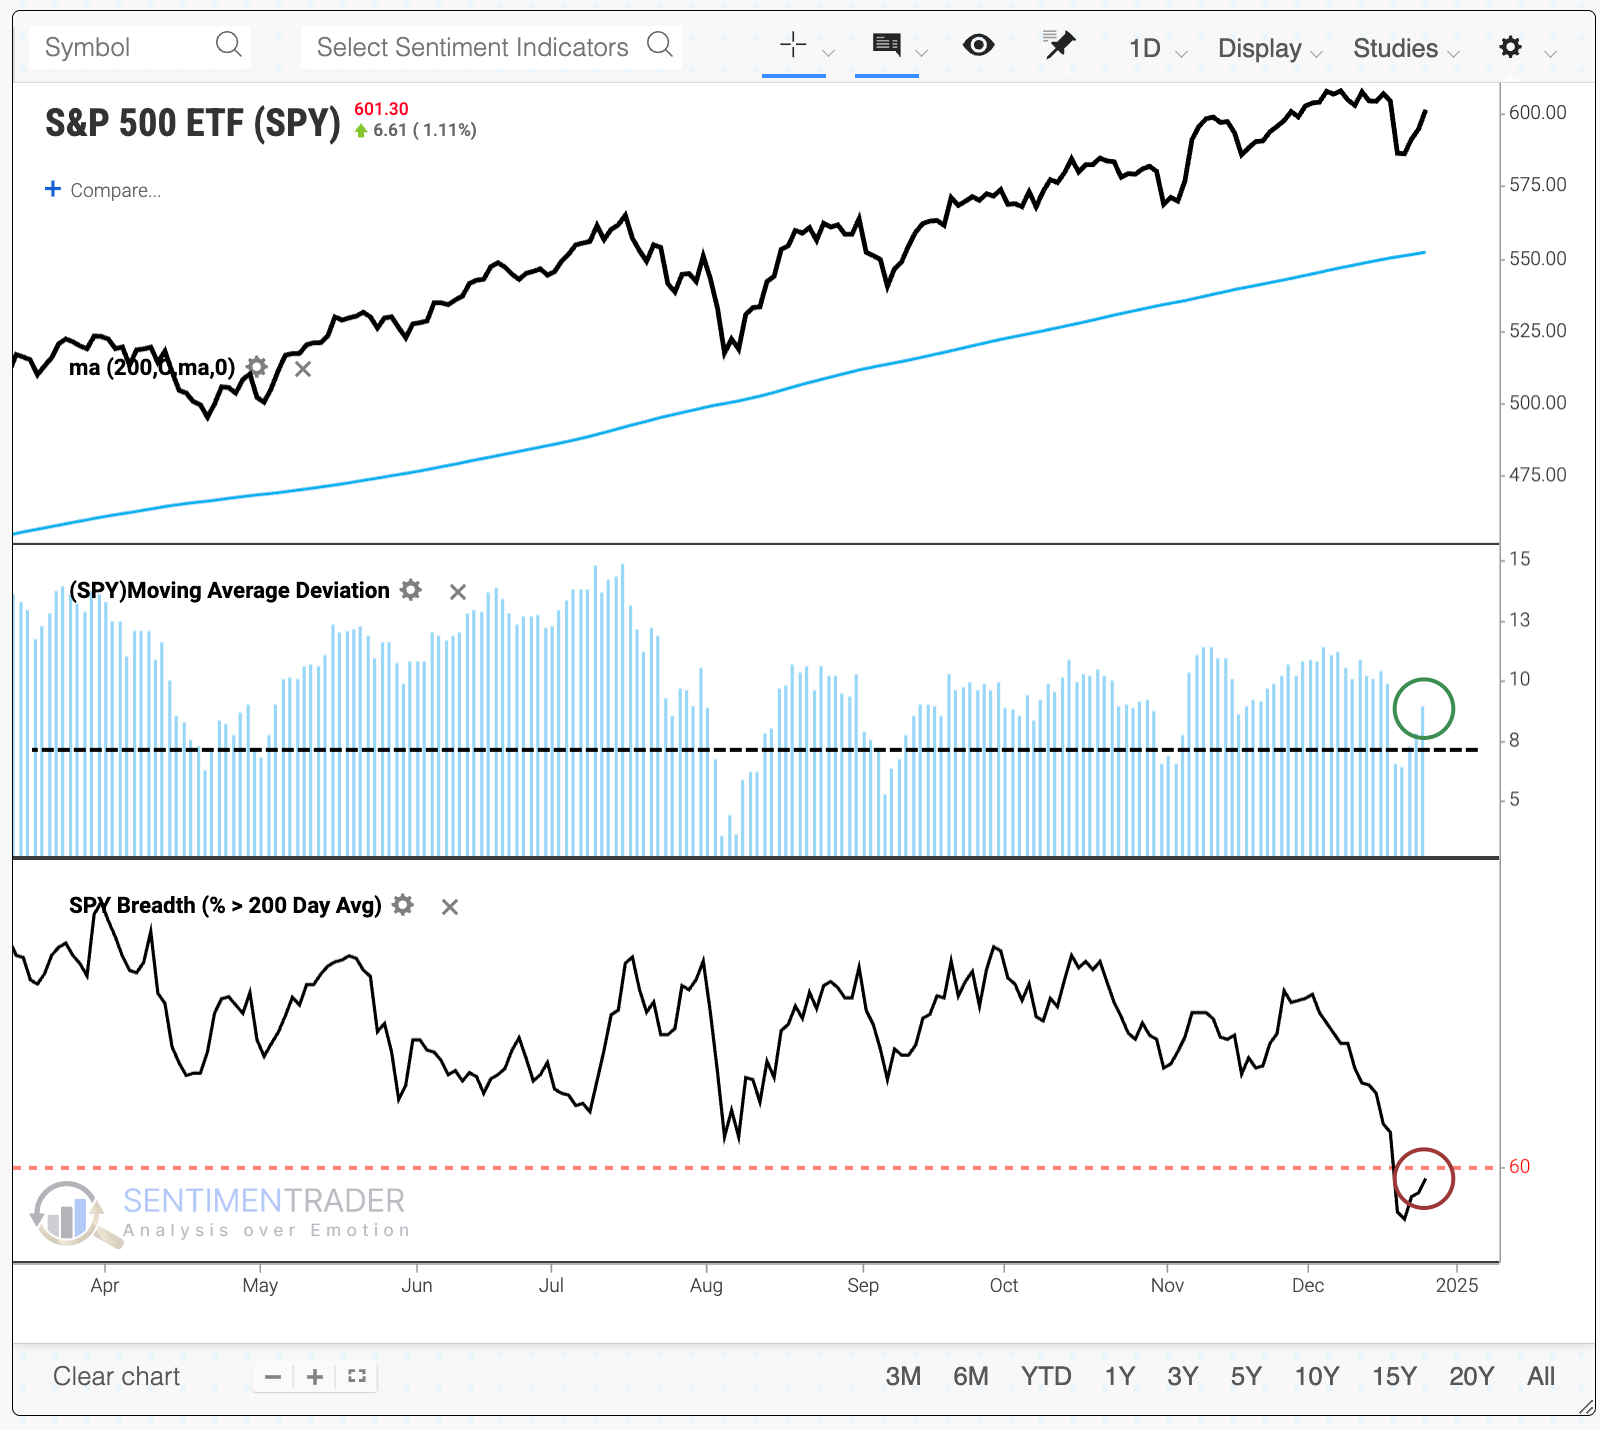
Poor participation under the surface of the S&P 500 and other indices has caused some long-term measures of market breadth to deteriorate to an unhealthy condition. That is evident in many measures, a primary one being the percentage of stocks holding above their 200-day moving averages.
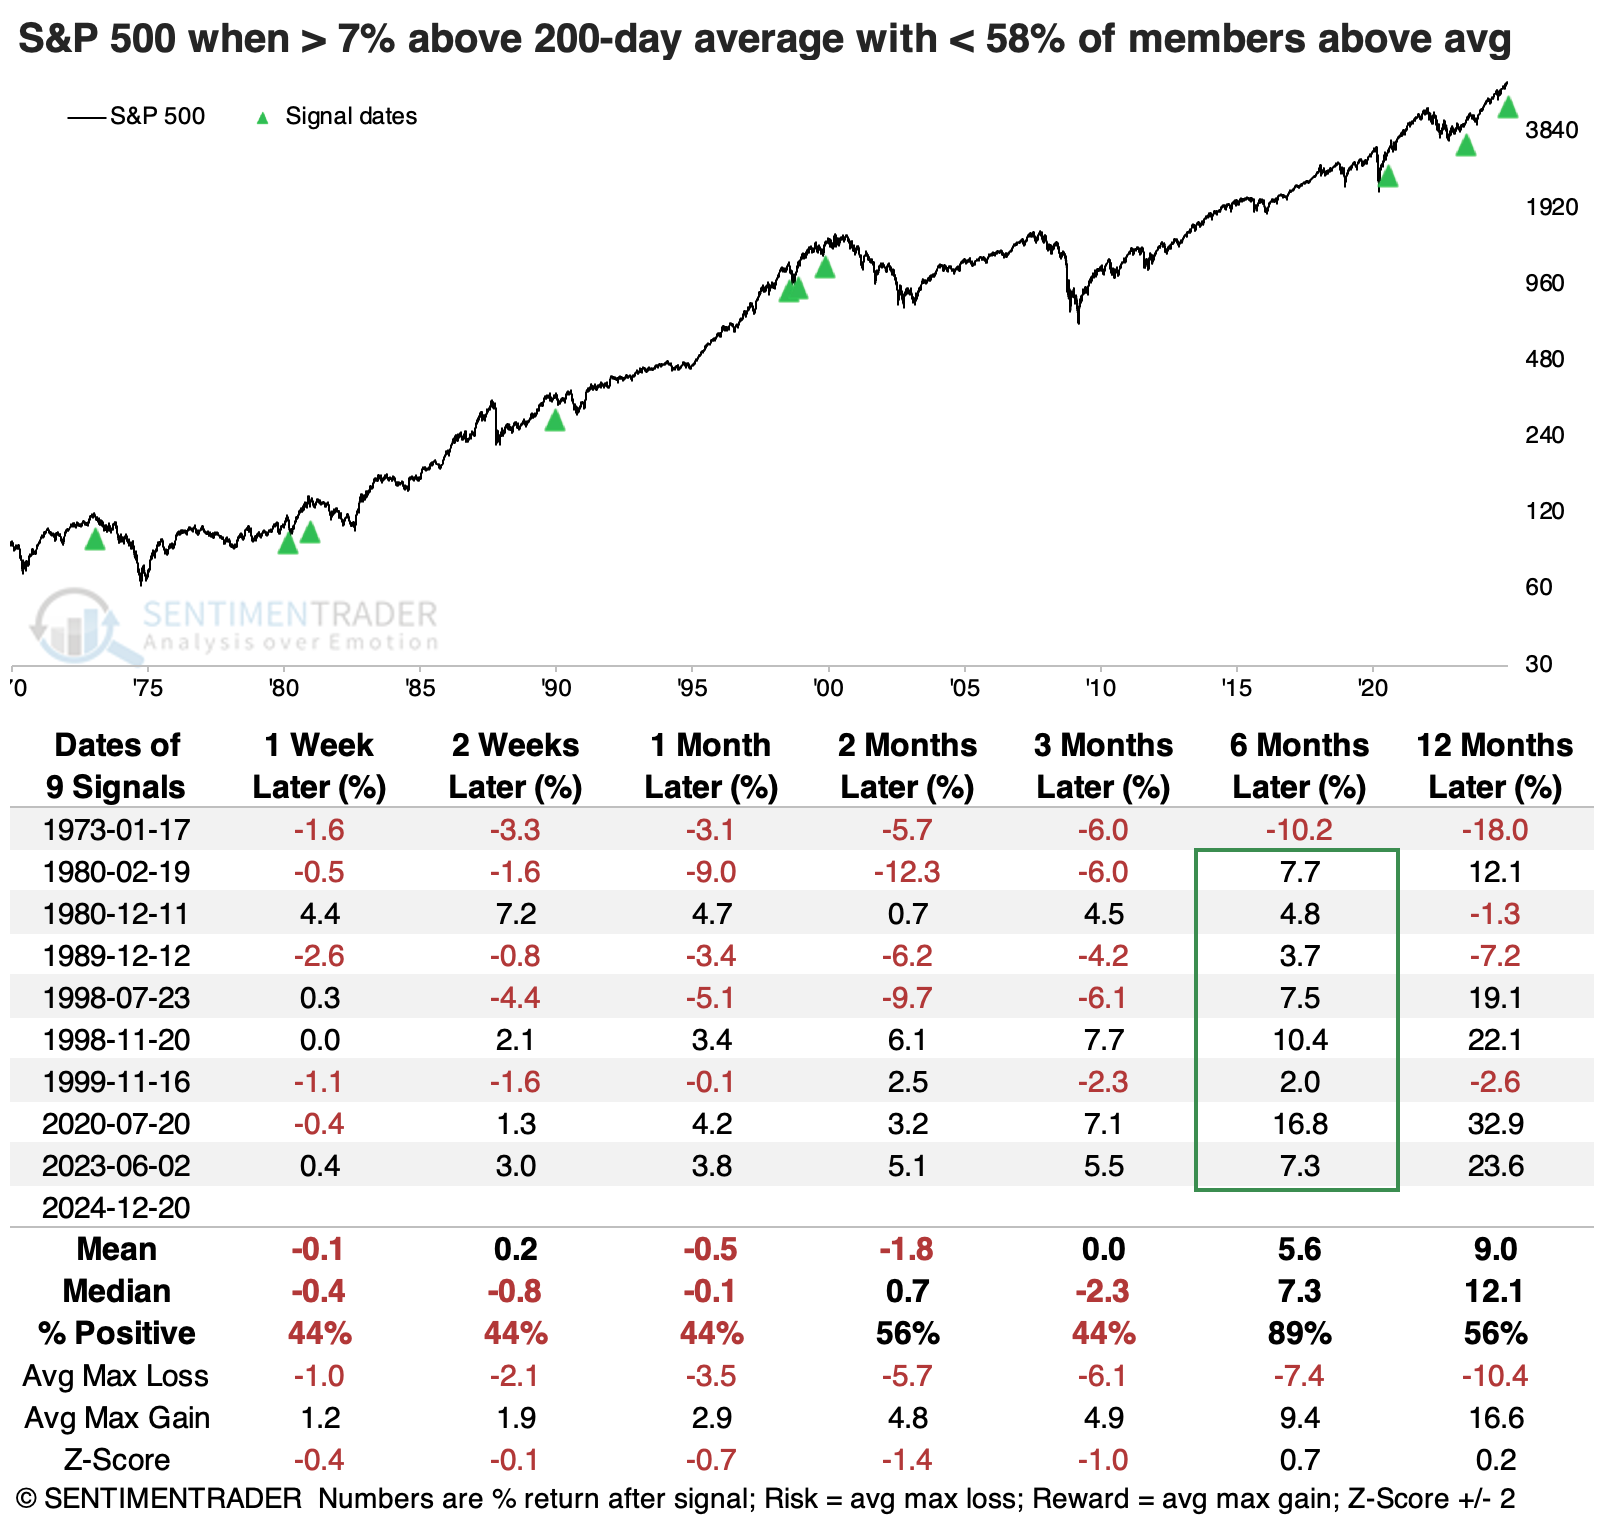
Curiously, the S&P 500 index has been levitating more than 7% above its average, while fewer than 58% of its member stocks are holding above their 200-day averages by any amount.
It's rare to see such disparate performance between the index and its constituents. These conditions persisted near the peaks of several bull markets. However, the six-month returns were positive every time but once, and the last two signals preceded massive gains for stocks.
The table below shows more precedents due to relaxing the parameters. These are dates when the S&P was more than 5% above its 200-day average and had fewer than 60% of members above theirs.
These loosened thresholds added a couple more bull market peaks (2007, 2021) and several more innocuous signals. The S&P's overall reaction tended toward the positive side, with above-average returns across time frames. 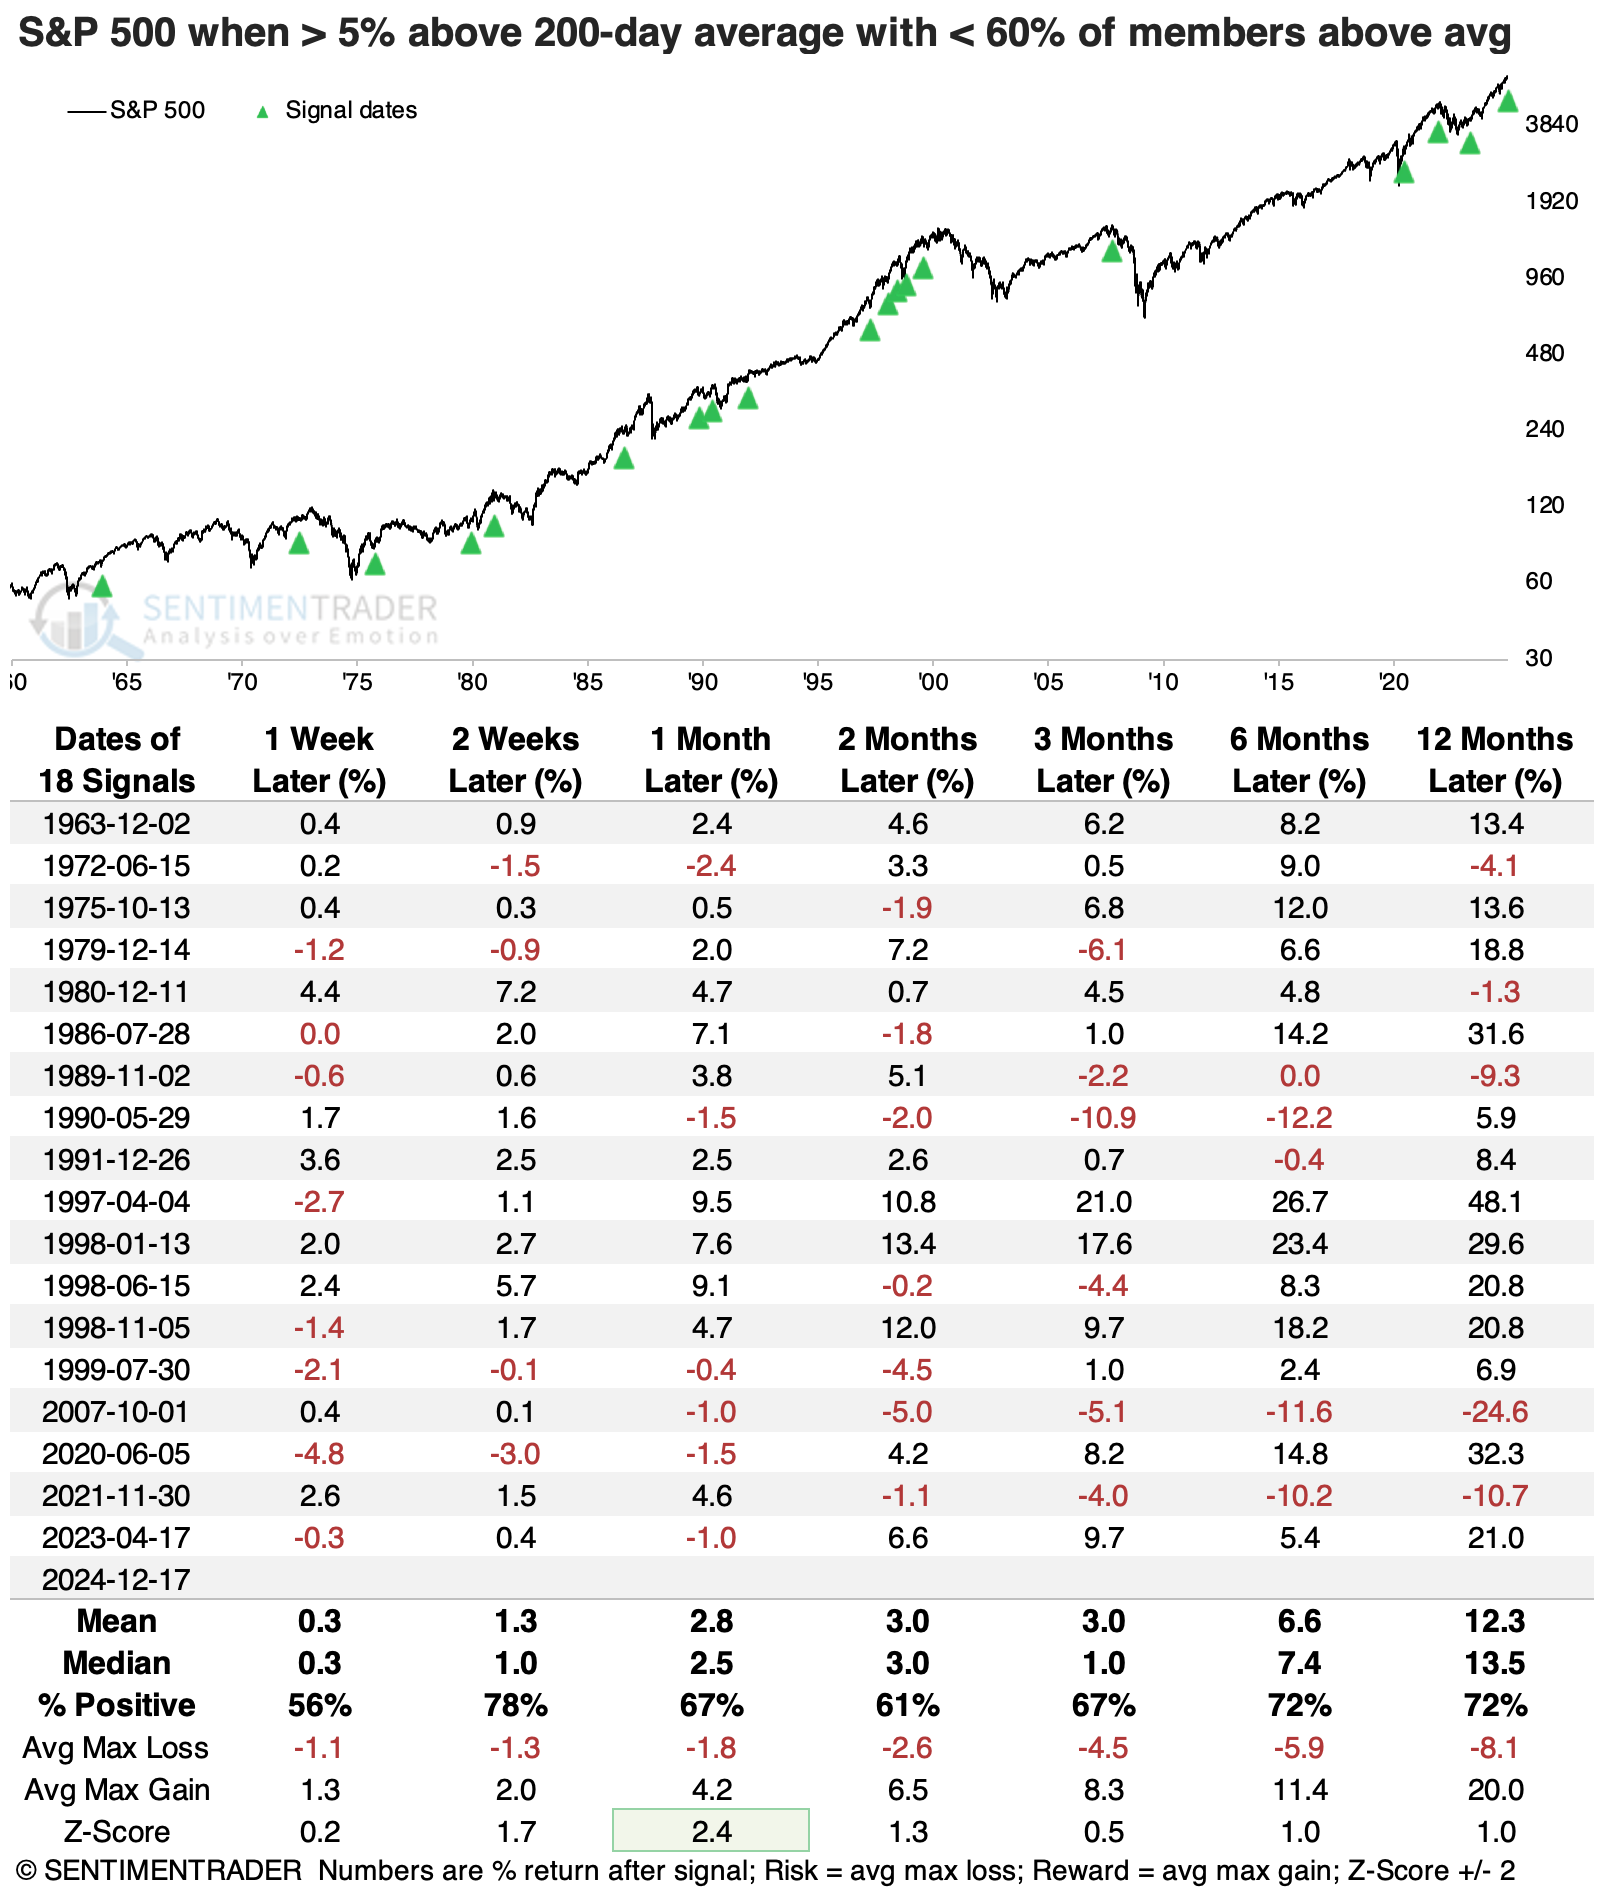
Another quick switch
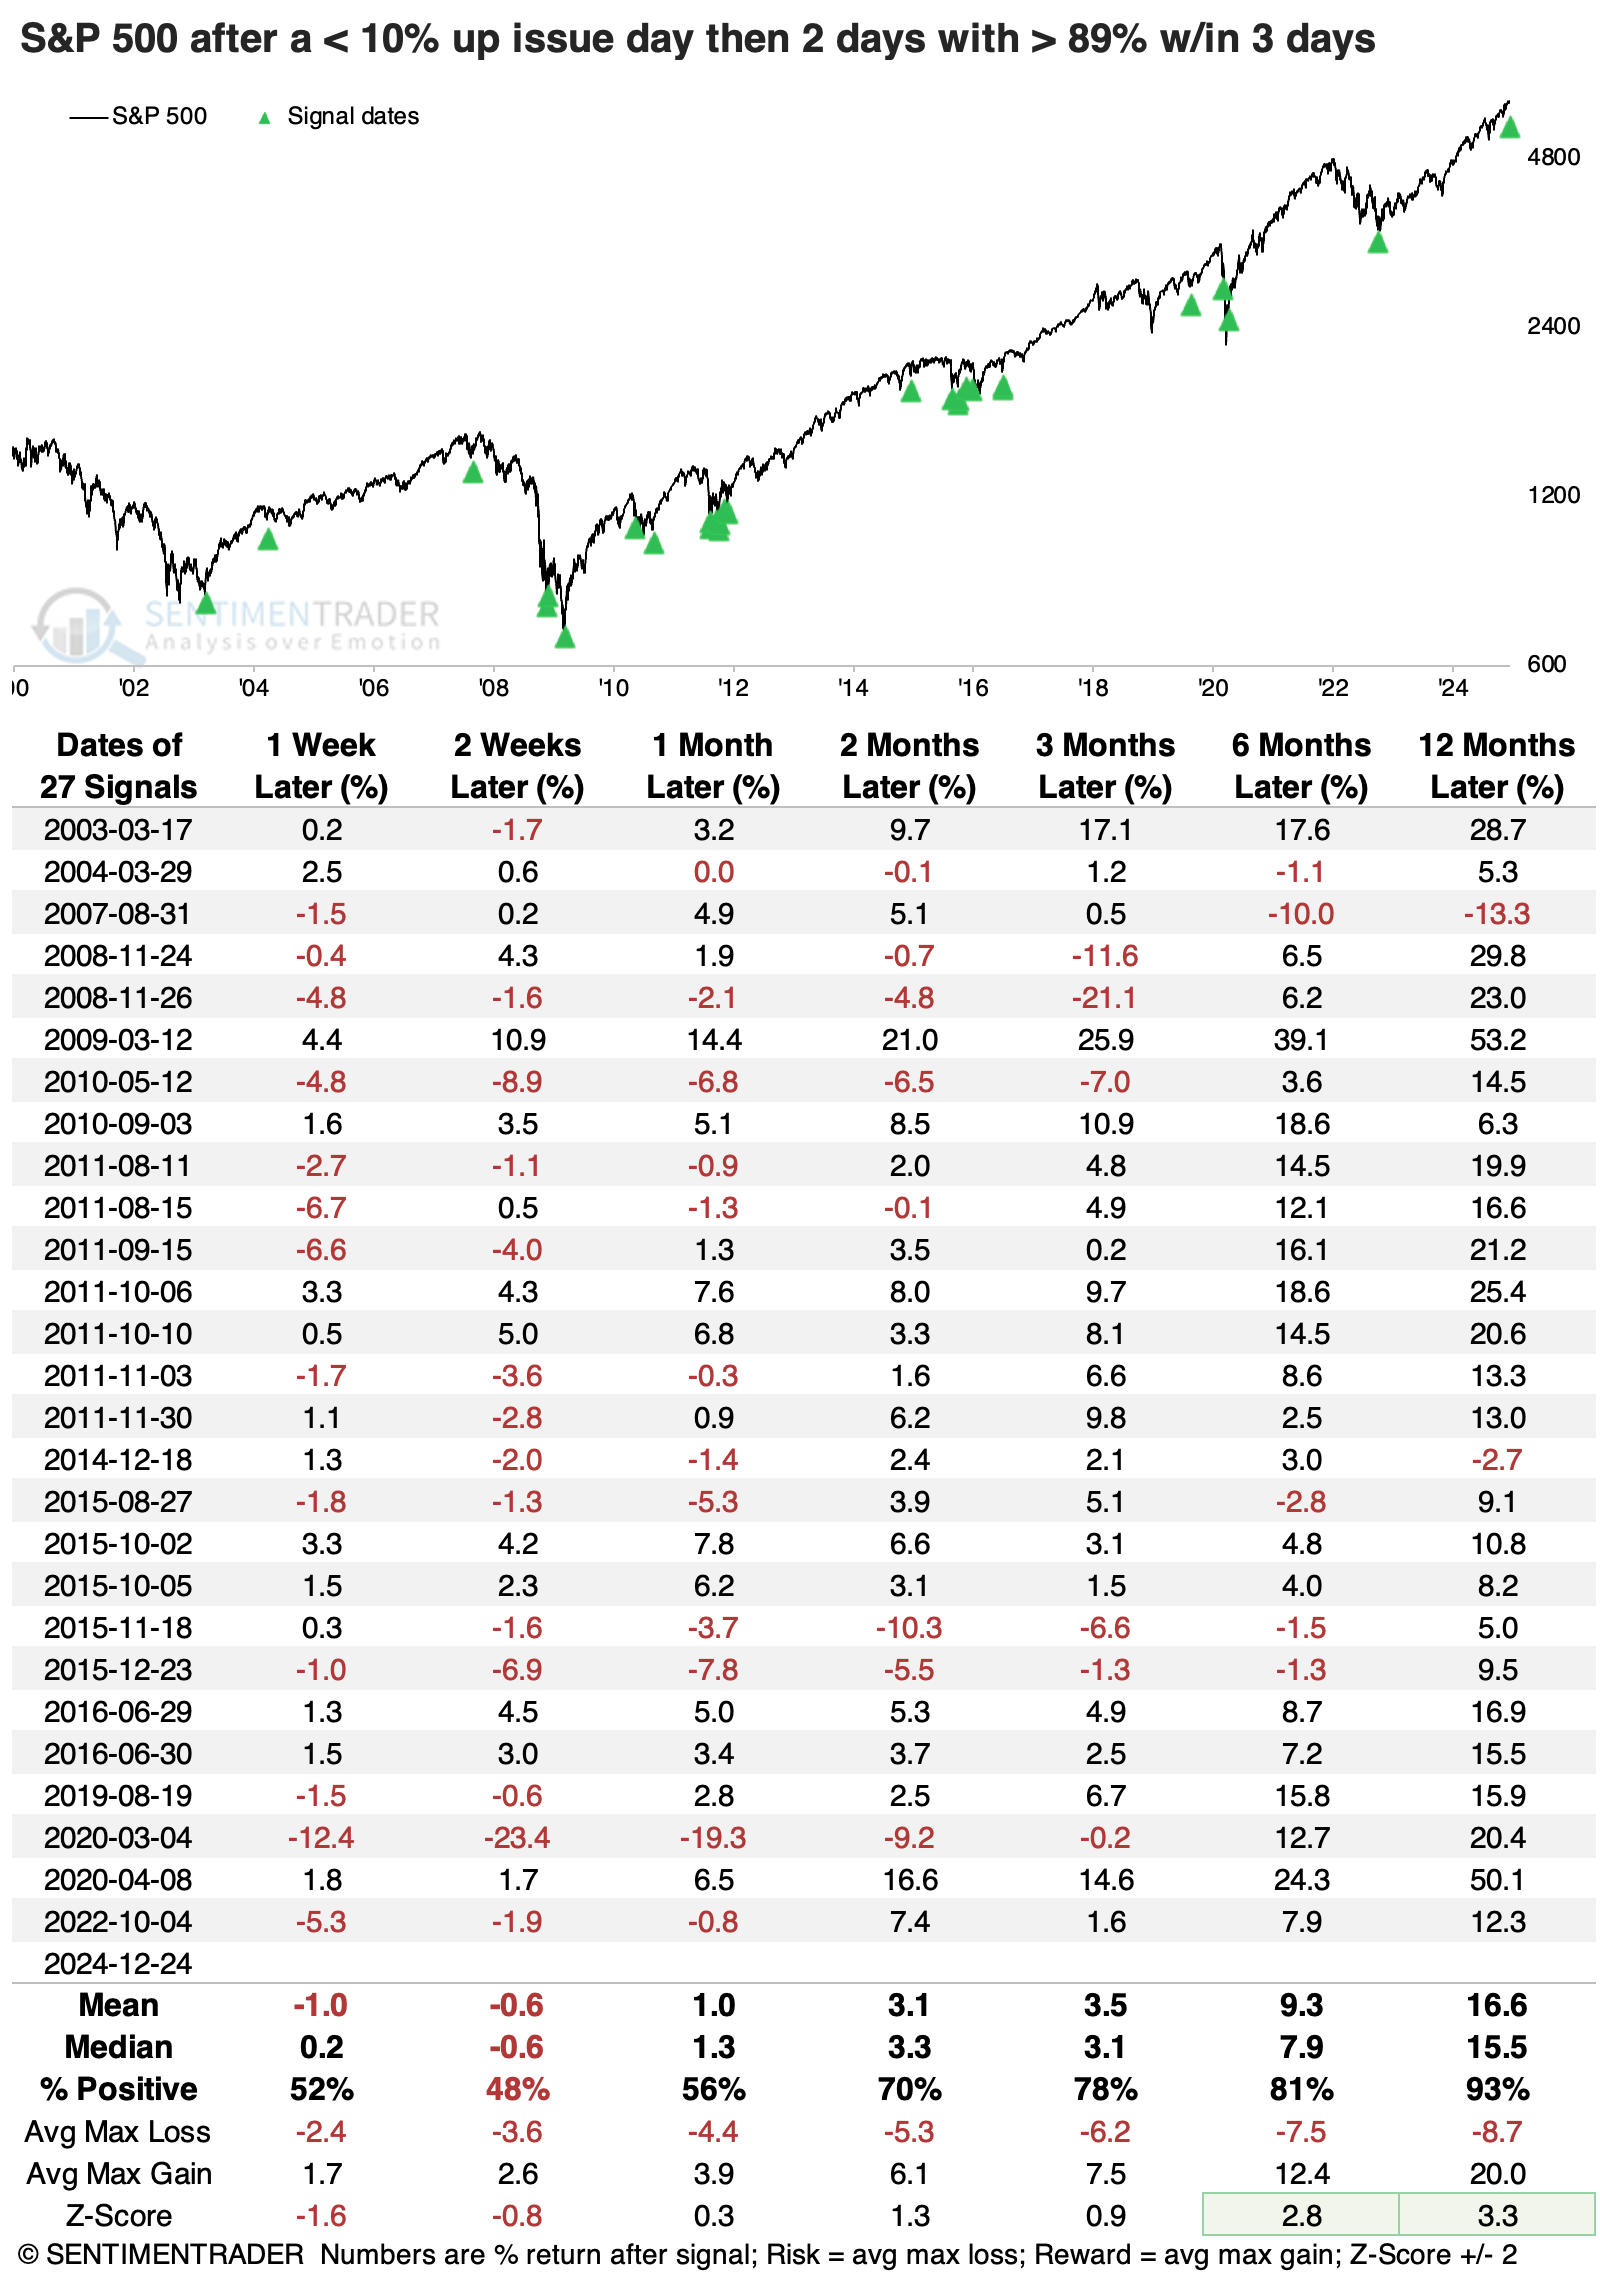
One factor adding to the potentially positive side of the ledger is the swift and overwhelming reaction to last Wednesday's bad day. While fewer than 10% of S&P 500 stocks rose that day, we've now had two days in quick succession with (nearly) 90% of members rising.
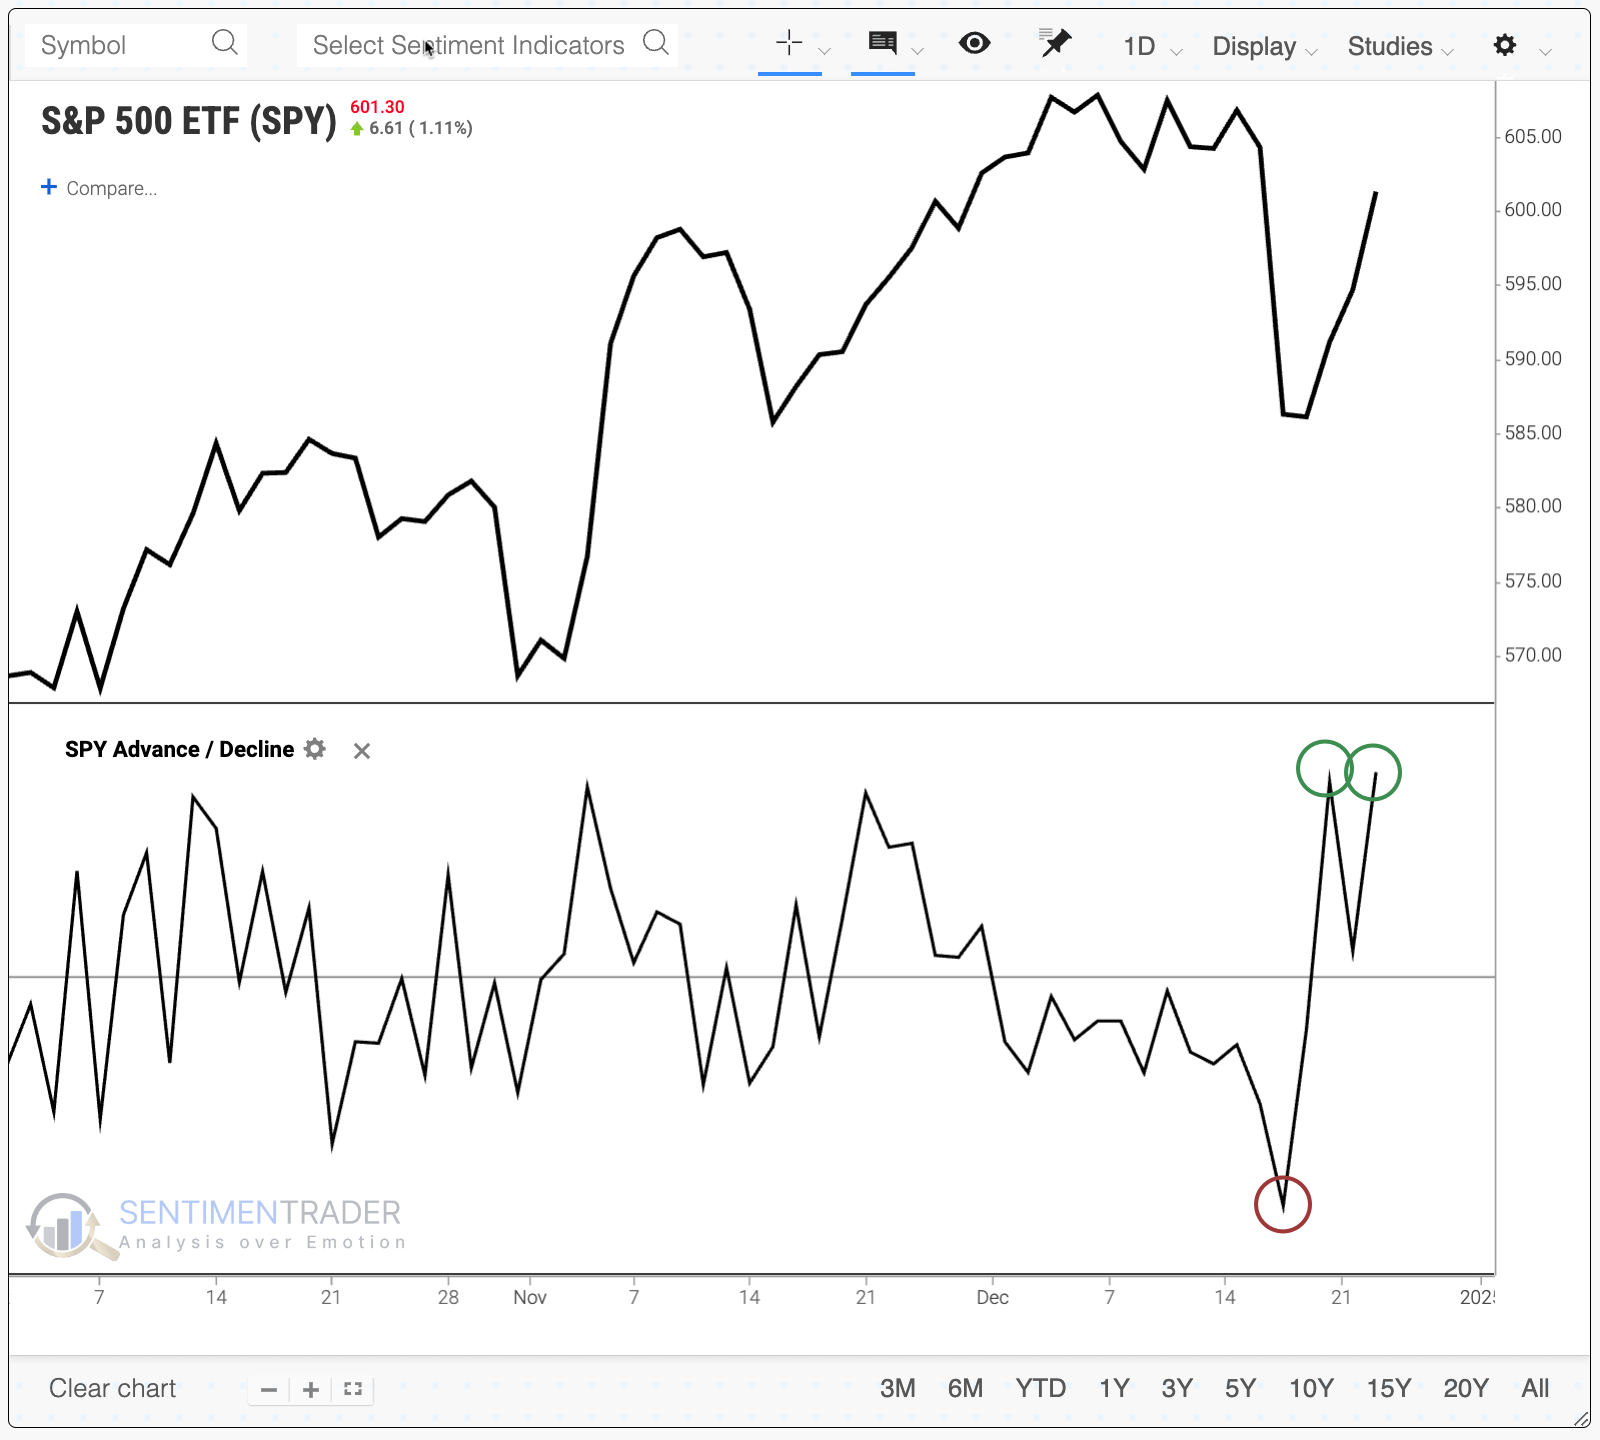
There is typically not this type of rapid and impressive interest from buyers ahead of and during ongoing bear markets. We see this more often near the ends of declines, not beginnings.
The table below shows every similar occurrence over the past 90 years. Incredibly, it had never happened before 2003, but that can probably be explained away by the decimalization in 2001, which was the primary factor in making breadth figures more volatile. The S&P struggled in the weeks following several of these signals, and it did trigger ahead of a few significant declines. Still, overall, it was a positive sign, especially on longer time frames.
What the research tells us...
The deterioration in some trusty long-term breadth metrics bears watching. Healthy market environments do not typically see readings like we're seeing now, at least for more than a few sessions at a time.
The biggest caveat to becoming too negative is that buyers have already shown an impressive interest in buying the dip in the average stock. While light holiday trading may be a factor in some of these figures, it has rarely been a good idea to try to outsmart the indicators by guessing the underlying reasons for their moves.