Data &
Technology
Research
Reports
Report Solutions
Reports Library
Actionable
Strategies
Free
Resources
Simple Backtest Calculator
Simple Seasonality Calculator
The Kelly Criterion Calculator
Sentiment Geo Map
Public Research Reports
Free Webinar
Pricing
Company
About
Meet Our Team
In the News
Testimonials
Client Success Stories
Contact
Log inLoginSign up
< BACK TO ALL REPORTS

Buyers push stocks to yet another surge

Jason Goepfert
2020-11-06
So far this week, buying interest in stocks was enough to generate 3 days with overwhelming volume flowing into advancing stocks. Similar surges preceded long-term gains every time. This year has also now surpassed 2009 as having the most thrusts of any year since 1962.

This has been quite a year in many respects. One of the most remarkable is the sheer number of days when buyers went almost all-in on stocks.

There was a historic surge of days with buyers focusing their volume overwhelming in advancing stocks in March through May. Then again in early October, we saw another significant cluster.

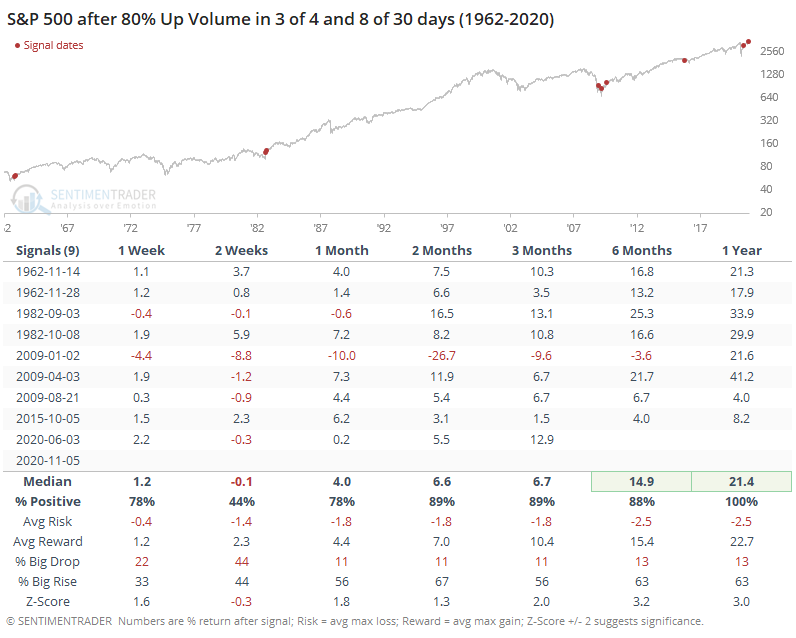
This week triggered another round, with 3 out of the past 4 sessions having better than 80% Up Volume on the NYSE. That just adds to what we'd seen in October, so there have also been at least 8 sessions out of the past 30 with such positively skewed volume.

When these clusters have triggered before, stocks breathed a bit short-term but showed excellent gains and risk versus reward over the next 6-12 months.

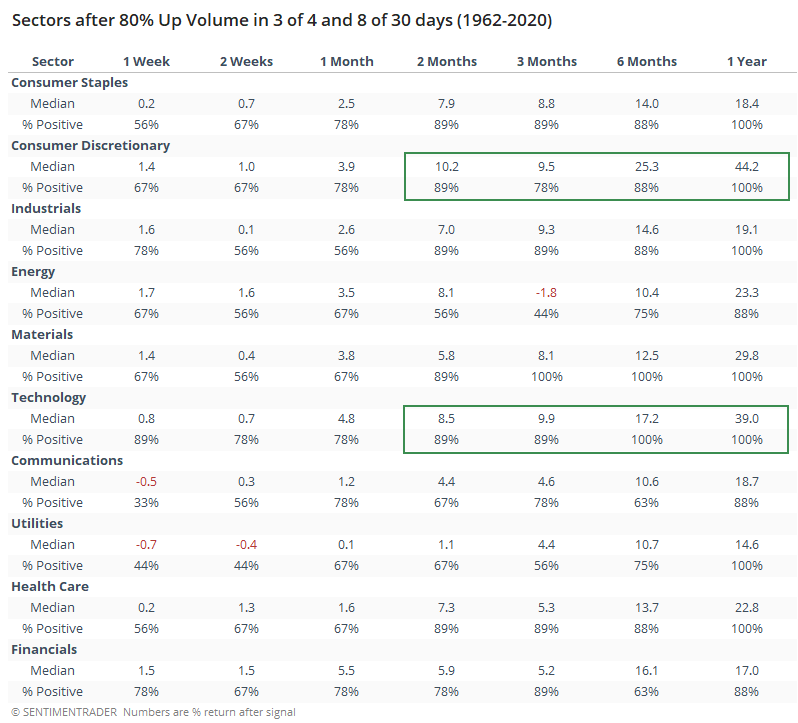
Not surprisingly, the sectors showing the best returns after clusters like this were the higher-beta ones, like Consumer Discretionary and Technology.

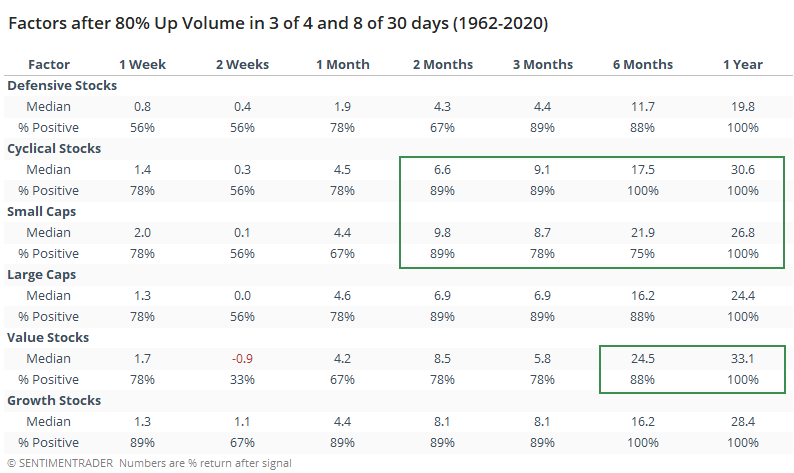
The factors showed the same bias, with the best returns in Cyclical and Small-Cap stocks over the medium- to long-term. Value stocks also performed well, with an average gain of more than 33% over the next 12 months.

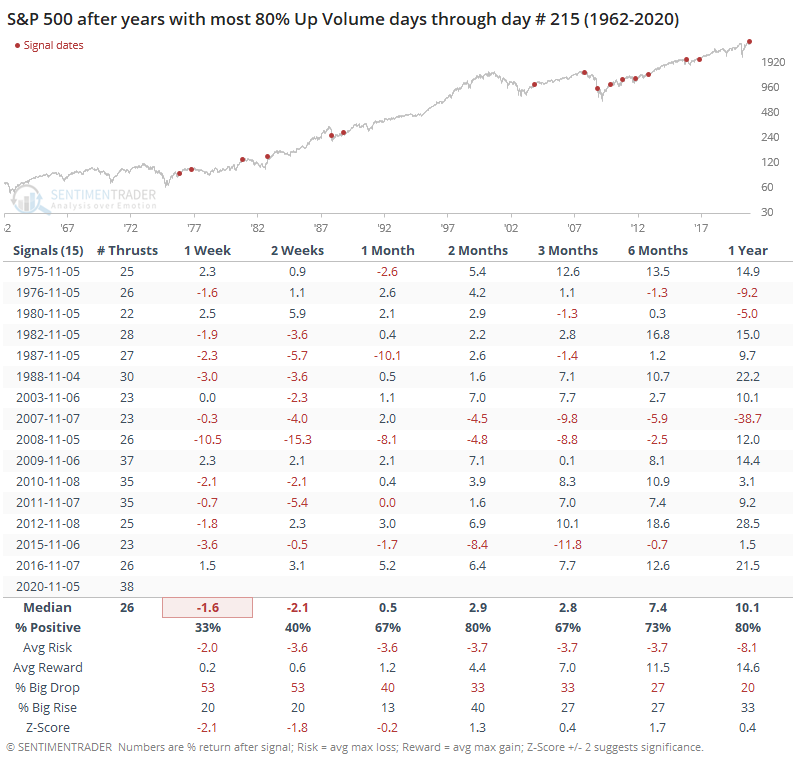
This year has now surpassed 2009 as having the greatest number of days with 80% or more Up Volume through session #215.

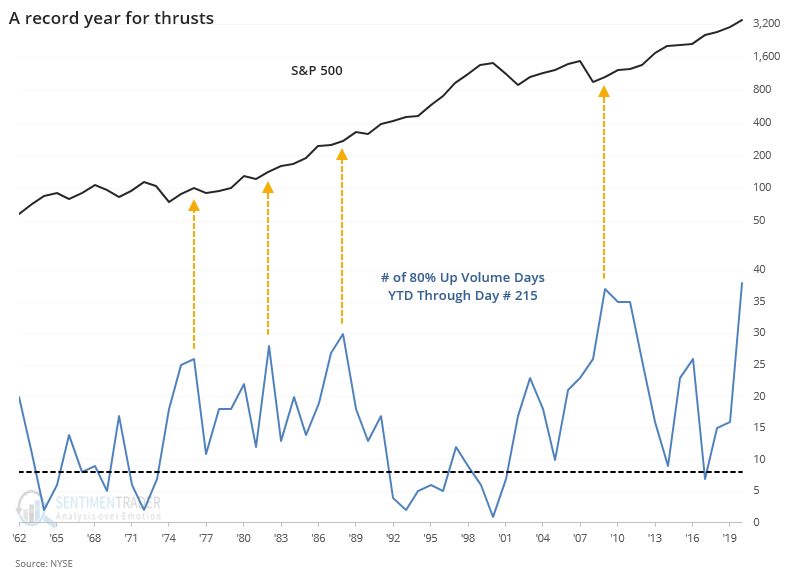
After the years with the most thrusts at this time of year, short-term returns were poor, but medium-term ones were good with 3 losses out of 15 signals over the next 2 months.

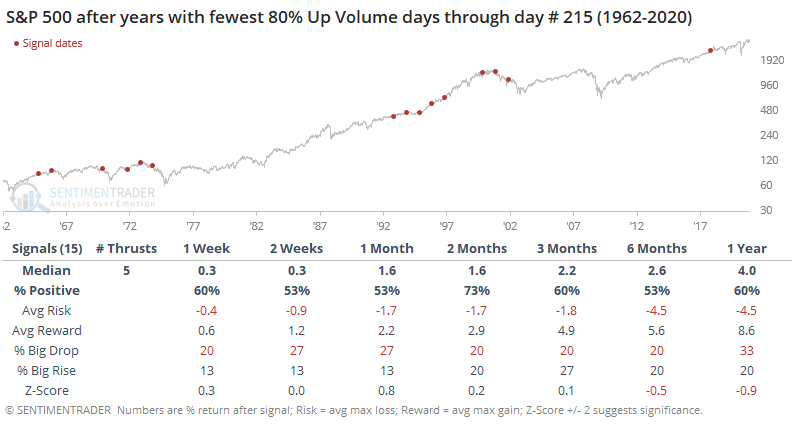
After years with the fewest number of 80% Up Volume days, returns were more muted over the medium- to long-term.

Just because we see a cluster of days with huge Up Volume doesn't mean there can be no weakness going forward - we saw that clearly enough in October. Short-term returns aren't the most consistent time frame for these, anyway. The continued pressure from buyers that was on display yet again this week continues to be a strong argument for higher prices over the medium- to long-term.

Sorry, you don't have access to this report

Upgrade your subscription plan to get access
Go to Dasboard
DATA &
TECHnologies
IndicatorEdge
‍
BackTestEdge
‍
Other Tools
‍
DataEdge API
RESEARCH
reports
Research Solution
‍
Reports Library
‍
actionable
Strategies
Trading Strategies
‍
Smart Stock Scanner
‍
FREE
RESOUrCES
Simple Backtest
Calculator
Simple Seasonality
Calculator
The Kelly Criterion
Calculator
Sentiment Geo Map
‍
Public Research Reports
‍
Free Webinar
COMPANY
‍
About
‍
Meet our Team
‍
In the News
‍
Testimonials
‍
Client Success Stories
Pricing
Bundle pricing
‍
Announcements
‍
FAQ
© 2024 Sundial Capital Research Inc. All rights reserved.
Setsail Marketing
TermsPrivacyAffiliate Program
Risk Disclosure: Futures and forex trading contains substantial risk and is not for every investor. An investor could potentially lose all or more than the initial investment. Risk capital is money that can be lost without jeopardizing ones’ financial security or life style. Only risk capital should be used for trading and only those with sufficient risk capital should consider trading. Past performance is not necessarily indicative of future results.

Hypothetical Performance Disclosure: Hypothetical performance results have many inherent limitations, some of which are described below. No representation is being made that any account will or is likely to achieve profits or losses similar to those shown; in fact, there are frequently sharp differences between hypothetical performance results and the actual results subsequently achieved by any particular trading program. One of the limitations of hypothetical performance results is that they are generally prepared with the benefit of hindsight. In addition, hypothetical trading does not involve financial risk, and no hypothetical trading record can completely account for the impact of financial risk of actual trading. for example, the ability to withstand losses or to adhere to a particular trading program in spite of trading losses are material points which can also adversely affect actual trading results. There are numerous other factors related to the markets in general or to the implementation of any specific trading program which cannot be fully accounted for in the preparation of hypothetical performance results and all which can adversely affect trading results.

Testimonial Disclosure: Testimonials appearing on this website may not be representative of other clients or customers and is not a guarantee of future performance or success.