Products
SentimenTrader Trading Tools
‍
Backtest Engine
My Trading Toolkit
Correlation Analysis
Seasonality
Market Prediction
Indicators & Data API
‍
Proprietary Indicators & Charts
Market Data API
Strategies & Scanner
‍
50+ Trading Strategies
Smart Stock Scanner
Smart Option Scanner
Research Reports
‍
Research Solutions
Reports Library
Free Resources
Simple Backtest Calculator
Simple Seasonality Calculator
The Kelly Criterion Calculator
Sentiment Geo Map
Public Research Reports
Education
Sentiment Indicators
Technical Indicators
Pricing
Company
About
In the News
Testimonials
Client Success Stories
Contact
Log inLoginSign up
< BACK TO ALL REPORTS

Buyers Enjoying A 2nd Gap Up Open

Jason Goepfert
2016-06-29
null

With another largish gap up this morning, we're seeing a type of buying interest from a sell-off that hasn't occurred since February, which, of course, ended up being a good sign.

Opening gaps are signs of emotional trading, and some of the most consistent edges we've discussed over the years occurred on days when there were large gaps, especially at price highs/lows or after big moves higher/lower. Typically, these are short-term edges though when extreme enough, it can spill over into the medium-term.

Let's take a look at how the S&P 500 futures (and SPY) have done after it dropped to a 3-month low, gapped up at least 0.5% then next morning, and then gapped up 0.5% gain (as it is on track to do this morning).

201606129_gap

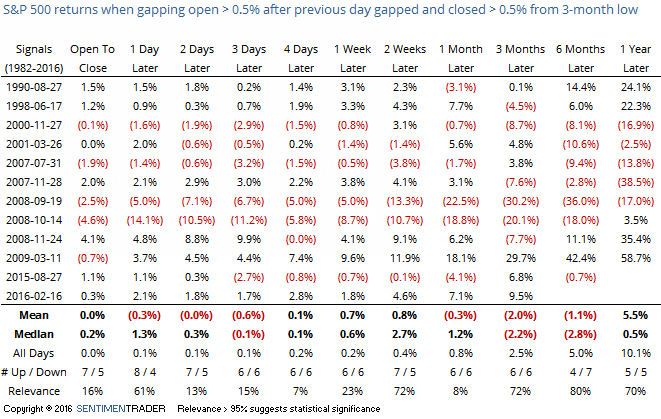
The sample size is relatively small but we're starting now to see that the bullish edge noted on Monday and Tuesday is starting to dissipate. By the time we got to the 2nd gap up, buying pressure was starting to show some exhaustion. The formerly consistent positive edge over 3-5 days was now flat.

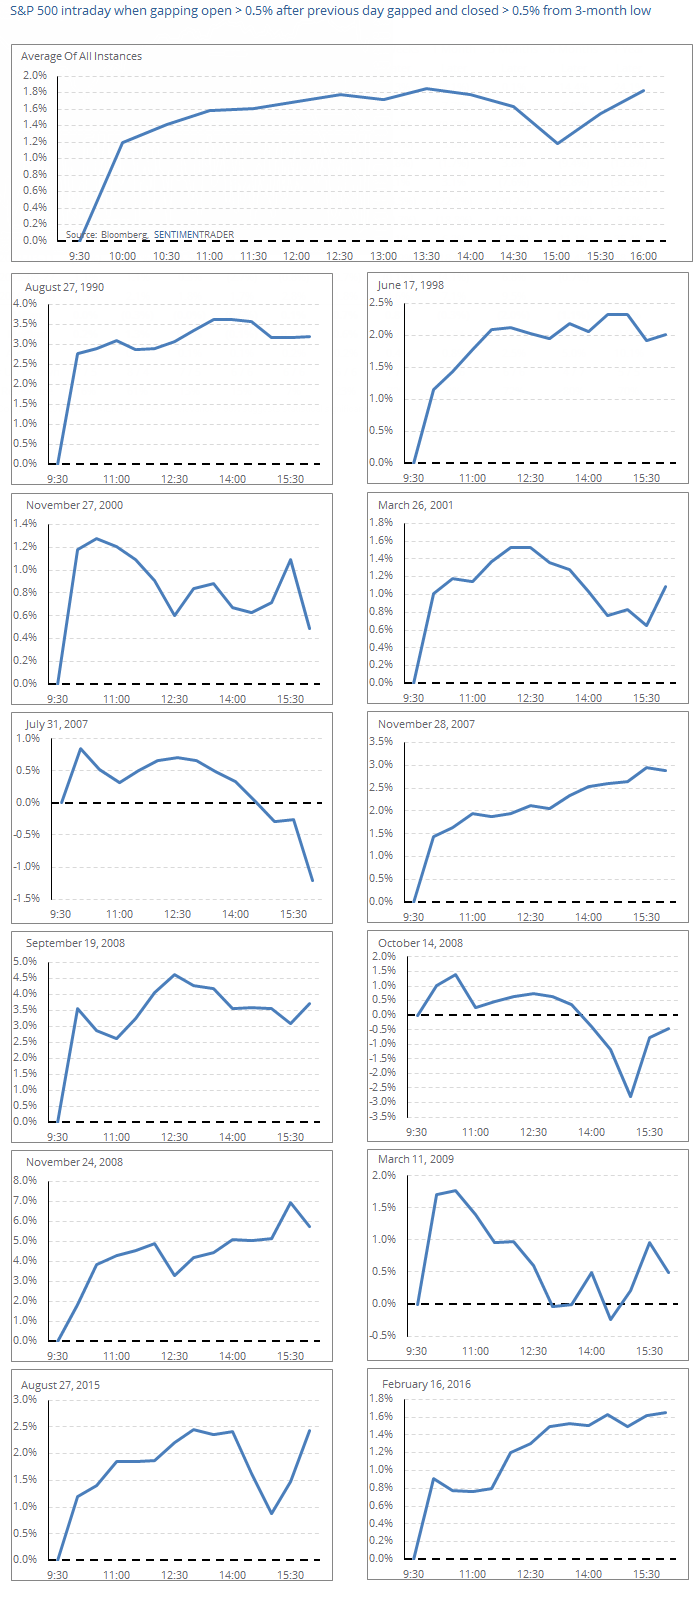
On Tuesday, stocks happened to follow the average intraday pattern almost exactly, so let's take a look at the same thing, except this is intraday performance on the day of the 2nd gap up open. Here we have typically seen a push higher into the afternoon but then fading performance.

201606129_gap_intraday

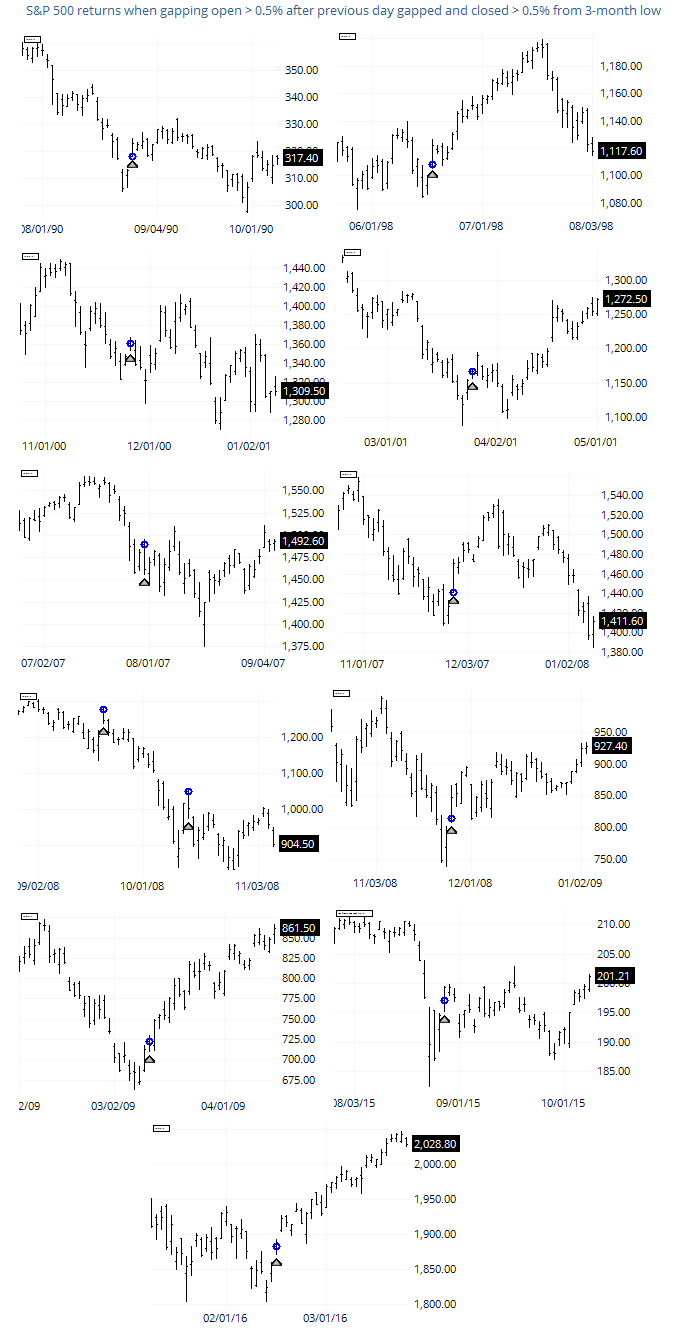
Zooming out a bit, here is how the S&P performed in the few weeks following the 2nd gap. The blue circles highlight the open of the day of the 2nd gap of 0.5% or more following a 3-month low. Three of them resulted in gap-and-go scenarios but generally we see some back-and-forth as the knee-jerk buying pressure subsides.

201606129_gap2


PRODUCTS
SentimenTrader
Trading Tools
Indicators & Data API
‍
Strategies & Scanner
‍
Research Reports
FREE
RESOUrCES
Simple Backtest
Calculator
Simple Seasonality
Calculator
The Kelly Criterion
Calculator
Sentiment Geo Map
‍
Public Research Reports
‍
Education
Sentiment Indicators
‍
Technical Indicators
‍
Pricing
Bundle pricing
‍
FAQ
‍
Announcements
‍
COMPANY
‍
About
‍
In the News
‍
Testimonials
‍
Client Success Stories
CONTACT
‍
General Inquiries
‍
Media Inquiries
‍
Financial Professionals Inquiries
‍
© 2026 Sundial Capital Research Inc. All rights reserved.
Setsail Marketing
TermsPrivacyAffiliate Program
Risk Disclosure: The information and tools provided are for research and analytical purposes only and are not intended as investment advice. Market analysis involves uncertainty, and outcomes may differ from expectations. Users should conduct their own due diligence and consider their individual circumstances before making any financial decisions. Past performance is not necessarily indicative of future results.

Hypothetical Performance Disclosure: Hypothetical performance results have many inherent limitations, some of which are described below. No representation is being made that any account will or is likely to achieve profits or losses similar to those shown; in fact, there are frequently sharp differences between hypothetical performance results and the actual results subsequently achieved by any particular trading program. One of the limitations of hypothetical performance results is that they are generally prepared with the benefit of hindsight. In addition, hypothetical trading does not involve financial risk, and no hypothetical trading record can completely account for the impact of financial risk of actual trading. for example, the ability to withstand losses or to adhere to a particular trading program in spite of trading losses are material points which can also adversely affect actual trading results. There are numerous other factors related to the markets in general or to the implementation of any specific trading program which cannot be fully accounted for in the preparation of hypothetical performance results and all which can adversely affect trading results.

Testimonial Disclosure: Testimonials appearing on this website may not be representative of other clients or customers and is not a guarantee of future performance or success.