
Buy the dip is dead

Key points:
- Through 63 trading days of the year, investors have shown a historic unwillingness to buy big dips in the S&P 500
- This behavior is not positive for forward returns, but seasonality plays a role
- When extreme unwillingness to buy the dip came at this time of year, it usually resulted in rallies
No interest in stepping into the fray
Almost exactly two years ago, investors bought the dip with both hands. As we saw at the time, that type of behavior has been a good sign for future returns and was once again.
Now, we're seeing the opposite. As The Wall Street Journal notes, investors have not been nearly as willing to step in after a big down day.
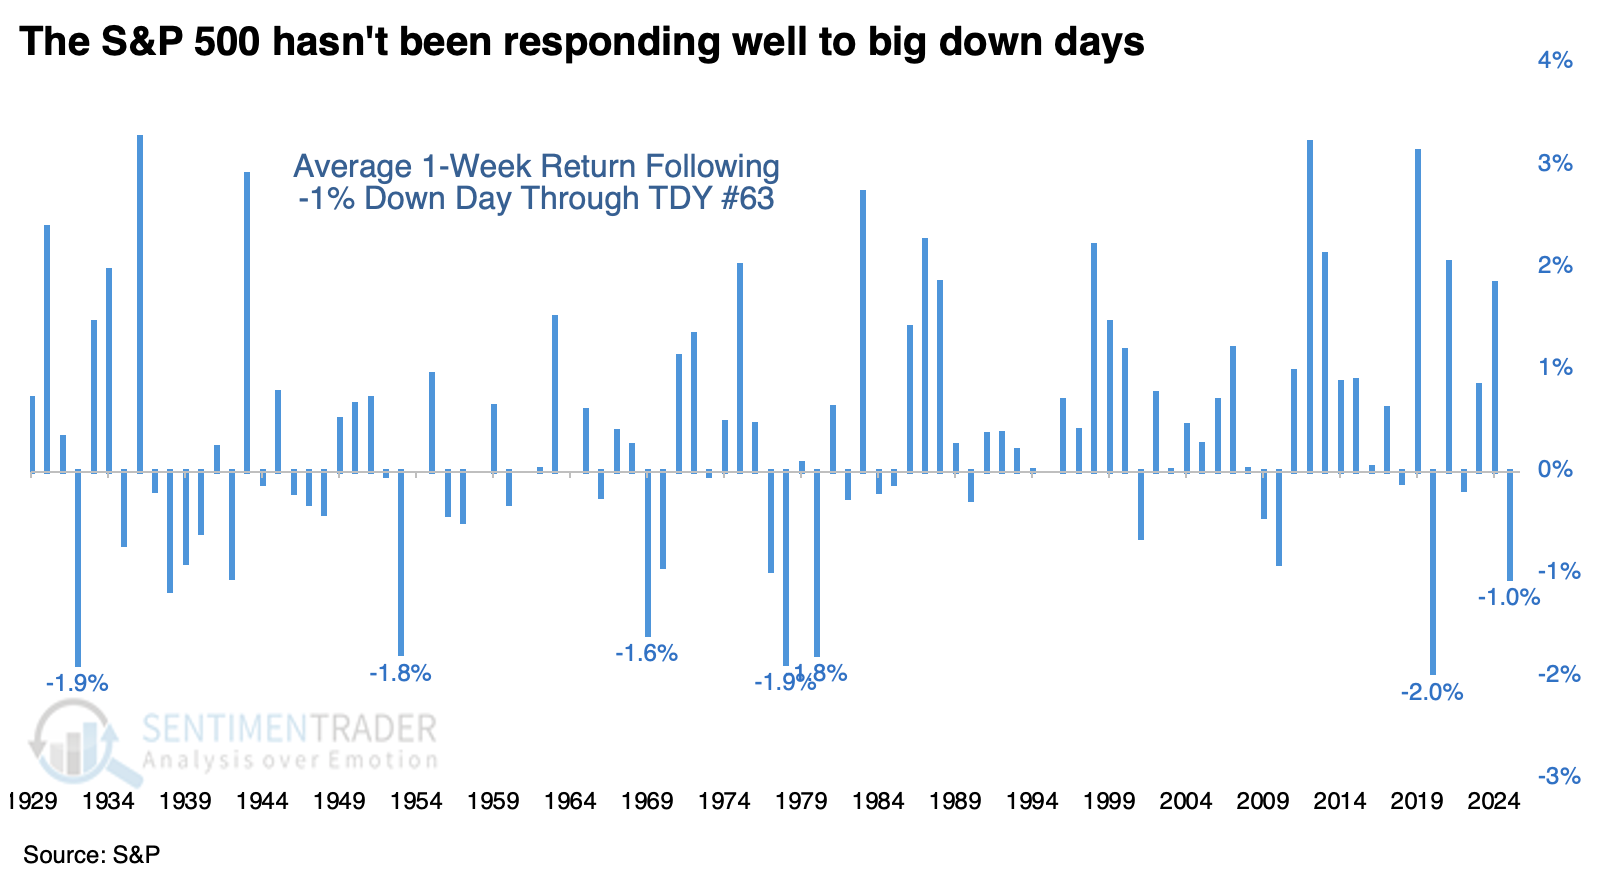
By one measure, it has been the worst year for the "buy the dip" strategy in almost a century. Investors who have stepped in to buy shares on sale have instead been stuck with bigger losses. The S&P 500 has dropped 1.3% on average this year in the week after a one-day loss of at least 1%, according to Dow Jones Market Data. That would be the biggest such decline on record, in data going back to the 1920s.
I have tried every measurement I know how to do, and cannot replicate the Journal's assertion. I get close with the year-to-date figures through early April, but it's significantly different from past years. Regardless, it's still clear that the lack of buying interest in the week following a -1% or larger daily decline is among the most egregious in nearly a hundred years.
A lack of buy-the-dip meets seasonality
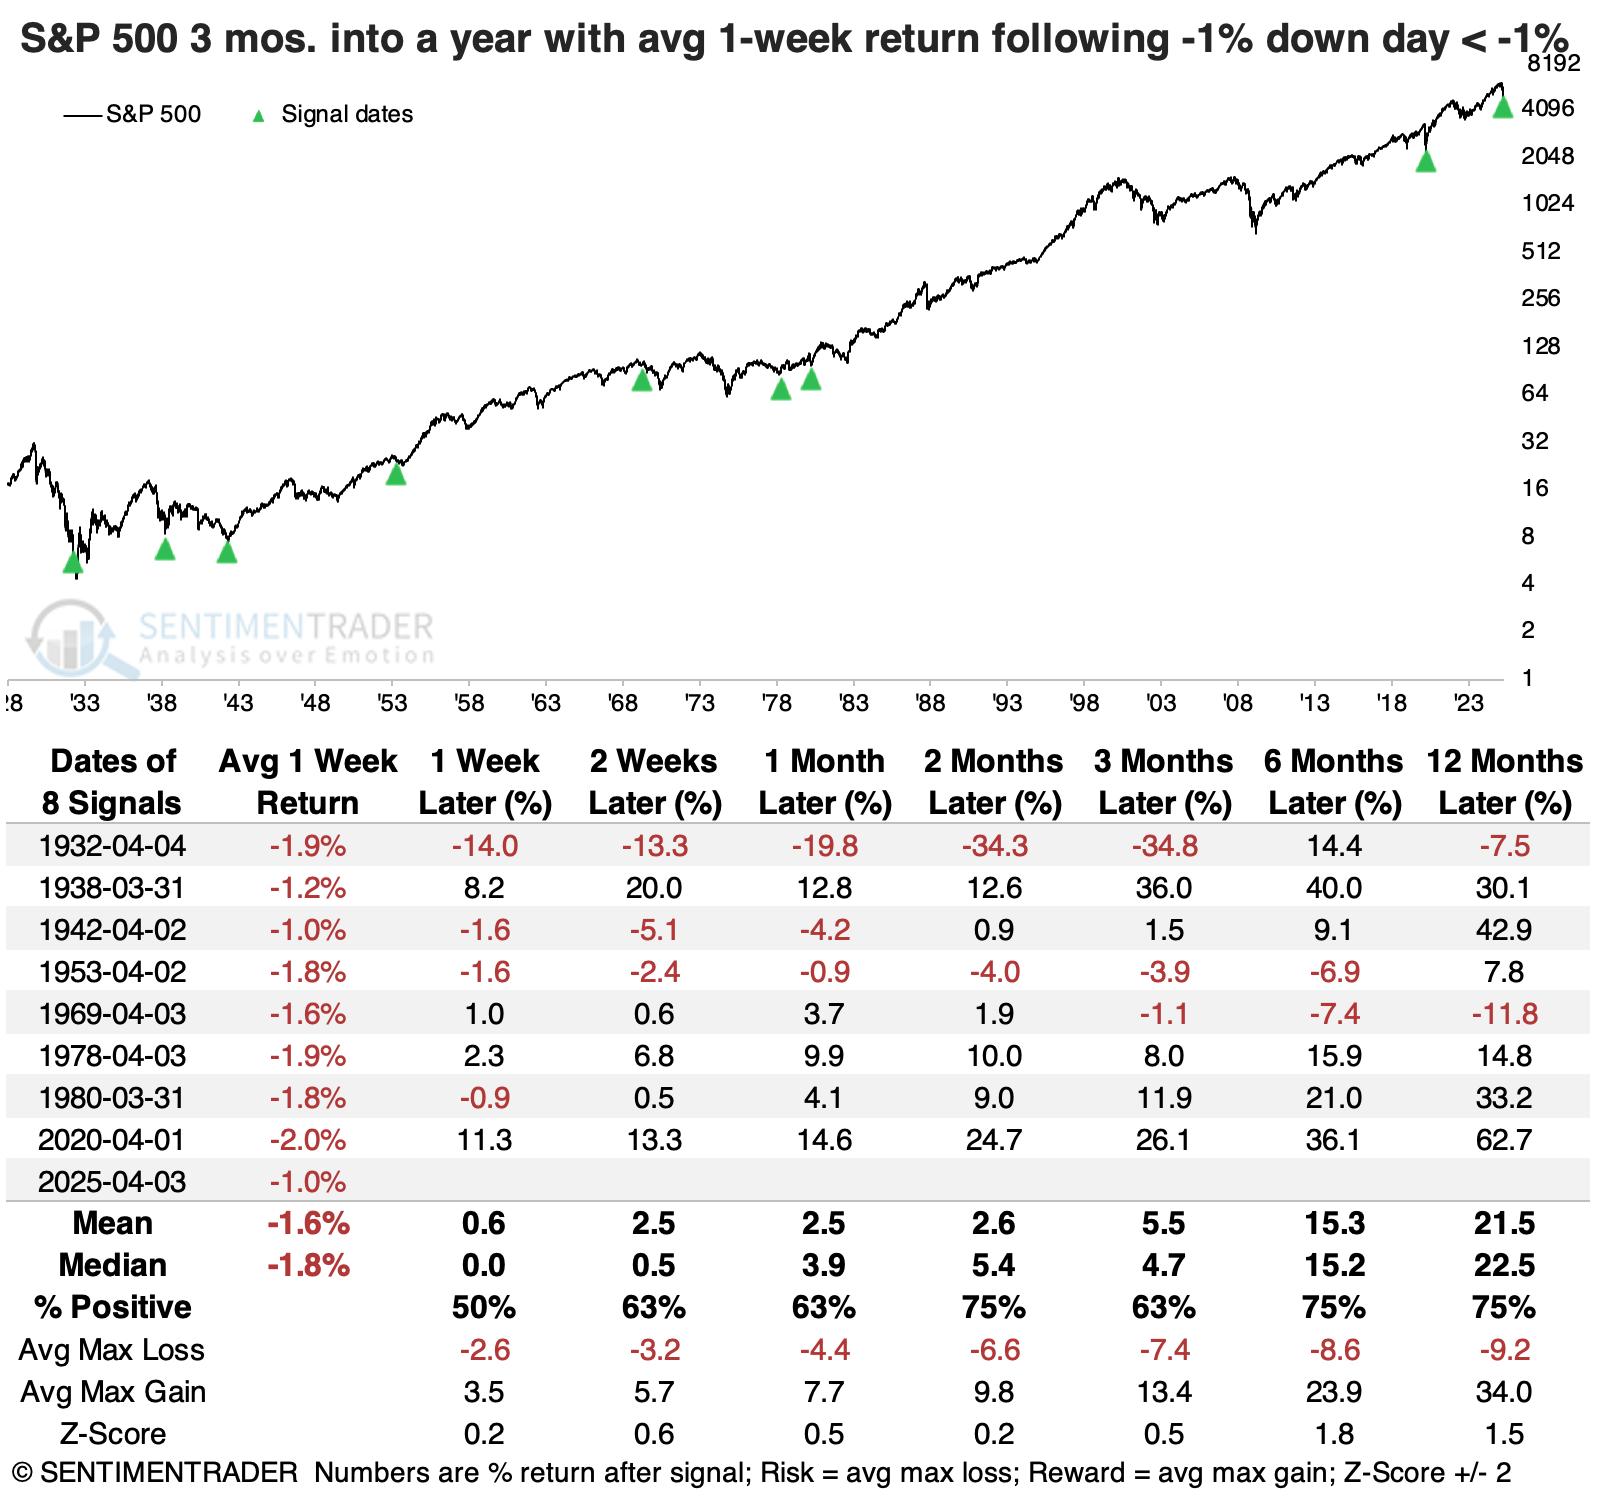
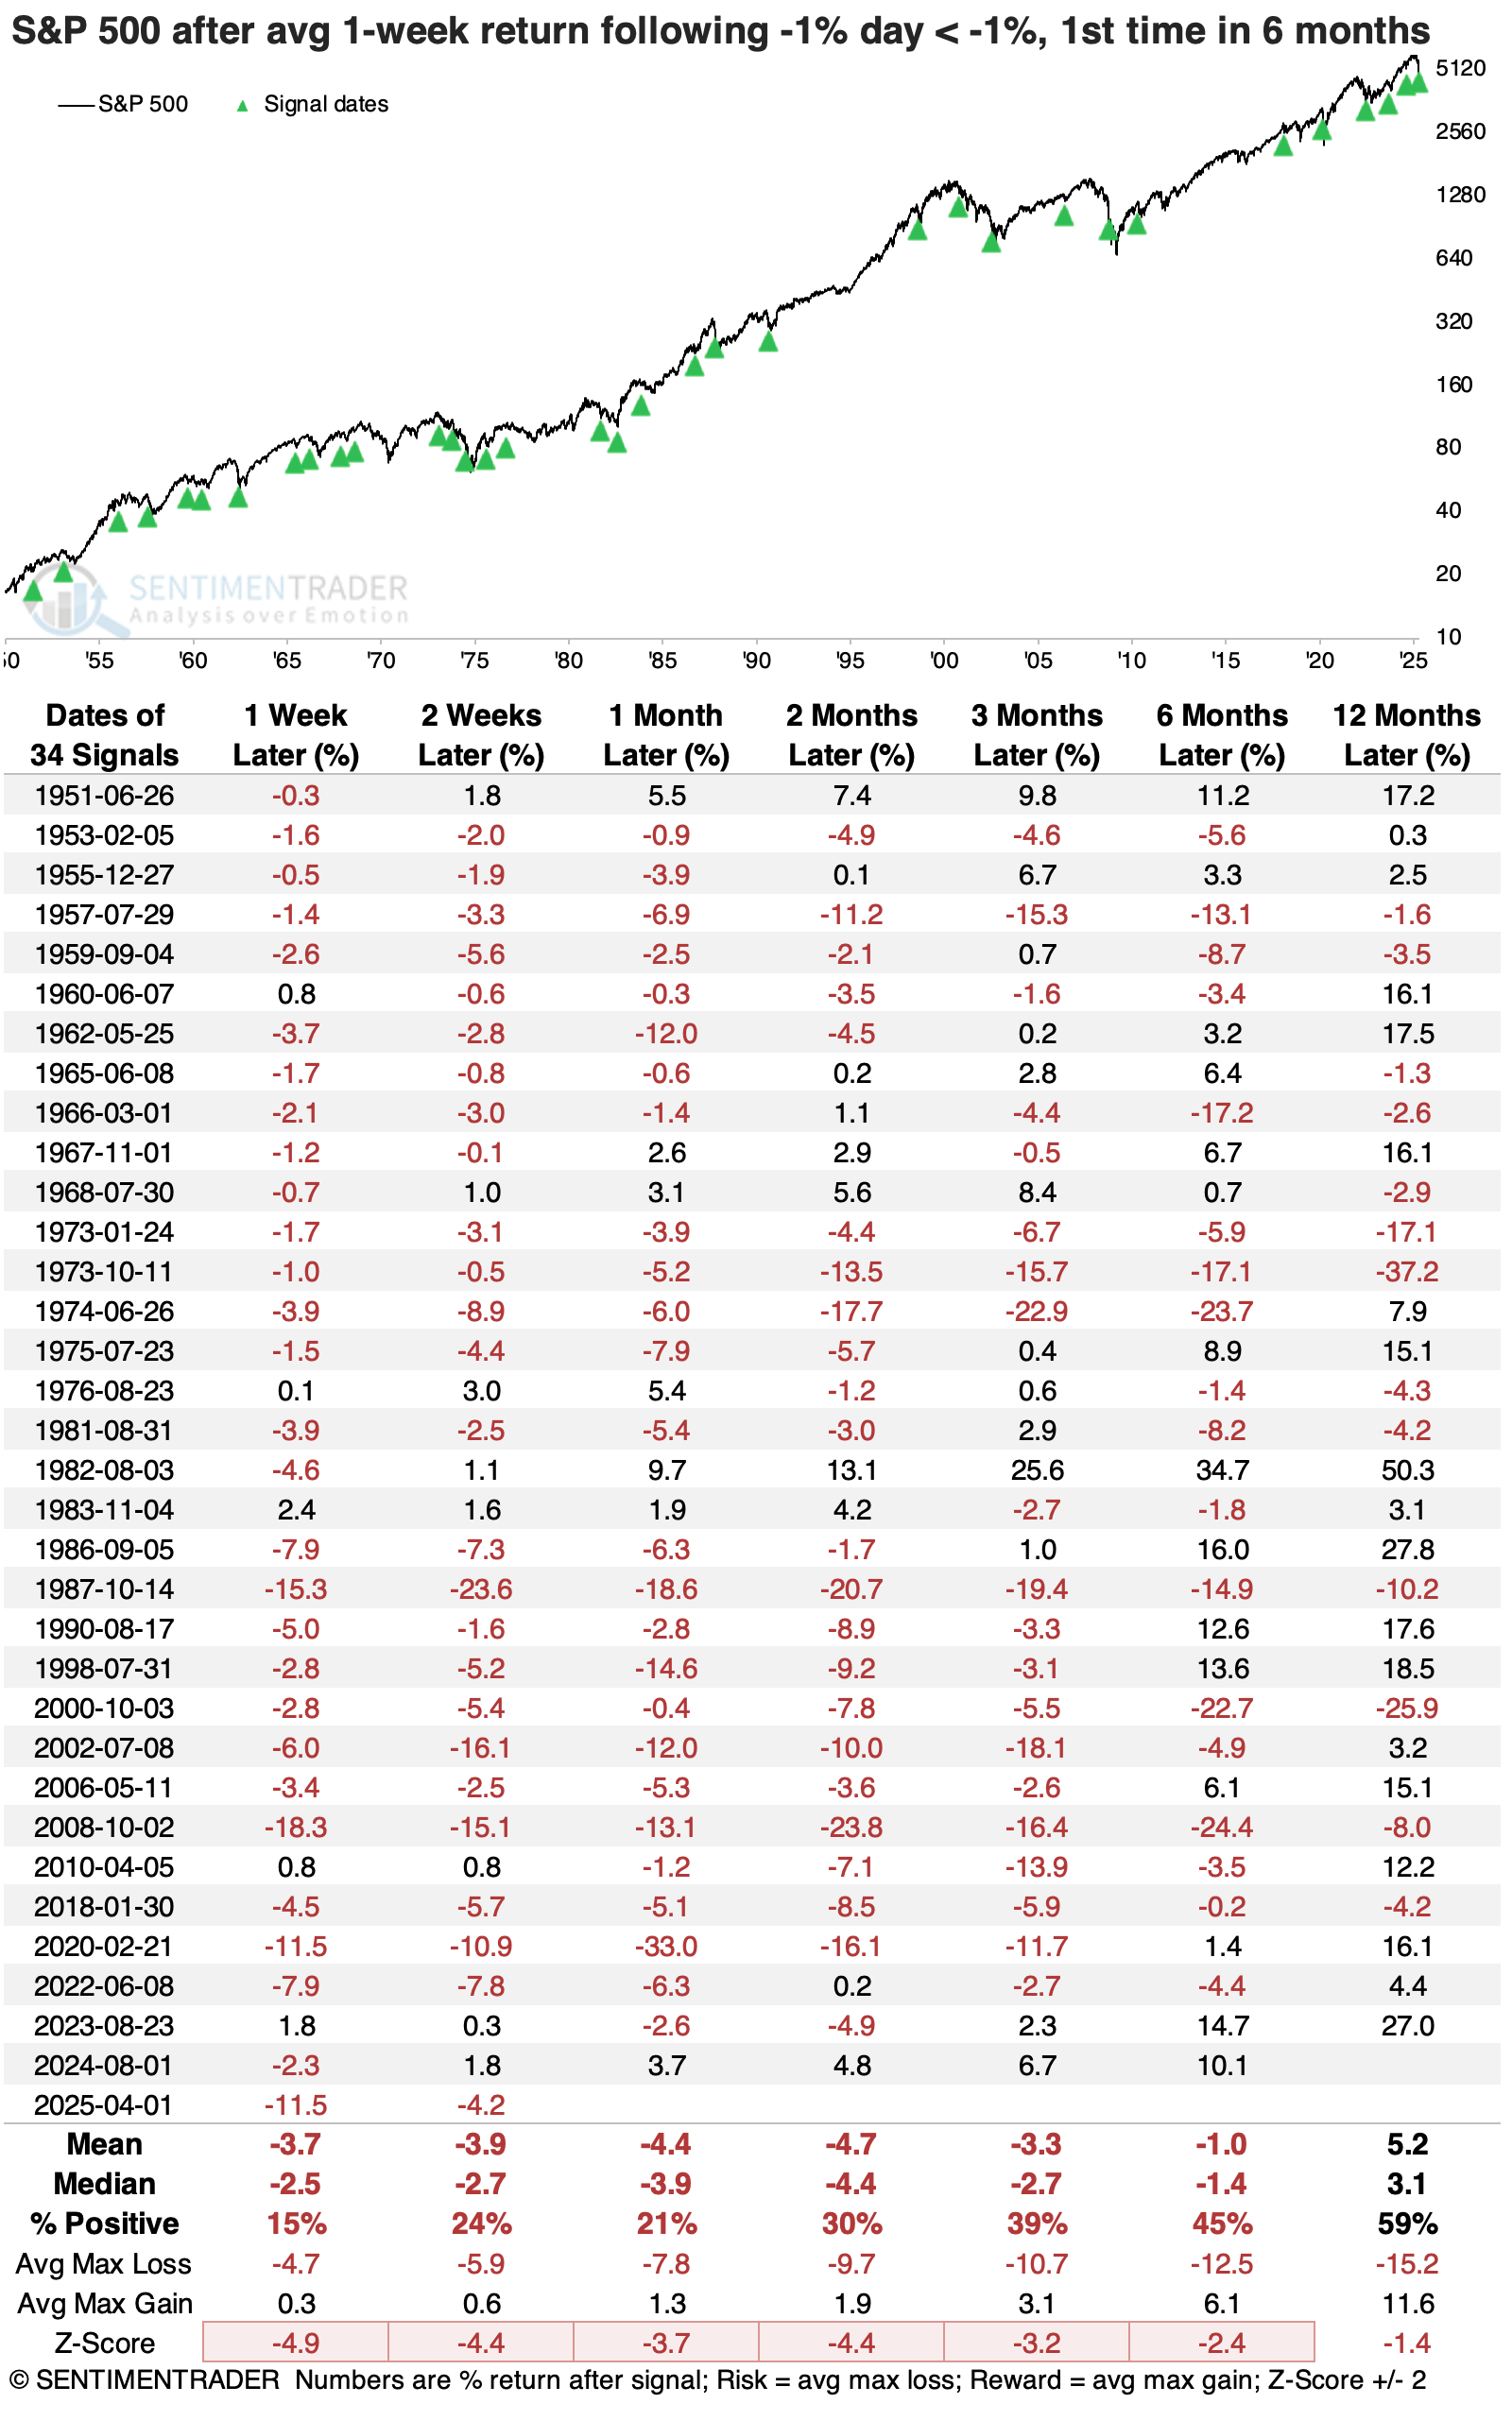
The table below shows how the S&P 500 performed following an average return of -1% or worse in the week following a -1% down day through the first three months (63 trading days) of a year.
The results weren't too bad overall. There was a woeful performance in 1932 when stocks crashed over the next couple of months, forming a long-term bottom. Other than that, the S&P tended to rebound quite well in the months ahead. There was only one additional loss two months later.
While the average drawdown was large enough to be uncomfortable, it was dwarfed by the average drawup (maximum gain). Over the following year, the max gain averaged +34% compared to an average drawdown of -9.2%. Six of the eight signals saw a gain larger than +10%, while only two suffered a loss larger than -10% at any point within the following year.
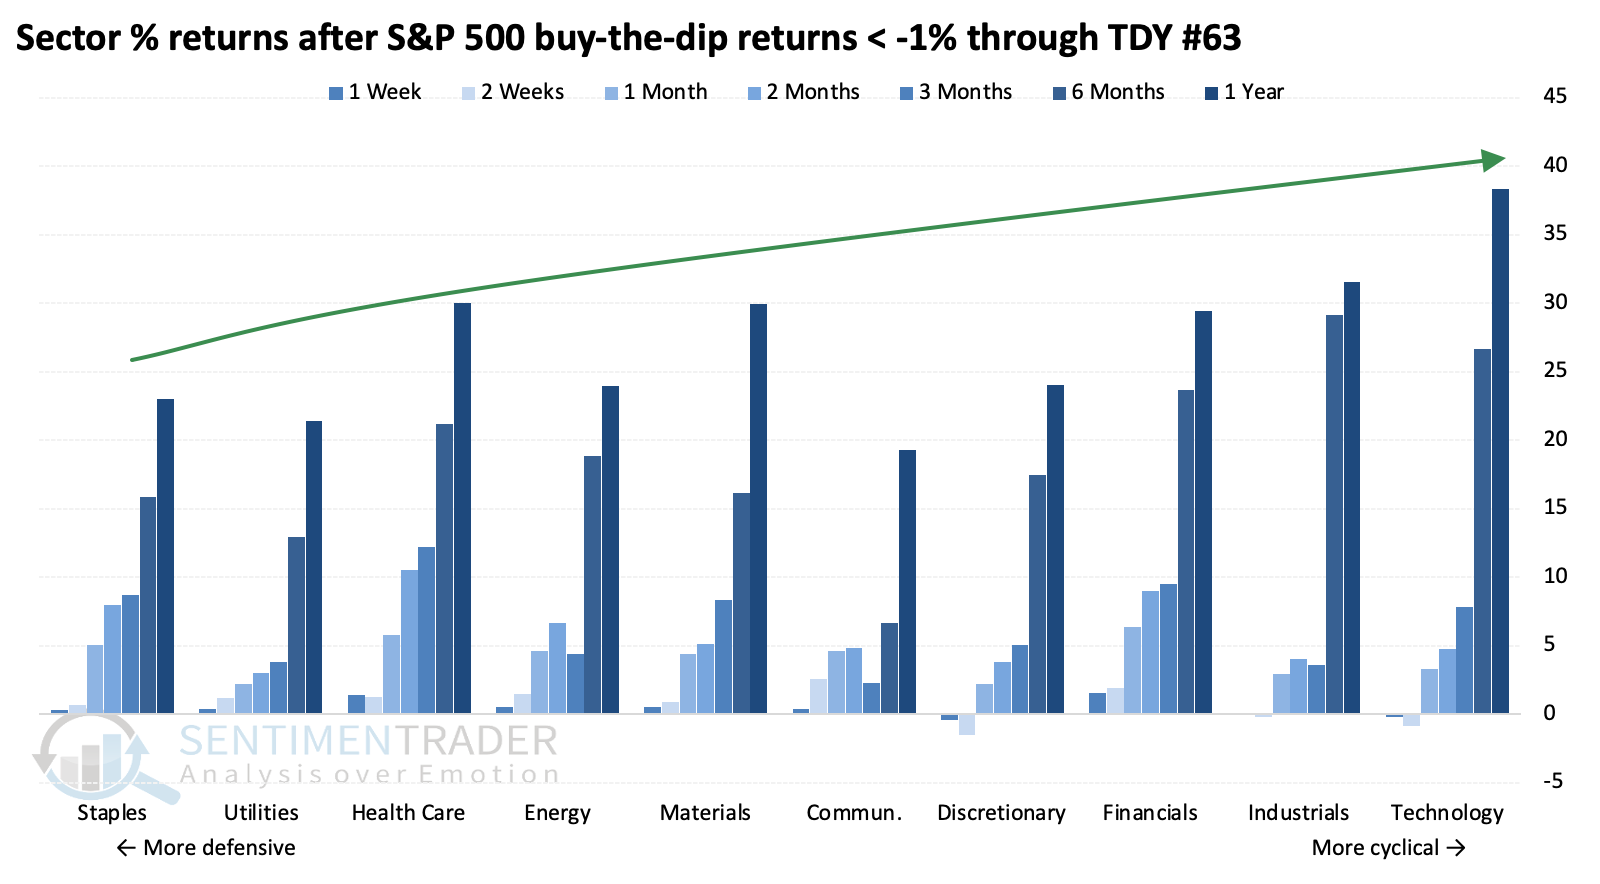
As we've noted since volatility spiked, we're now seeing studies that show better returns for cyclical sectors than defensive ones. This is a stark change from prior months.
After such poor buy-the-dip behavior through the first few months of a year, the more cyclical sectors showed significantly higher average returns across longer time frames than defensive sectors.
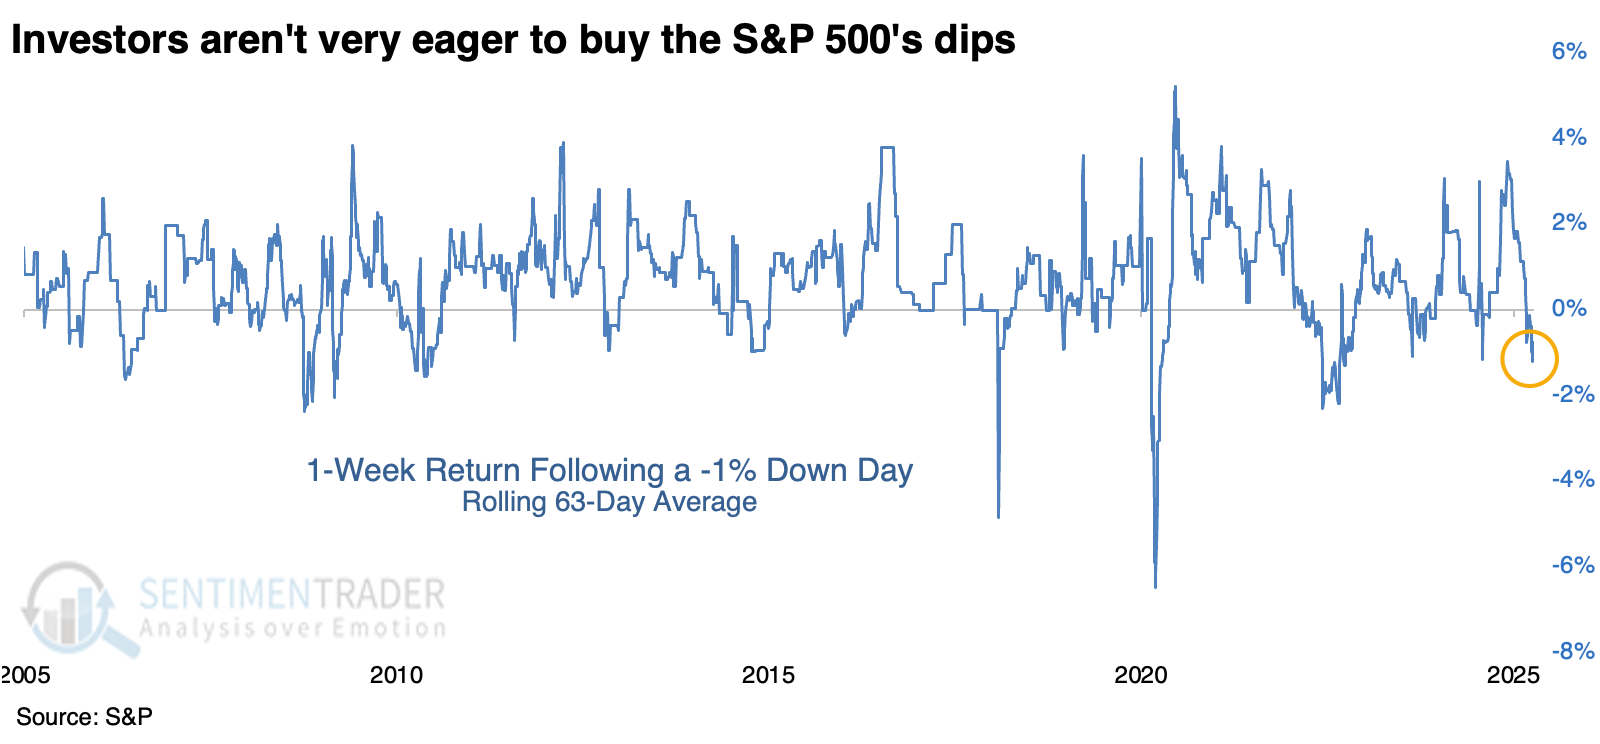
A rolling average is low but not as extreme
If we ignore where we are in the calendar and look at the rolling 63-day average of buy-the-dip behavior, we can see that the recent average below -1% is low but not all that unique.
When investors chose to sit out after big down days for the first time in six months, this was not a good sign. Definitely not. Returns across short- and medium-term time frames were atrocious.
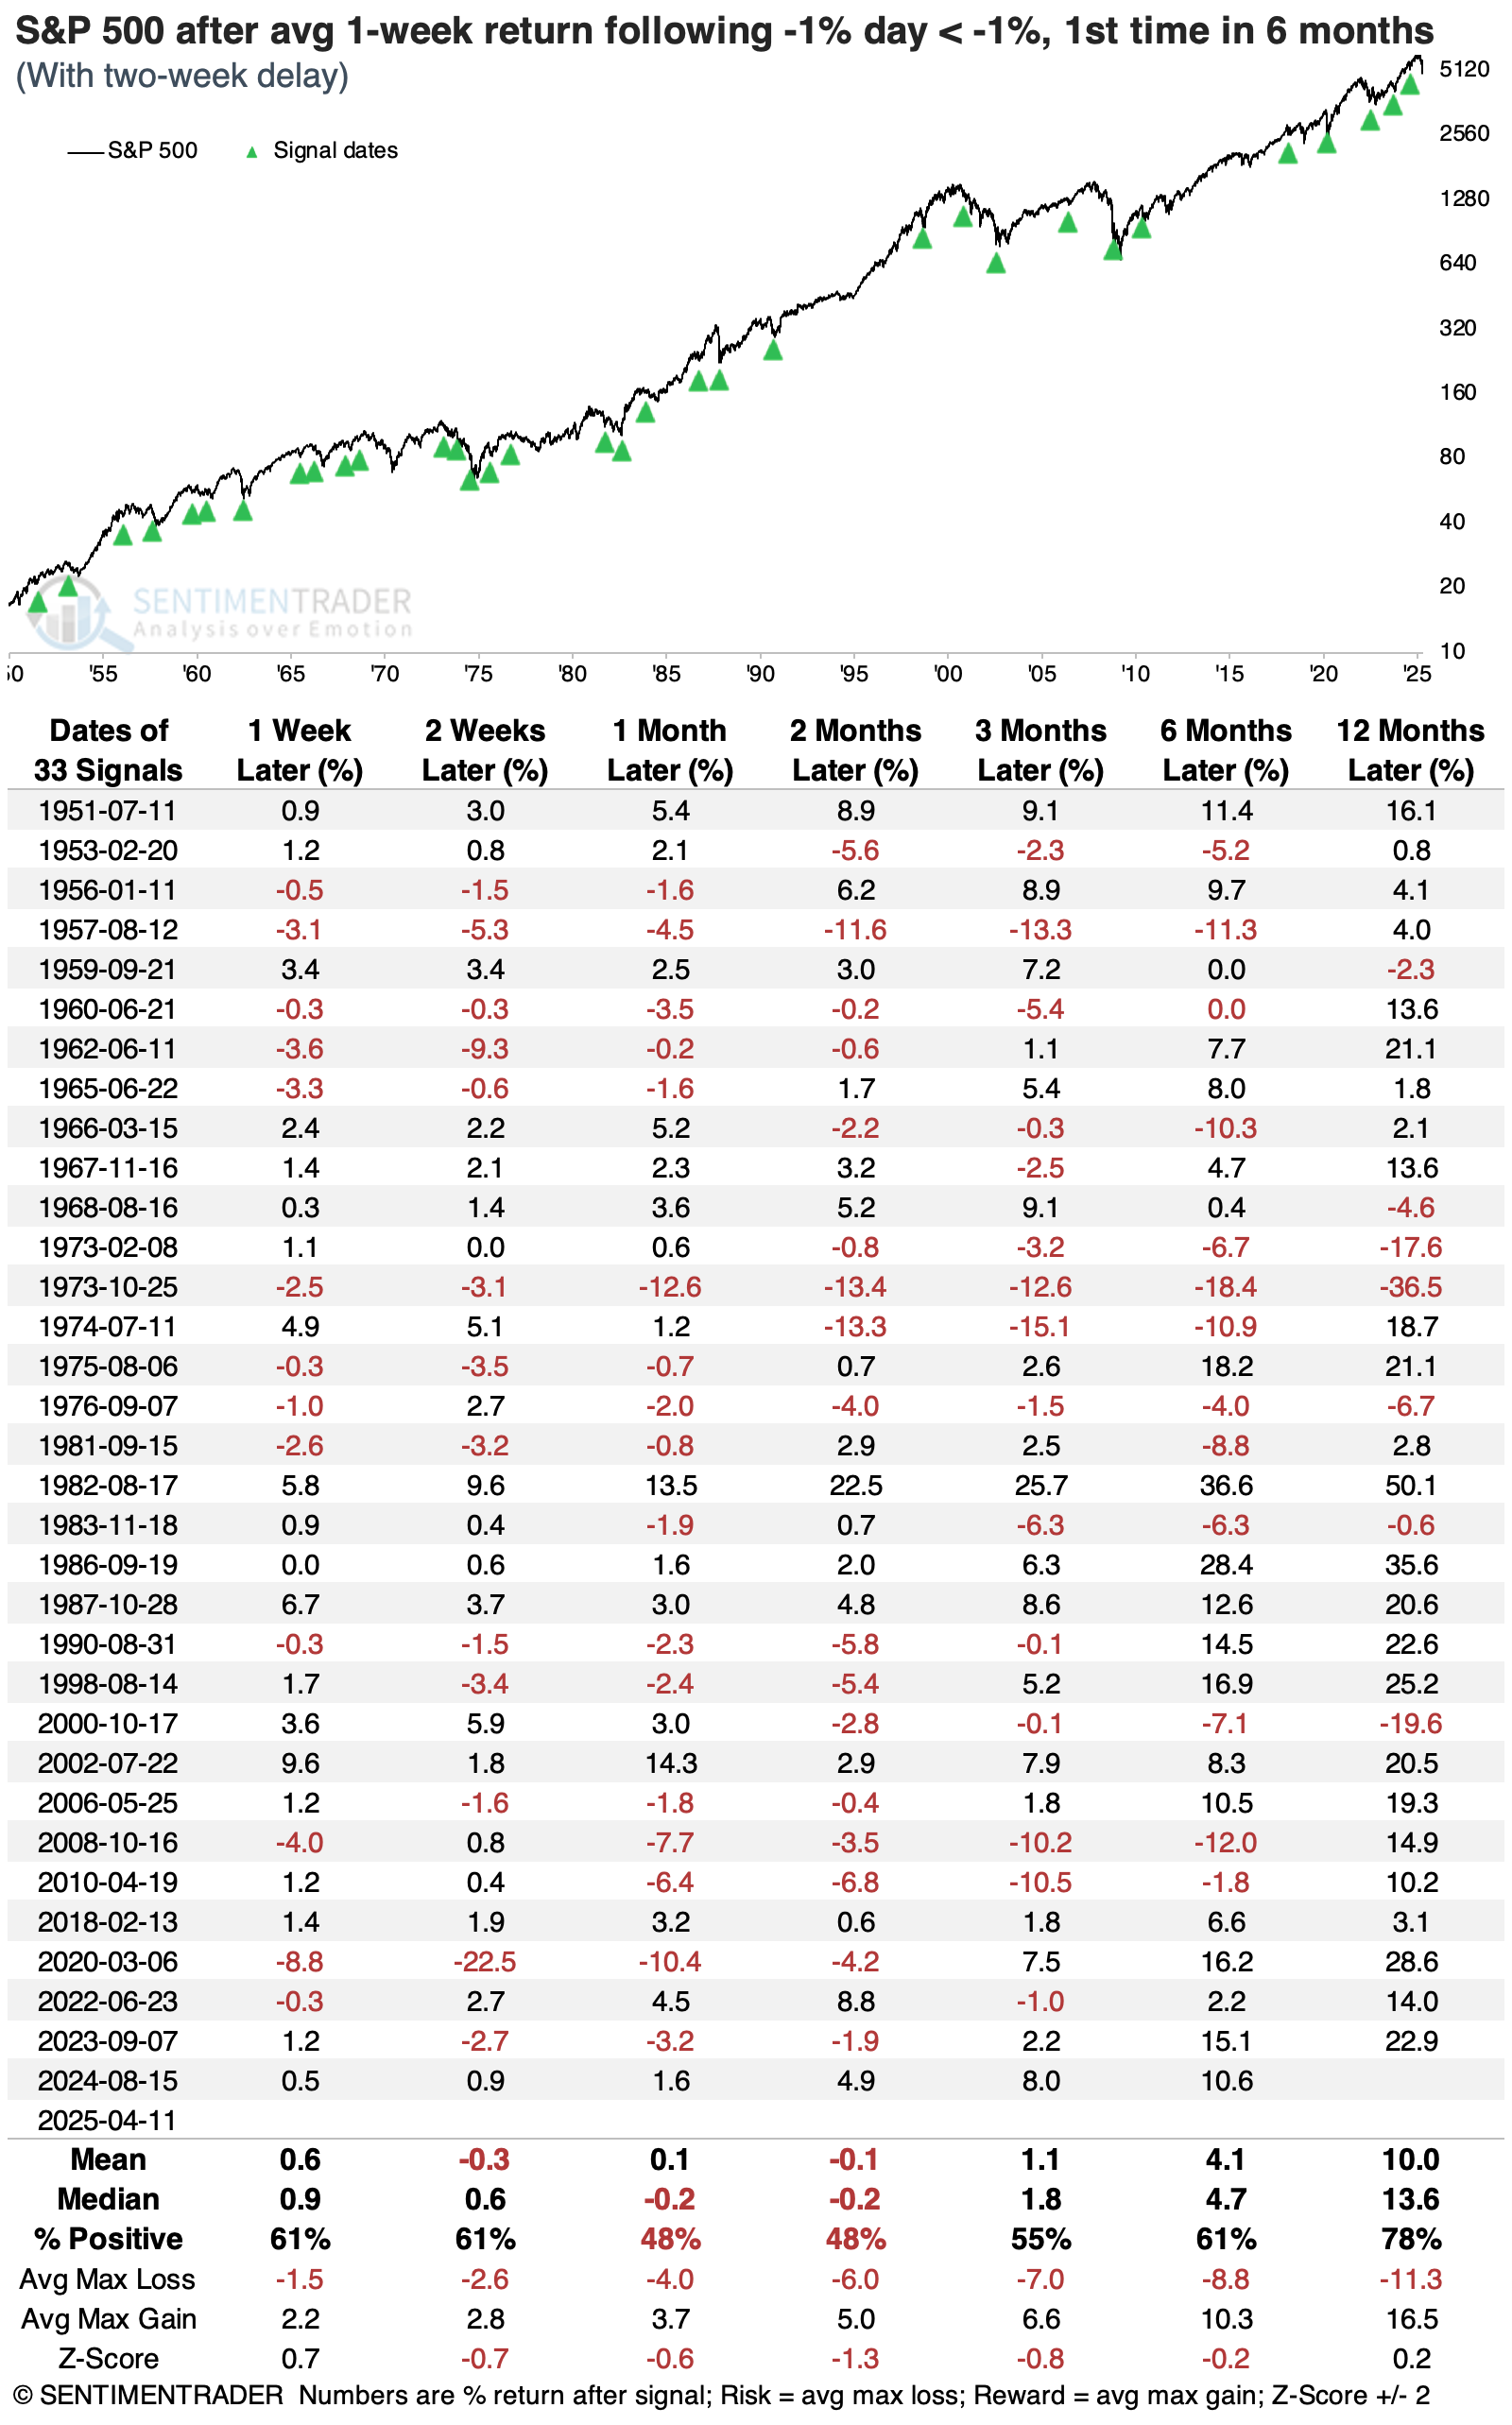
The good news, if there is any, is that the average dropped below -1% at the start of April, and it has now been two weeks since the signal triggered. And like most of the other signals, stocks suffered. Now, let's redo the table with a two-week delay. It's still not like this was a great sign, but returns were significantly improved, as a big chunk of the risk had already been delivered.
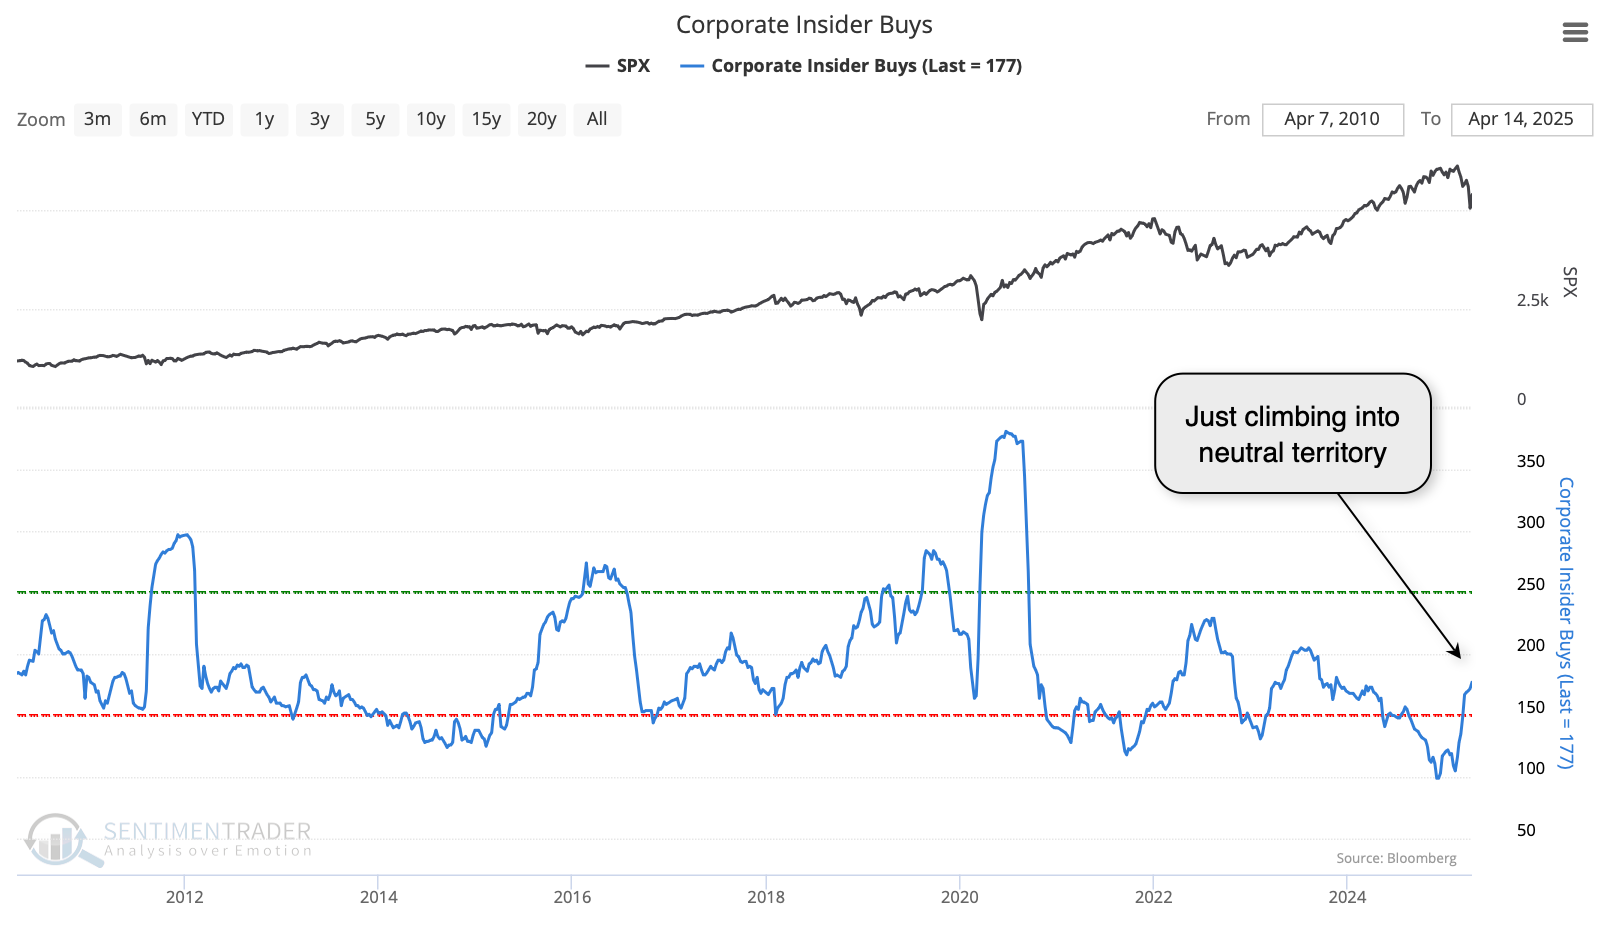
Ideally, when investors generally have no interest in buying the dip, we'd see some evidence that the smart money does. So far, there is some evidence that's the case, though it would be best if corporate insider buying among S&P 500 executives were more robust. As of the end of last week, it's just climbing into neutral territory from what had been a buying strike late last year.
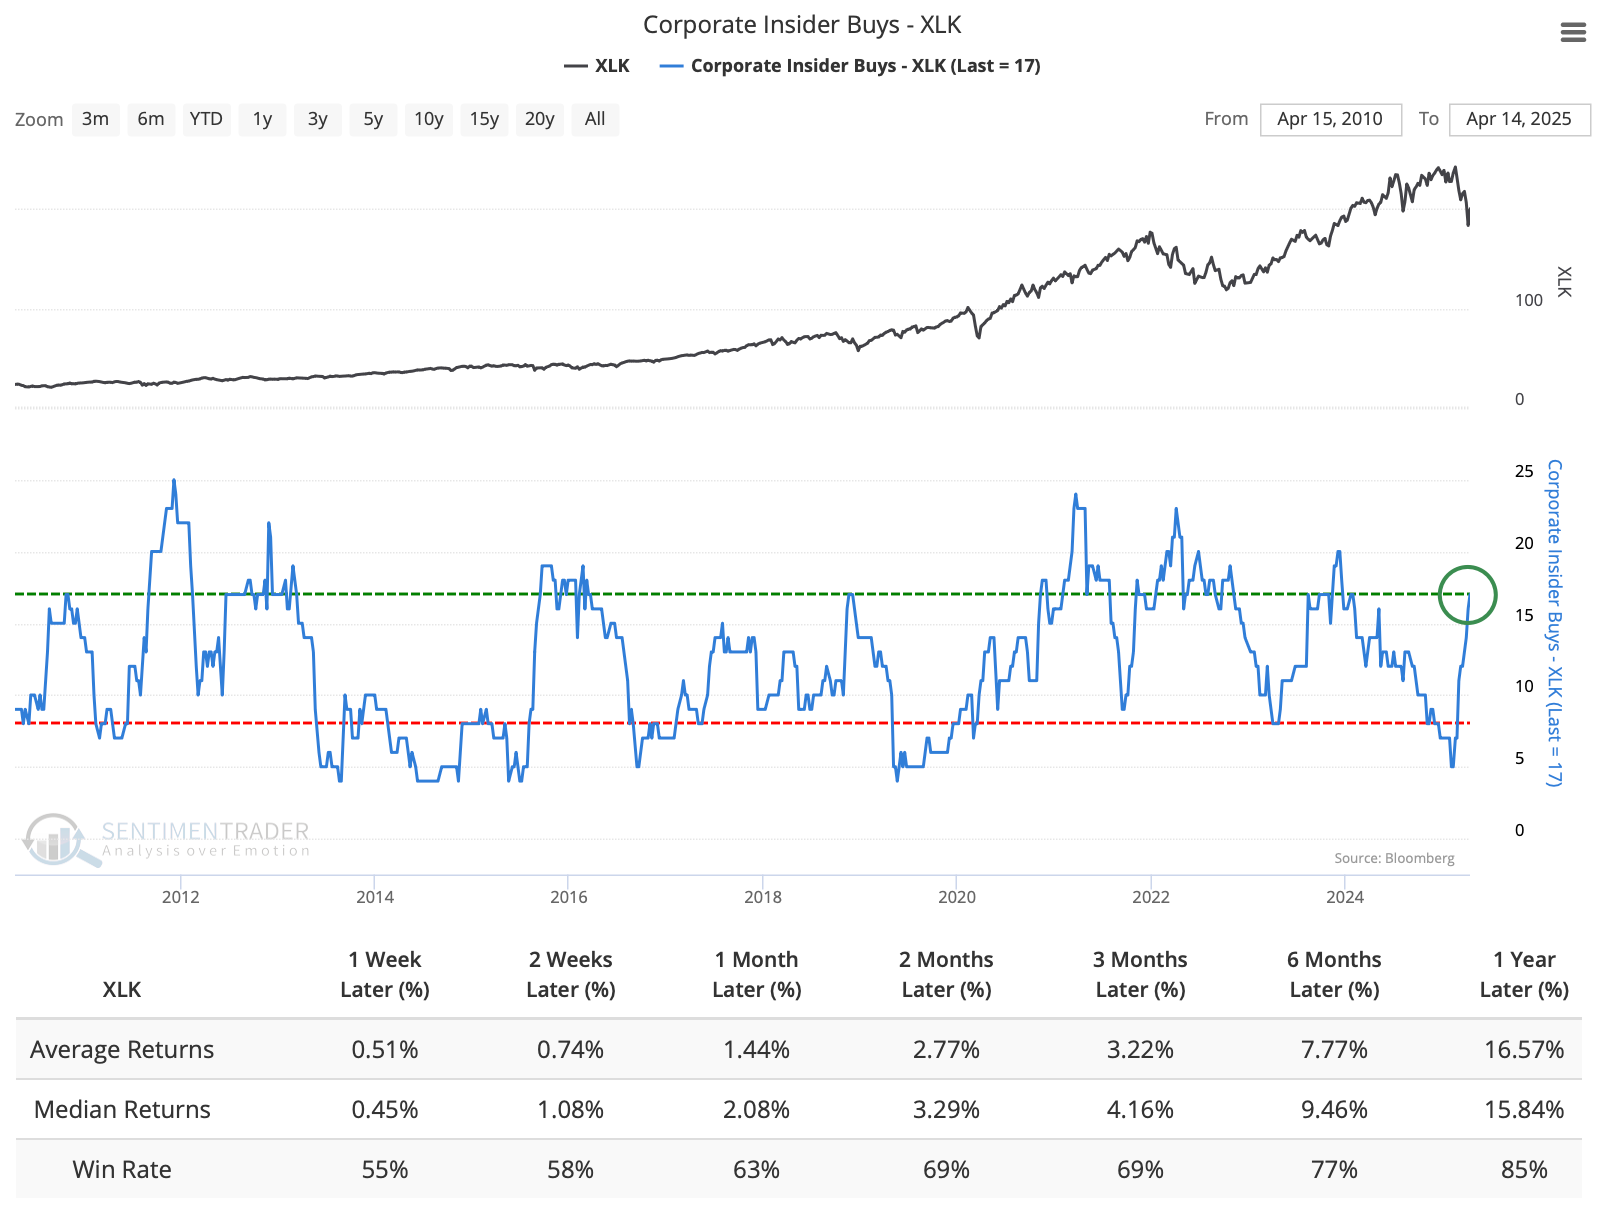
Buyers have been more active among technology companies. They were awfully early in 2022, so forward returns were good-not-great.
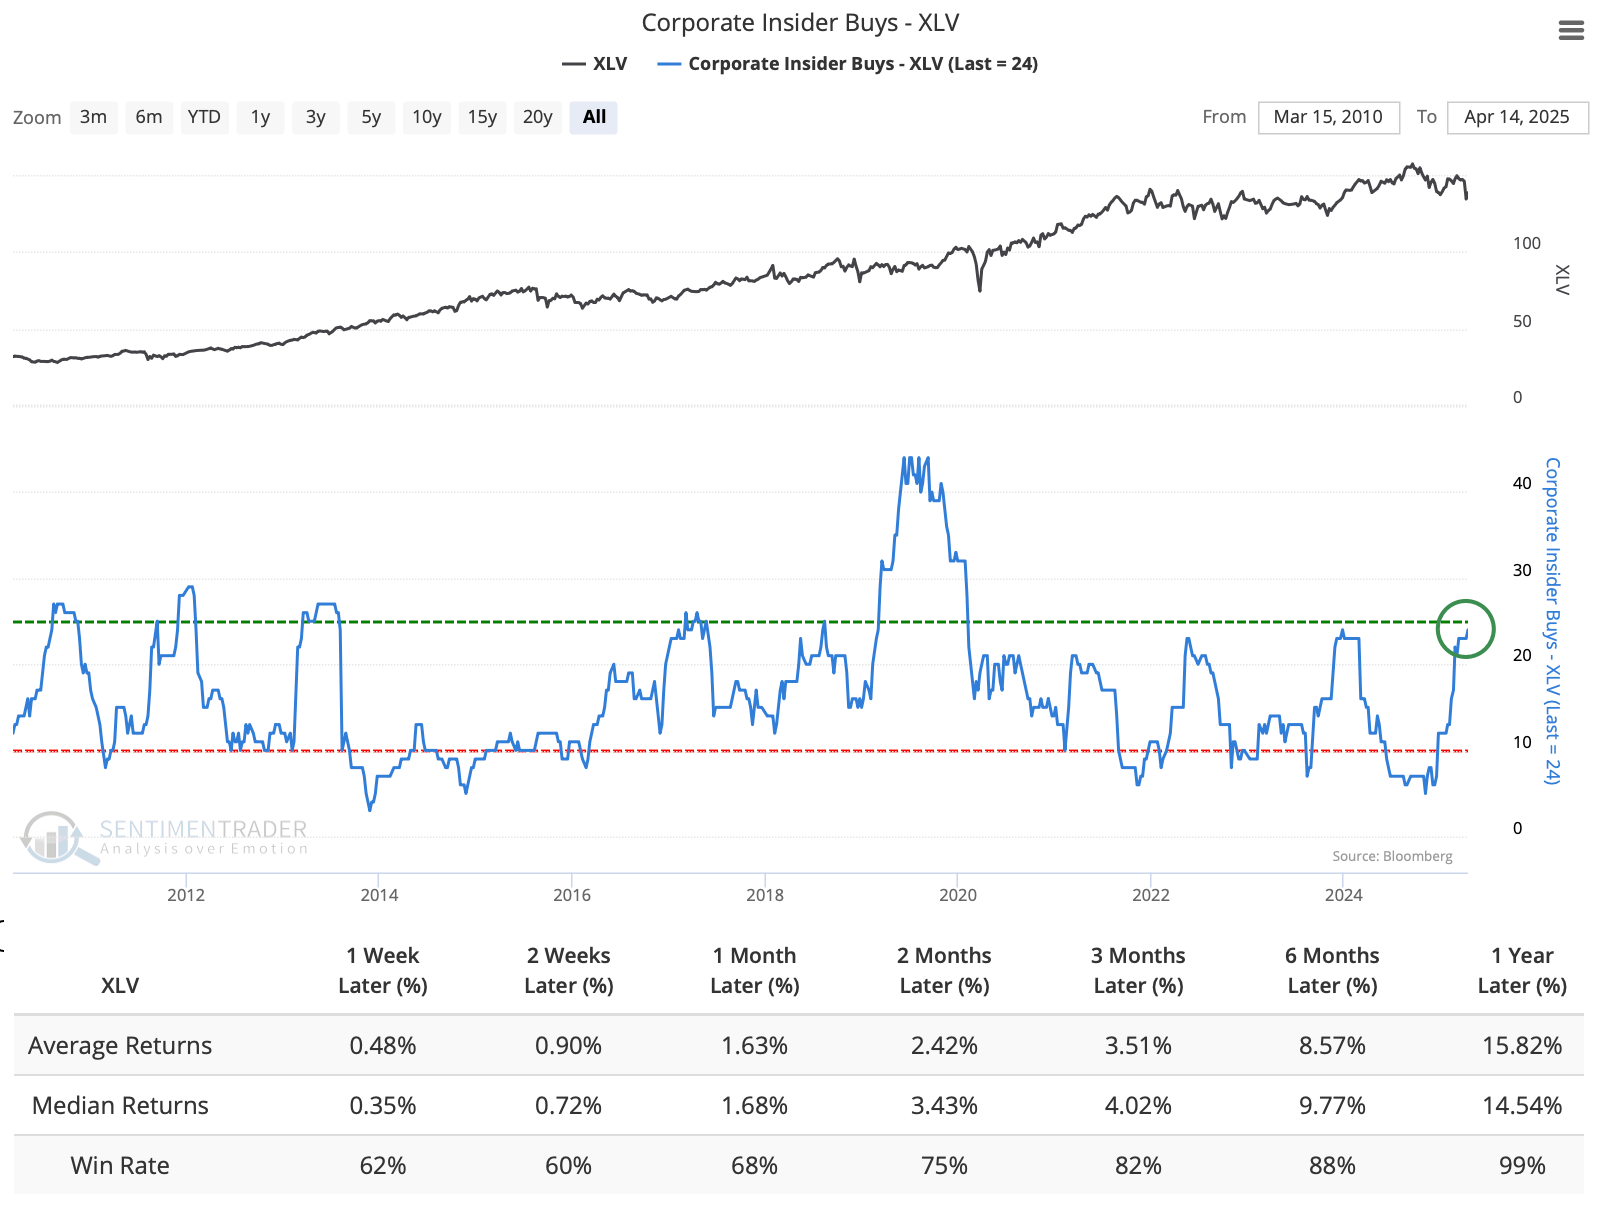
They've been significantly more active in health care relative to their history. This sector has had a good track record of responding favorably when insider buying reached the current level.
What the research tells us...
Bull markets need bulls. They are the ones who bid prices up and bring other investors off the sidelines. Risk-off behavior is not bullish. It can be temporarily when it is so extreme that it's contrarian, which was suggested by many indicators early last week.
But for this recovery to take hold, we need to see investors willing to put up with the daily geopolitical drama and policy whipsaws, and so far, there isn't enough evidence that's the case. The baseline for a volatility spike, as we saw over the past couple of weeks, is a multi-day to multi-week recovery, a decline to test the panic low as reality sets in, and then sustained buying interest that triggers a thrust. If that case repeats yet again, then we're still in the early (and risky) stages. A lack of buy-the-dip mentality isn't helping.