
Buy (after) the dip (ends)

Key points
- Buying into a market decline can be fruitful if the market soon reverses higher
- The catch is that not all dips are created equal (the risk of "catching the falling safe")
- Below, we highlight a simple approach to buying "after the dip (within an uptrend) has reversed"
Buying the dip - but not exactly
"Buy the dip" is a popular phrase that describes the act of buying into market weakness with the presumption that there will soon be an upside reversal. In this piece, we will look at a simple approach to a variation of this theme. While the approach is simple, the title is slightly longer-winded and not as catchy. I refer to it as "buying after the dip reverses back to the upside so long as it happens within a well-established uptrend." As I said, it's not as catchy. But buying the actual dip can be perilous, as one never knows how far the dip will go before it reverses.
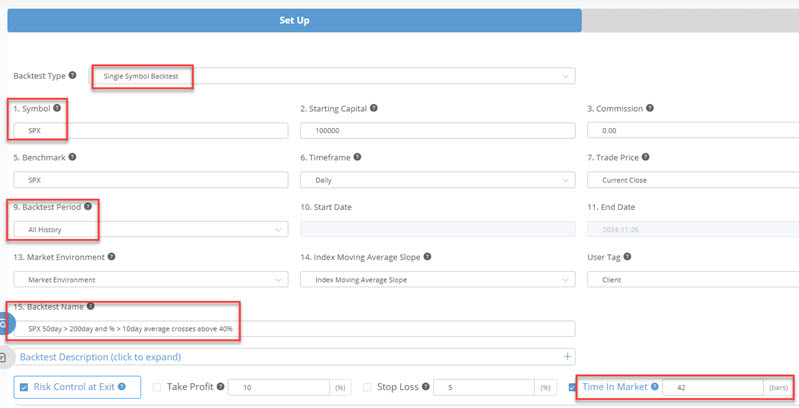
So, let's use our Backtest Engine 2.0 for a simple approach. Our first input screen appears below.
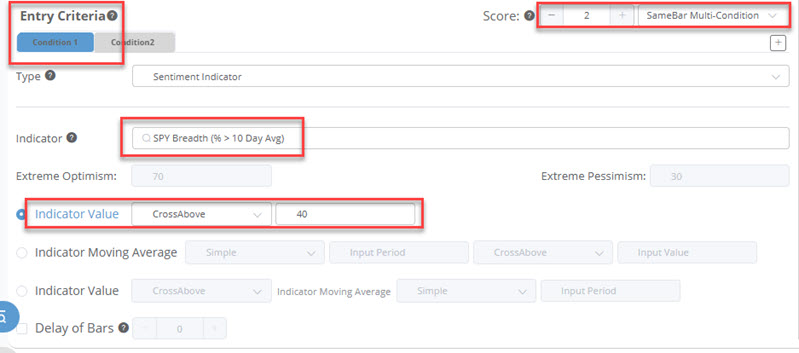
In the first entry criteria screen below, we set Condition 1. The indicator is the difference between the S&P 500's 50-day moving average and the 200-day moving average. Condition 1 requires that the 50-day average be above the 200-day average on the same day as Condition 2.
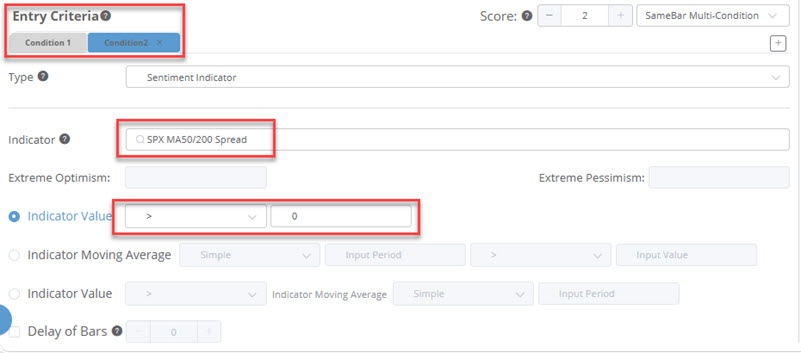
Condition 2 tells us that we are seeing an upside reversal within an ongoing uptrend. In the second entry criteria screen below, we set Condition 2. The indicator is the percentage of S&P 500 stocks above their 10-day moving average, and we look for a cross above 40%. For it to cross above 40%, it must first drop below 40%-that's "the dip." The cross above 40% indicates the "upside reversal after the dip."
We will use a two-month holding period (42 trading days) for testing.
The results
The chart below highlights all entry and exit signals generated using simple trading rules since 1998. The most recent signal occurred on 2024-11-21.
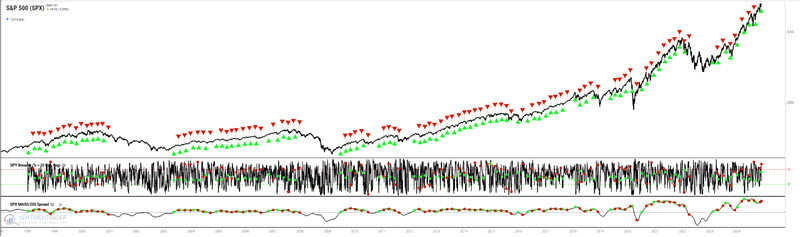
Note that these signals tend to fire regularly during periods of rising prices and not at all in a strong bear market. This is precisely what we want it to do - highlight potential buying/trading opportunities within a rising trend and stand aside during a declining trend.
The table below summarizes results on a signal-by-signal basis. Two-month returns are highlighted.
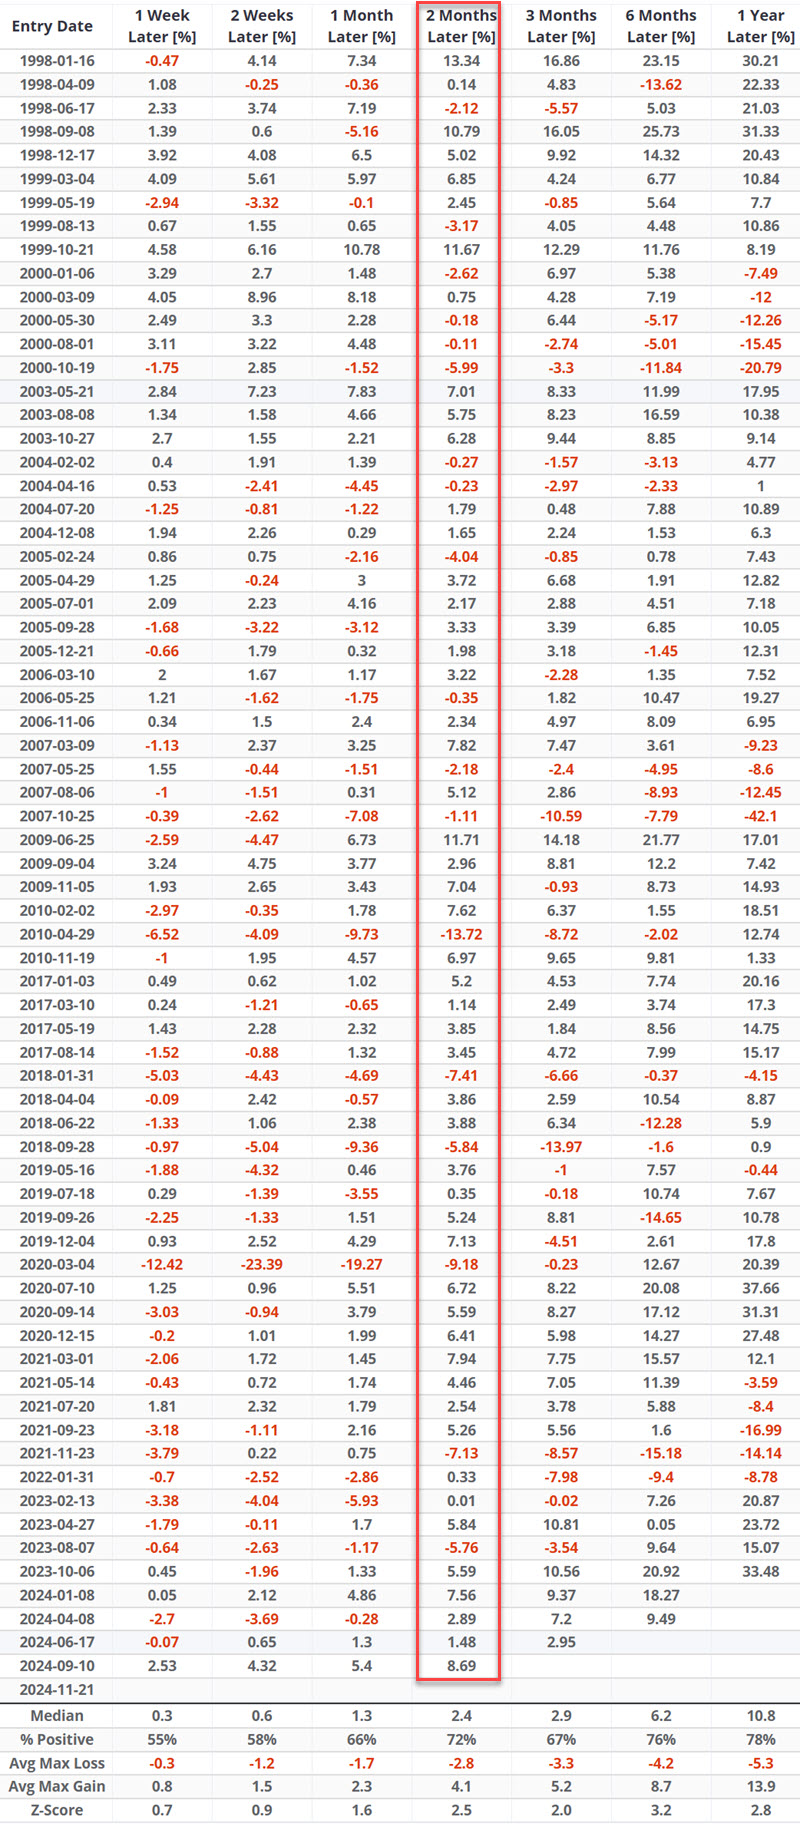
Note a 72% win rate for a two-month holding period. Note also that there was only one loser of more than -10% (-13.72 in 2010).
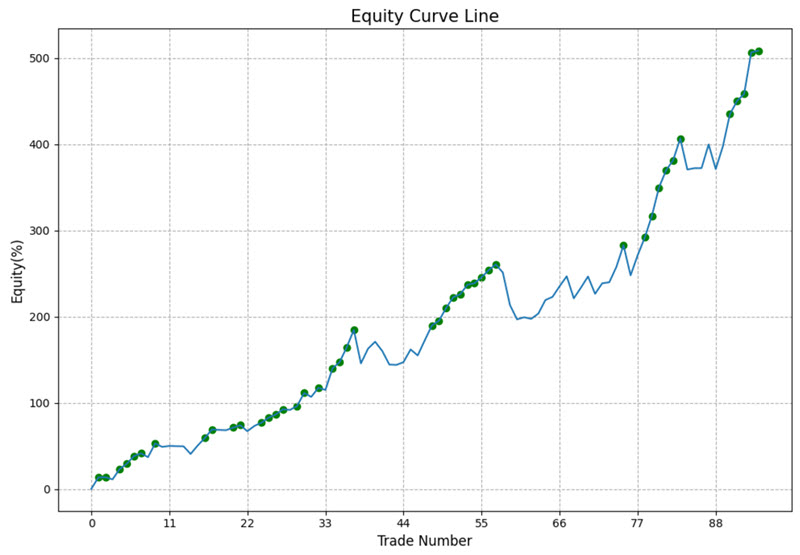
The chart below displays the cumulative equity curve for the signals above. The critical thing to note is the "lower left to upper right nature of the results." This is the type of consistency one looks for, as it helps to instill enough confidence to continue acting upon each new signal.
What the research tells us…
The abovementioned strategy is not presented as a "be all, end all" mechanical approach to trading. It is intended to highlight a) the potential benefits of employing a variation of the "buy the dip approach" and b) an example using our Backtest Engine 2.0.