Products
SentimenTrader Trading Tools
‍
Backtest Engine
My Trading Toolkit
Correlation Analysis
Seasonality
Market Prediction
Indicators & Data API
‍
Proprietary Indicators & Charts
Market Data API
Strategies & Scanner
‍
50+ Trading Strategies
Smart Stock Scanner
Smart Option Scanner
Research Reports
‍
Research Solutions
Reports Library
Free Resources
Simple Backtest Calculator
Simple Seasonality Calculator
The Kelly Criterion Calculator
Sentiment Geo Map
Public Research Reports
Education
Sentiment Indicators
Technical Indicators
Pricing
Company
About
In the News
Testimonials
Client Success Stories
Contact
Log inLoginSign up
< BACK TO ALL REPORTS

Burst Of New Highs As Optimism Hits 30-Year High

Jason Goepfert
2018-01-18
null

This is an abridged version of our Daily Report.

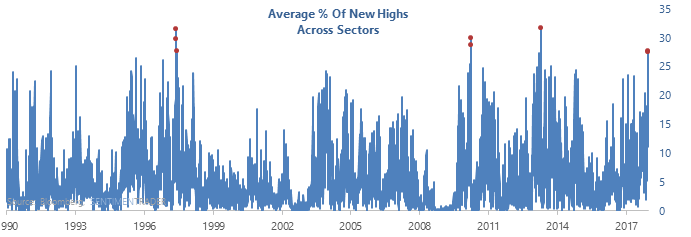
A rare burst of new highs

Most of the major indexes and sectors had more than 25% of their stocks hit a 52-week high on Tuesday. Only Staples and Utilities saw fewer than 10% of their stocks hit a new high. On average across indexes and sectors, 27% of stocks reached a fresh high, among the best average readings since 1990.

Similar surges led to poor short-term returns, and excellent long-term ones.

Where da bears at?

The Investor’s Intelligence survey of newsletter showed the fewest bears in 30 years this week. Prior to 1987, the survey was more volatile, and there were more than 50 weeks with fewer bears. Those weeks led to poor returns in the S&P 500, while sectors like Utilities and Energy held up very well.

Reversing the reversal

The S&P 500 futures completely reversed its negative reversal from Tuesday. This is adding a rarity on top of a rarity, and future returns were mixed, at least until 3 months later when they were good.

Upside volatility

While the VIX is often referred to as the “fear gauge”, it simply measures how options traders are pricing moves over the next 30 days. It almost always increases as stocks decline as options traders bid up the price of put options. But in rare cases, the VIX can rise along with stocks for the same reason.

For access to the full report, indicators, charts, screens, and Backtest Engine, log in or sign up for a free 30-day trial today.

PRODUCTS
SentimenTrader
Trading Tools
Indicators & Data API
‍
Strategies & Scanner
‍
Research Reports
FREE
RESOUrCES
Simple Backtest
Calculator
Simple Seasonality
Calculator
The Kelly Criterion
Calculator
Sentiment Geo Map
‍
Public Research Reports
‍
Education
Sentiment Indicators
‍
Technical Indicators
‍
Pricing
Bundle pricing
‍
FAQ
‍
Announcements
‍
COMPANY
‍
About
‍
In the News
‍
Testimonials
‍
Client Success Stories
CONTACT
‍
General Inquiries
‍
Media Inquiries
‍
Financial Professionals Inquiries
‍
© 2026 Sundial Capital Research Inc. All rights reserved.
Setsail Marketing
TermsPrivacyAffiliate Program
Risk Disclosure: The information and tools provided are for research and analytical purposes only and are not intended as investment advice. Market analysis involves uncertainty, and outcomes may differ from expectations. Users should conduct their own due diligence and consider their individual circumstances before making any financial decisions. Past performance is not necessarily indicative of future results.

Hypothetical Performance Disclosure: Hypothetical performance results have many inherent limitations, some of which are described below. No representation is being made that any account will or is likely to achieve profits or losses similar to those shown; in fact, there are frequently sharp differences between hypothetical performance results and the actual results subsequently achieved by any particular trading program. One of the limitations of hypothetical performance results is that they are generally prepared with the benefit of hindsight. In addition, hypothetical trading does not involve financial risk, and no hypothetical trading record can completely account for the impact of financial risk of actual trading. for example, the ability to withstand losses or to adhere to a particular trading program in spite of trading losses are material points which can also adversely affect actual trading results. There are numerous other factors related to the markets in general or to the implementation of any specific trading program which cannot be fully accounted for in the preparation of hypothetical performance results and all which can adversely affect trading results.

Testimonial Disclosure: Testimonials appearing on this website may not be representative of other clients or customers and is not a guarantee of future performance or success.