
Bulls really want to see this change

A thrust that's still lacking
There have been some nascent signs of buyers eagerly returning to stocks. Indexes have soared, and some breadth metrics are showing quick turnarounds.
One of the critical factors for a healthy market environment and improving sentiment in any sector or index is that the number of issues hitting a 52-week high should outnumber those falling to a 52-week low. Very basic, but very effective.
It has been a struggle to see that on the NYSE or Nasdaq exchanges. It's been even more of a struggle to see any kind of thrust. The NYSE Net High-Low % has been below 10% for more than 200 days. That's the longest since 2018 and ranks among the 20 longest streaks over the past 60 years.
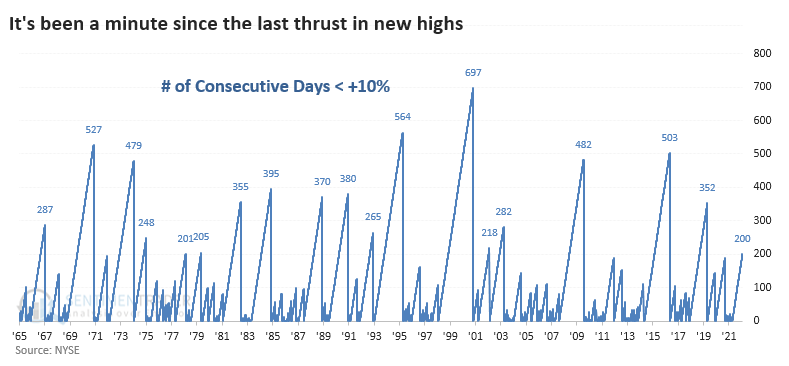
Long streaks without a net new high thrust tended to lead to mediocre returns, and it can be a worry since this is a hallmark of bear markets. We witnessed this behavior before the worst declines in 2008, 2015, and 2018. But it's not so consistent that we can chalk it up as a point in bears' favor - these long streaks also triggered near the bottoms of bear markets a handful of times.
It's even more egregious on the Nasdaq.

A nice house in a good neighborhood
The relative strength index (RSI), developed by J. Welles Wilder Jr., measures price momentum for stocks, indexes, or other assets. However, one can apply the indicator to almost any type of time series. Dean likes to use the RSI indicator on the ratio between two securities to identify relative strength trends. When the RSI ratio exceeds 70, the relative momentum trend is positive.
The RSI ratio indicator for the Australian ETF (EWA) just surged to the third-highest level in the last decade and the ratio trend model reversed from negative to positive on 2/17/22 when the RSI ratio crossed above 70. Favorable RSI ratio trend conditions show significantly higher annualized returns for the iShares EWA ETF, with a return of 14.2%. In contrast, when the RSI ratio trend is negative, the ETF annualizes at 3.6%.
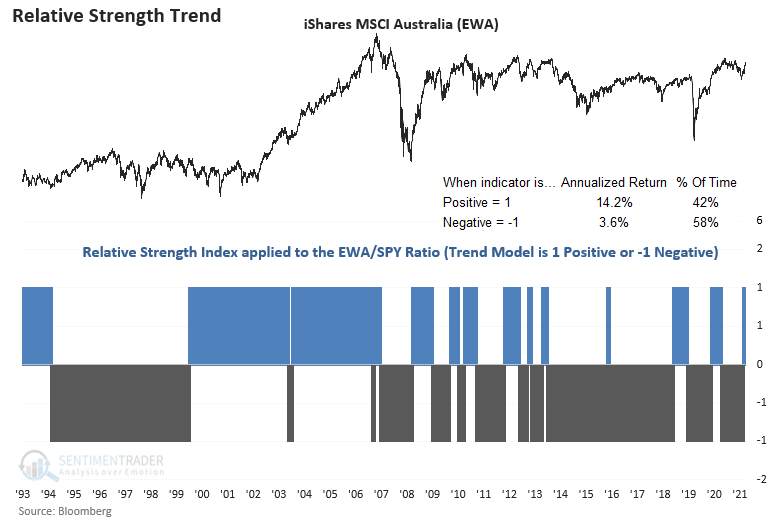
A trading signal using this methodology occurred 20 other times over the past 29 years. The model ensures that we buy solid absolute and relative trends to avoid buying the best house in a lousy neighborhood. After the other signals, future returns, win rates, and risk/reward profiles were solid across all time frames, especially on a medium-term basis.
