Products
SentimenTrader Trading Tools
‍
Backtest Engine
My Trading Toolkit
Correlation Analysis
Seasonality
Market Prediction
Indicators & Data API
‍
Proprietary Indicators & Charts
Market Data API
Strategies & Scanner
‍
50+ Trading Strategies
Smart Stock Scanner
Smart Option Scanner
Research Reports
‍
Research Solutions
Reports Library
Free Resources
Simple Backtest Calculator
Simple Seasonality Calculator
The Kelly Criterion Calculator
Sentiment Geo Map
Public Research Reports
Education
Sentiment Indicators
Technical Indicators
Pricing
Company
About
In the News
Testimonials
Client Success Stories
Contact
Log inLoginSign up
< BACK TO ALL REPORTS

Bulls' nightmare week

Jason Goepfert
2020-02-26
The past 2 days have seen a historic selloff in stocks, cycling from new highs to multi-month lows. This week saw back-to-back 90% down days.

Historic selloff

This is one of those times that happen every few years when we could spend page after page listing extremes. It’s not quite to the extent of Christmas Eve 2018, though. 

If we distill the most important part of the moves over the past two days, it likely comes down to the shock dealt to investors that had not witnessed this kind of price action in years, if ever. Just a few sessions ago, stocks were sitting at all time highs, and the discussion was about how resilient stocks are. Now, there are whiffs of panic. 

That can happen when stocks go from sitting at all-time highs to wiping away more than two months of gains in less than a week. It hasn’t happened very often.
S&P goes from high to 2 month low

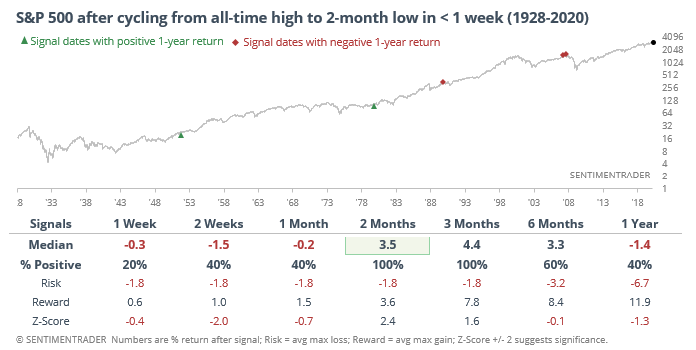
Historical comparisons like this always generate “actually…” kinds of comments. We’ve never had a period with such aggressive Fed manipulation. Or passive investing demand. Or a global pandemic. Or, or, or. As always, every moment in the market is unique, and there is never an exact precedent.

But if we look at behavior through various prisms, sometimes a consistent pattern will emerge. We're seeing that with many of the studies that have triggered over the past two days.


Double down

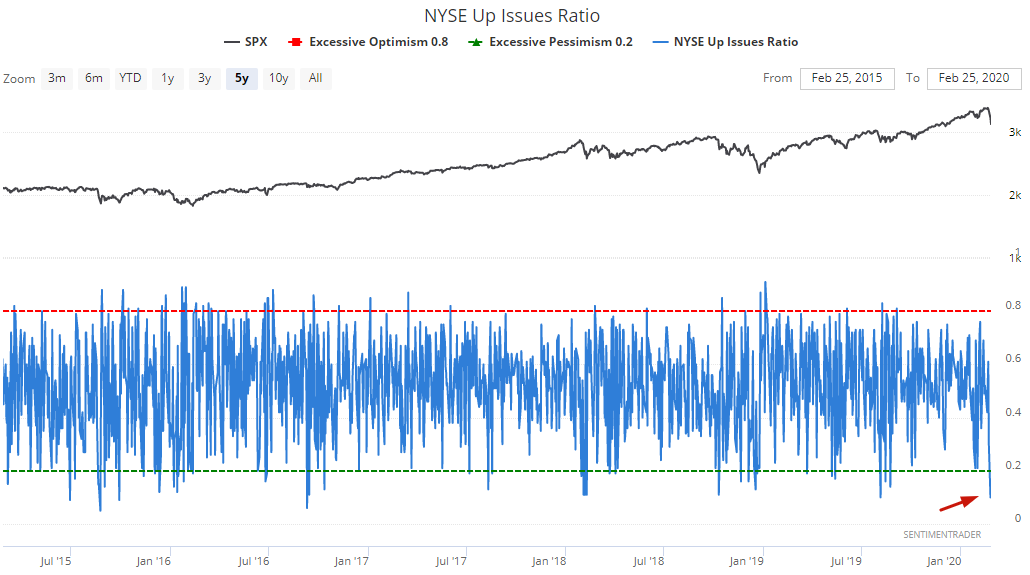
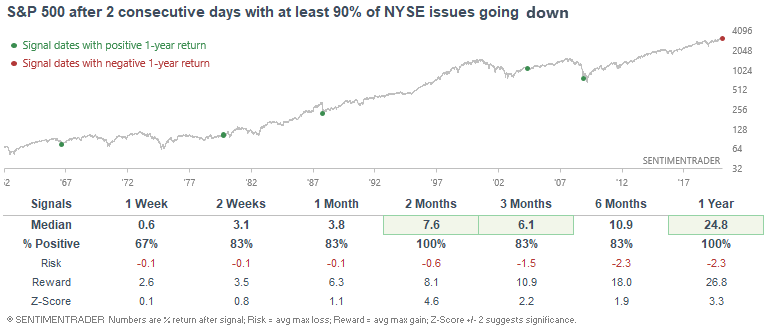
Among many extremes, selling pressure has been intense over the past two sessions. On the NYSE, more than 90% of issues fell on Monday and Tuesday:

90% down day

There have only been a few other historical cases with 2 days of such widespread selling. Historically, the S&P rallied over the next 2-12 months.

Consecutive 90% down days

This is an abridged version of our recent reports and notes. For immediate access with no obligation, sign up for a 30-day free trial now.

We also looked at:

  • The S&P suffered consecutive 2 standard deviation losses
  • A bunch of S&P stocks are below their lower Bollinger Bands
  • Almost all of them are below their 10-day moving averages, too
  • What happens after the S&P pulls back 7% for the first time in over a year
  • The "old VIX" spiked above 30 for the first time in a year
  • What happens when the VIX gets this overbought
  • SPY volume has spiked
  • Energy sector breadth is showing signs of a true extreme
PRODUCTS
SentimenTrader
Trading Tools
Indicators & Data API
‍
Strategies & Scanner
‍
Research Reports
FREE
RESOUrCES
Simple Backtest
Calculator
Simple Seasonality
Calculator
The Kelly Criterion
Calculator
Sentiment Geo Map
‍
Public Research Reports
‍
Education
Sentiment Indicators
‍
Technical Indicators
‍
Pricing
Bundle pricing
‍
FAQ
‍
Announcements
‍
COMPANY
‍
About
‍
In the News
‍
Testimonials
‍
Client Success Stories
CONTACT
‍
General Inquiries
‍
Media Inquiries
‍
Financial Professionals Inquiries
‍
© 2026 Sundial Capital Research Inc. All rights reserved.
Setsail Marketing
TermsPrivacyAffiliate Program
Risk Disclosure: The information and tools provided are for research and analytical purposes only and are not intended as investment advice. Market analysis involves uncertainty, and outcomes may differ from expectations. Users should conduct their own due diligence and consider their individual circumstances before making any financial decisions. Past performance is not necessarily indicative of future results.

Hypothetical Performance Disclosure: Hypothetical performance results have many inherent limitations, some of which are described below. No representation is being made that any account will or is likely to achieve profits or losses similar to those shown; in fact, there are frequently sharp differences between hypothetical performance results and the actual results subsequently achieved by any particular trading program. One of the limitations of hypothetical performance results is that they are generally prepared with the benefit of hindsight. In addition, hypothetical trading does not involve financial risk, and no hypothetical trading record can completely account for the impact of financial risk of actual trading. for example, the ability to withstand losses or to adhere to a particular trading program in spite of trading losses are material points which can also adversely affect actual trading results. There are numerous other factors related to the markets in general or to the implementation of any specific trading program which cannot be fully accounted for in the preparation of hypothetical performance results and all which can adversely affect trading results.

Testimonial Disclosure: Testimonials appearing on this website may not be representative of other clients or customers and is not a guarantee of future performance or success.