
Bulls get more support from global momentum

Key points:
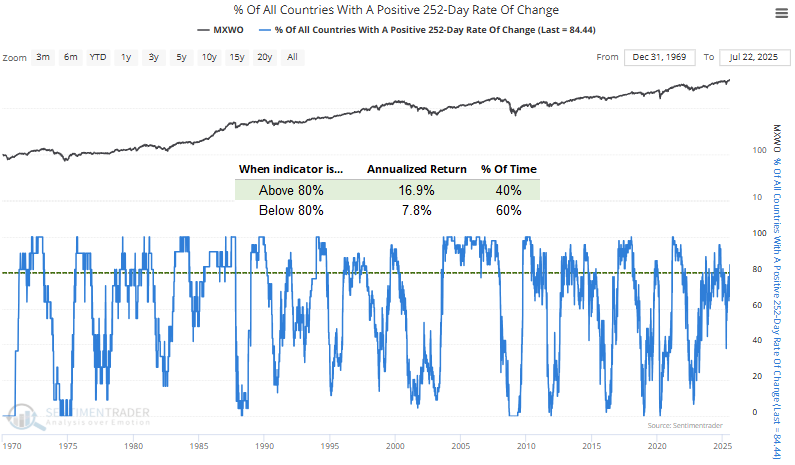
- The percentage of country indexes with a positive 252-day rate of change increased above 80%
- Similar long-term momentum shifts saw global stocks rise 100% of the time a year later
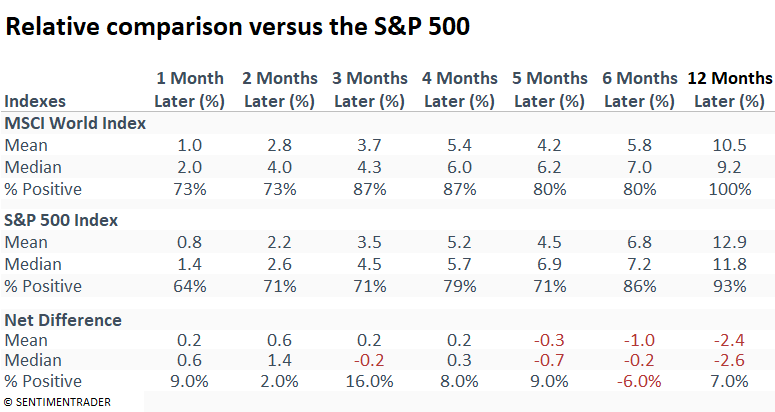
- They also outperformed the S&P 500 in the initial four months, but lagged a year later
A synchronized global recovery
It's good to be an investor pretty much anywhere in the developed world right now.
The case for a sustained rally in stocks got an additional boost on Tuesday when over 80% of country indexes displayed a positive 252-day rate-of-change, the first such occurrence in more than a year. This favorable price momentum suggests that the strength in the U.S. market is not an isolated event, but part of a broader global trend.
As illustrated in the chart below, when nearly all international equity markets display bullish momentum, the MSCI World Index has delivered an impressive 16.9% annualized return, far surpassing environments with less broad-based strength.
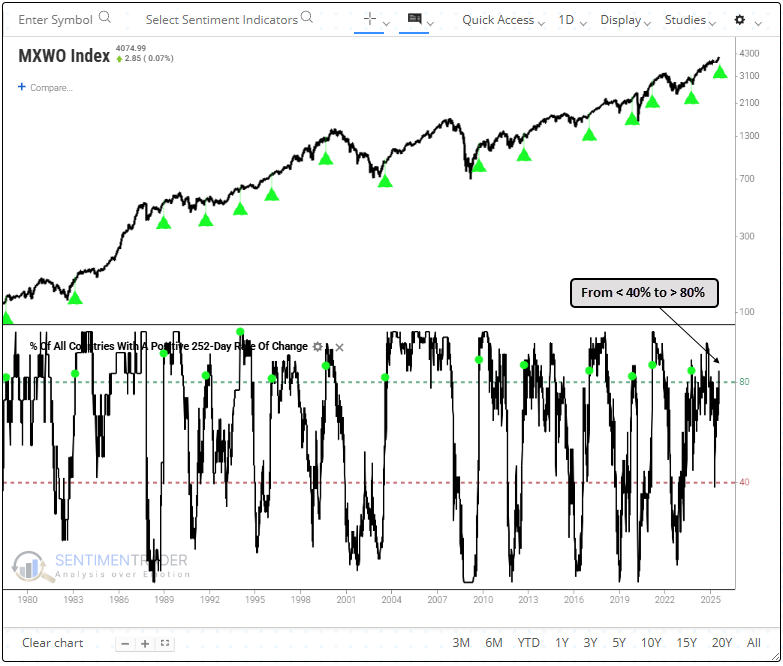
Although readings above 80% tend to align with robust annualized returns, it's also informative to analyze what happens when the percentage of countries with a positive 252-day rate of change rises from below 40% to above 80%.
We'll explore this signal-based approach using the Backtest Engine below.
A favorable backdrop for global stocks
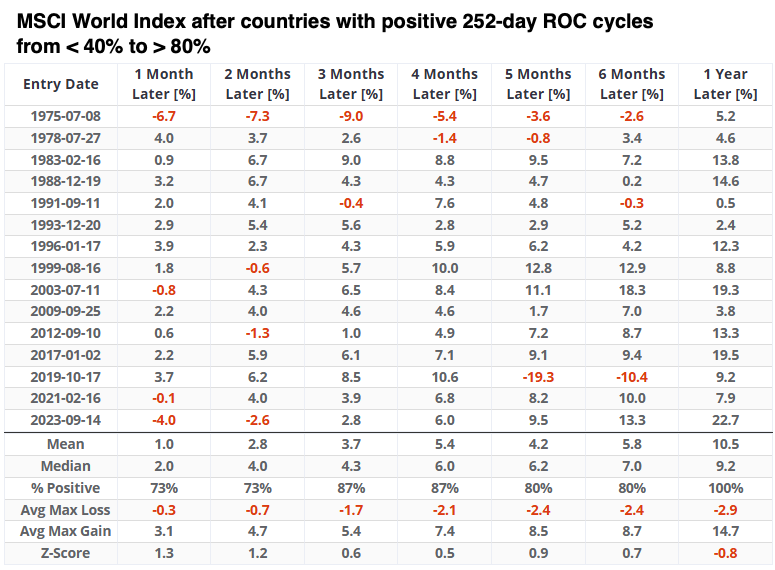
Following similar cycles, the MSCI World Index produced uniformly solid returns, advancing in every instance over the next 12 months. Per MSCI, this index captures large and mid-cap representation across 23 Developed Markets countries. With 1,325 constituents, the index covers approximately 85% of the free float-adjusted market capitalization in each country.
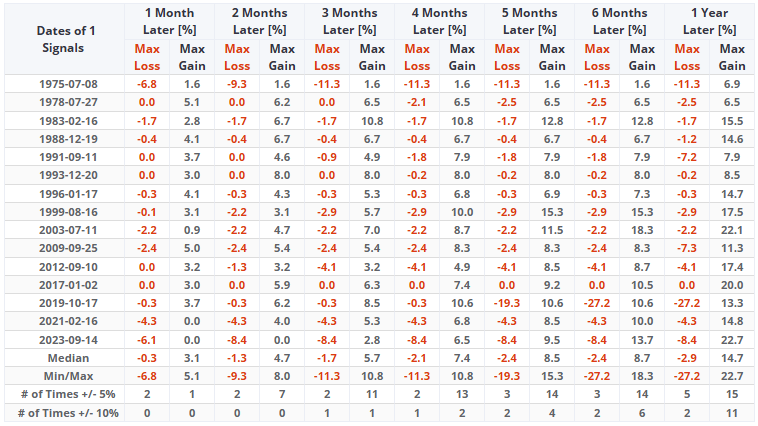
Most instances followed deeper oversold conditions, with readings below 20%. A comparable setup that more closely mirrors today's conditions occurred in 1993, resulting in a maximum gain of 8.5% and a minimal drawdown of 0.2%.
Over the following year, the Index experienced three declines of more than 10%. Still, it rallied more than 10% on eleven occasions, highlighting a skew toward upside potential.
Equity curves should ideally progress smoothly from the lower left to the upper right, and that's precisely what we see with the country momentum signal.
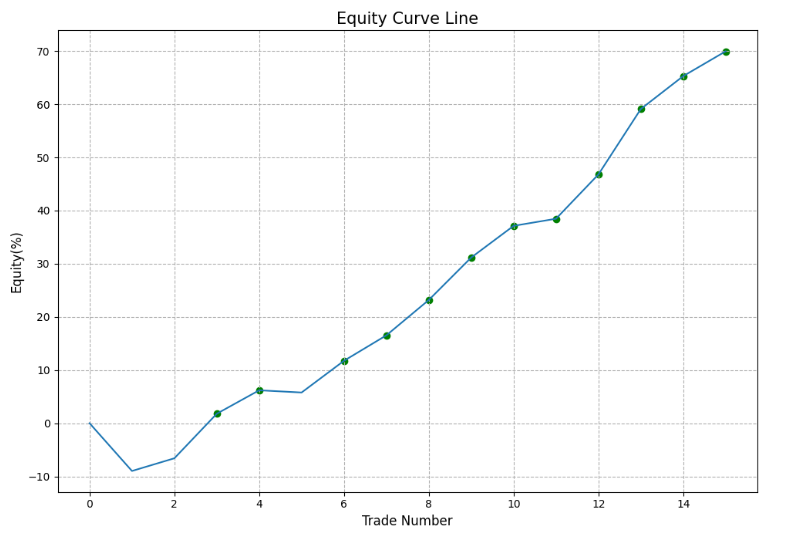
The MSCI World Index tended to outperform the S&P 500 in the initial four months. However, a year later, it lagged the U.S. benchmark.
It's essential to recognize that the MSCI World Index, which comprises developed markets, is now heavily skewed toward the U.S., accounting for 71% of its total weighting. As a result, it no longer reflects a diversified global stock portfolio.
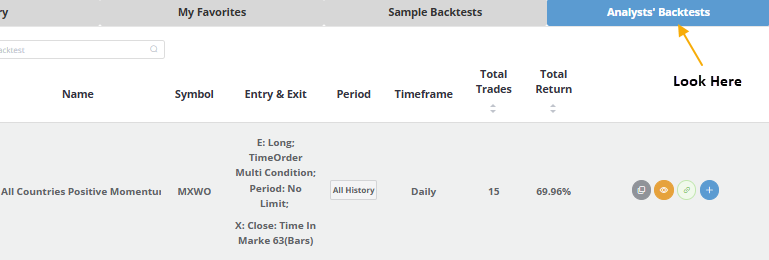
Click here to save a copy of this trading signal to your favorites folder in the Backtest Engine. Additionally, you can find a copy in the Analysts' Backtests tab under the name All Countries Positive Momentum Shift.
What the research tells us...
A synchronized global recovery has taken shape, with over 80% of country equity indexes worldwide now exhibiting a positive 252-day rate of change. This broad-based price momentum underscores the widespread nature of the current uptrend.
Historically, such widespread strength across global markets has tended to support a more sustainable advance in equities, reducing the likelihood that the rally is narrowly led or overly fragile. The URTH fund closely tracks the MSCI World Index.