Products
SentimenTrader Trading Tools
‍
Backtest Engine
My Trading Toolkit
Correlation Analysis
Seasonality
Market Prediction
Indicators & Data API
‍
Proprietary Indicators & Charts
Market Data API
Strategies & Scanner
‍
50+ Trading Strategies
Smart Stock Scanner
Smart Option Scanner
Research Reports
‍
Research Solutions
Reports Library
Free Resources
Simple Backtest Calculator
Simple Seasonality Calculator
The Kelly Criterion Calculator
Sentiment Geo Map
Public Research Reports
Education
Sentiment Indicators
Technical Indicators
Pricing
Company
About
In the News
Testimonials
Client Success Stories
Contact
Log inLoginSign up
< BACK TO ALL REPORTS

Bullish markets break records

Dean Christians
2025-07-29
The S&P 500 has surged to a sixth consecutive record high. Comparable streaks have led to further gains, with the index rallying 80% of the time over the following three to twelve months.

Key points: 

  • The S&P 500 registered its sixth straight record close on Monday
  • Similar persistence saw the index rally 80% of the time from three to twelve months later
  • Cyclical sectors tended to outperform the broad market in the initial three months

An impressive win streak  

Stocks continue their relentless rally off the April lows, with an increasing number of indexes breaking out to new highs. Given the market's substantial advance, investors now wonder-do record highs alone justify taking profits?

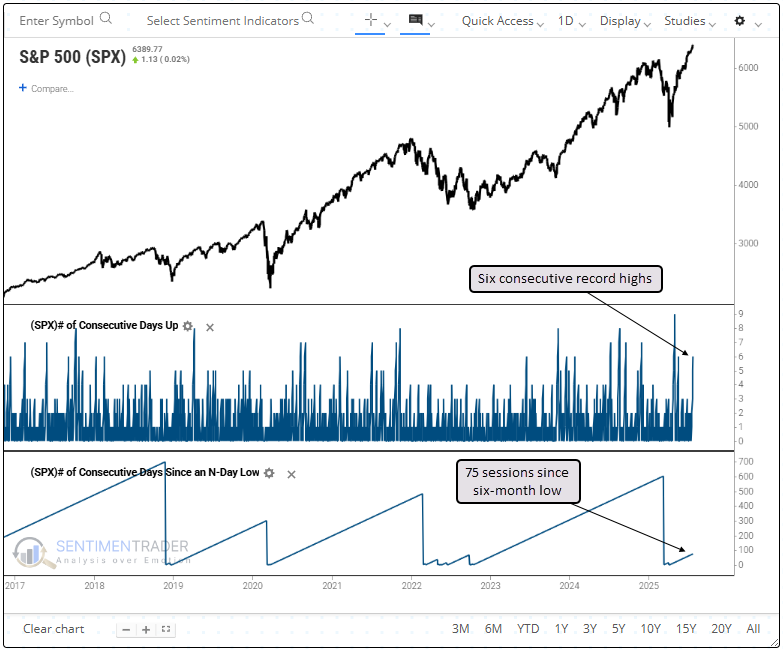
On Monday, the world's most benchmarked index notched its sixth consecutive record high, completing the second-fastest rebound from a six-month low to this many all-time highs, trailing only 1961.

Consistent returns

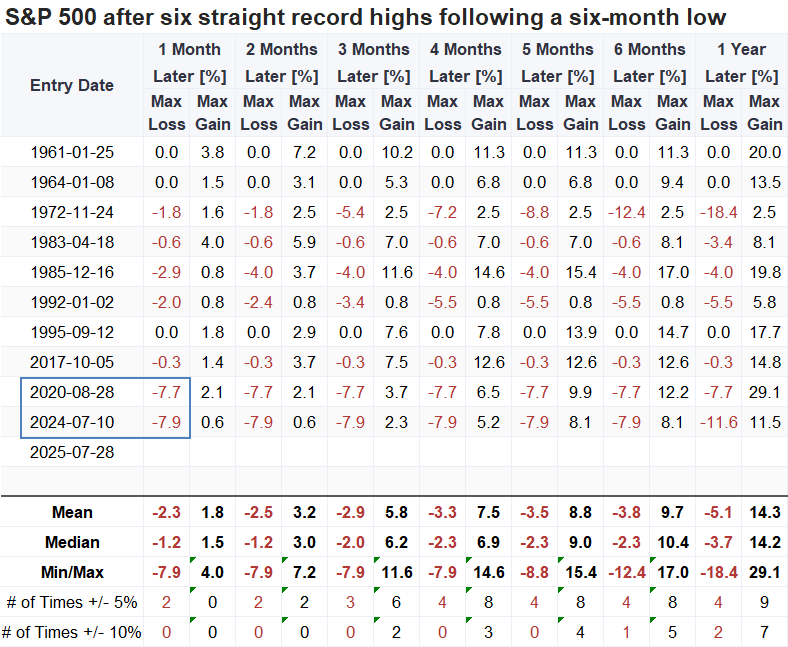
Whenever the S&P 500 logged six consecutive record highs for the first time following a six-month low, the world's most benchmarked index showed strong persistence, with solid returns over the next three to twelve months. The only major exception was in 1972, though it's worth noting that those record highs occurred long after the six-month low.

Given the initial month's coin-flip performance, it's worth noting that we're moving into a time of year that's typically sluggish.  

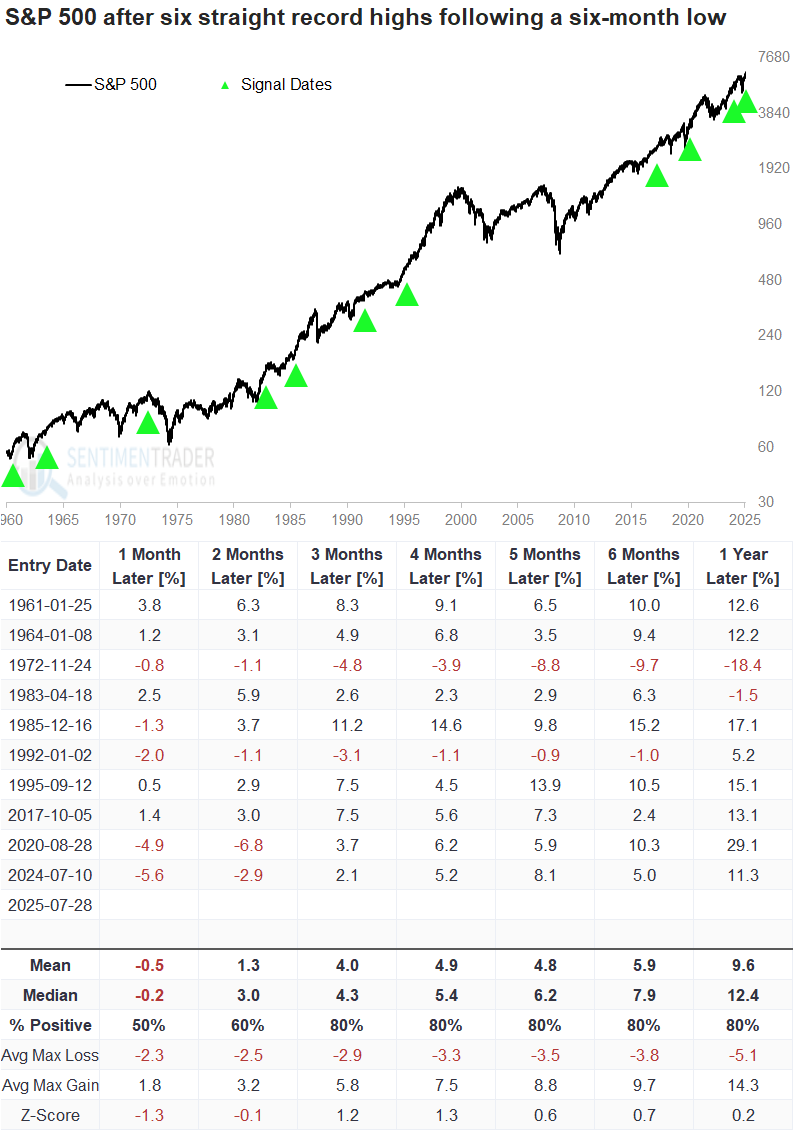
The S&P 500 was more likely to rally 10% over the subsequent year rather than decline by that amount. However, note that the last two signals occurred in July and August, during a seasonal window prone to market hesitation, and preceded declines of just over 7%. 

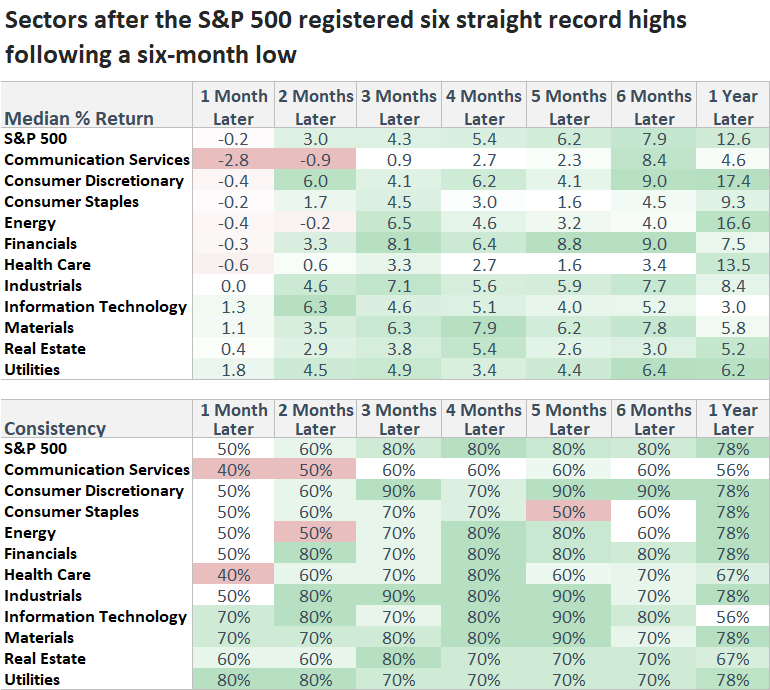
The persistence in record highs typically signaled a momentum-driven market, initially favoring cyclical sectors, outperforming the broader market over the first three months. However, most of that relative strength began to fade by the fourth month, except in consumer discretionary. 

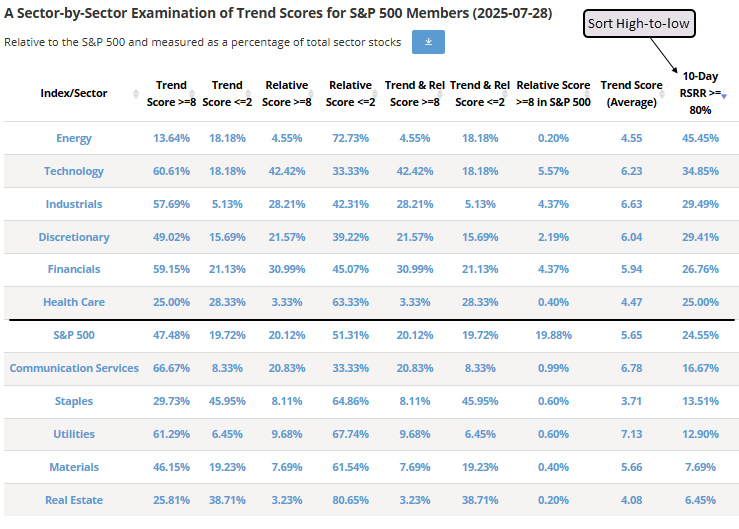
Cyclical relative strength persists

Record highs typically favor cyclical sector outperformance over the medium term, so it's worth examining whether that historical tendency aligns with current trends. Encouragingly, cyclical groups show relative leadership, even over a short time frame, like 10 sessions. 

What the research tells us...

The S&P 500 has been on a tear, notching its sixth consecutive record high on Monday, a notable feat that comes on the heels of a six-month low as recently as April. Historically, this persistence following a significant low has boded well for equities, with the index going on to rally over the medium to long term roughly 80% of the time, initially led by cyclicals. A pause or consolidation phase wouldn't be unusual in the near term, especially as the market enters a seasonally dull stretch that has often lacked strong directional bias. 

PRODUCTS
SentimenTrader
Trading Tools
Indicators & Data API
‍
Strategies & Scanner
‍
Research Reports
FREE
RESOUrCES
Simple Backtest
Calculator
Simple Seasonality
Calculator
The Kelly Criterion
Calculator
Sentiment Geo Map
‍
Public Research Reports
‍
Education
Sentiment Indicators
‍
Technical Indicators
‍
Pricing
Bundle pricing
‍
FAQ
‍
Announcements
‍
COMPANY
‍
About
‍
In the News
‍
Testimonials
‍
Client Success Stories
CONTACT
‍
General Inquiries
‍
Media Inquiries
‍
Financial Professionals Inquiries
‍
© 2026 Sundial Capital Research Inc. All rights reserved.
Setsail Marketing
TermsPrivacyAffiliate Program
Risk Disclosure: The information and tools provided are for research and analytical purposes only and are not intended as investment advice. Market analysis involves uncertainty, and outcomes may differ from expectations. Users should conduct their own due diligence and consider their individual circumstances before making any financial decisions. Past performance is not necessarily indicative of future results.

Hypothetical Performance Disclosure: Hypothetical performance results have many inherent limitations, some of which are described below. No representation is being made that any account will or is likely to achieve profits or losses similar to those shown; in fact, there are frequently sharp differences between hypothetical performance results and the actual results subsequently achieved by any particular trading program. One of the limitations of hypothetical performance results is that they are generally prepared with the benefit of hindsight. In addition, hypothetical trading does not involve financial risk, and no hypothetical trading record can completely account for the impact of financial risk of actual trading. for example, the ability to withstand losses or to adhere to a particular trading program in spite of trading losses are material points which can also adversely affect actual trading results. There are numerous other factors related to the markets in general or to the implementation of any specific trading program which cannot be fully accounted for in the preparation of hypothetical performance results and all which can adversely affect trading results.

Testimonial Disclosure: Testimonials appearing on this website may not be representative of other clients or customers and is not a guarantee of future performance or success.