Products
SentimenTrader Trading Tools
‍
Backtest Engine
My Trading Toolkit
Correlation Analysis
Seasonality
Market Prediction
Indicators & Data API
‍
Proprietary Indicators & Charts
Market Data API
Strategies & Scanner
‍
50+ Trading Strategies
Smart Stock Scanner
Smart Option Scanner
Research Reports
‍
Research Solutions
Reports Library
Free Resources
Simple Backtest Calculator
Simple Seasonality Calculator
The Kelly Criterion Calculator
Sentiment Geo Map
Public Research Reports
Education
Sentiment Indicators
Technical Indicators
Pricing
Company
About
In the News
Testimonials
Client Success Stories
Contact
Log inLoginSign up
< BACK TO ALL REPORTS

Bull Stampede

Jason Goepfert
2019-12-19
null

The Rydex family of mutual funds is showing that investors are almost the most bullish on record.

Bull stampede at Rydex

In the Rydex family of mutual funds, traders have positioned themselves in perhaps the most aggressive way ever.

It’s not hip to be a mutual fund manager anymore – all the cool kids are rushing into ETFs. Even so, the Rydex family of mutual funds still holds more than $4 billion in assets, and it remains popular with fund timers. And those timers are storming into stocks.

Ratios of assets in bullish versus bearish funds, including those using leverage, are at or near all-time highs, while the percentage of cash held in the money market fund just hit an all-time low, dating back 25 years.

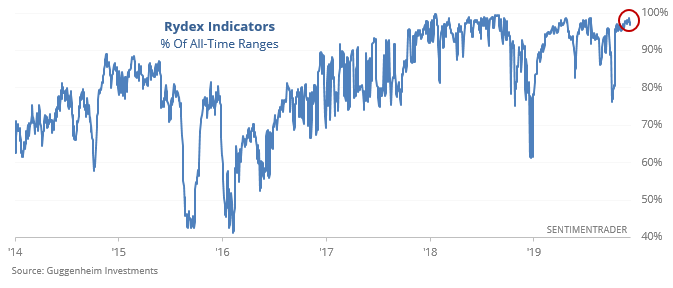
Because of the influence of a handful of traders on the data, we pay much less attention to these flows than we did 10 or 15 years ago. Still, they can be useful once in a while when they reach true extremes, and that’s where they’re at now.
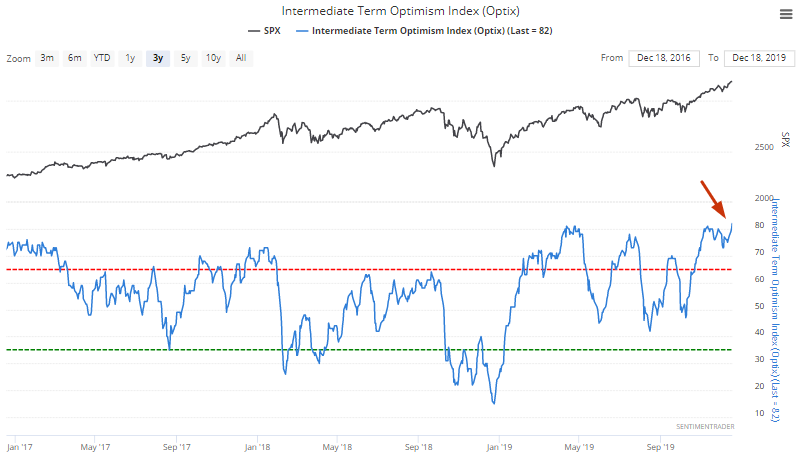

Optimism

Our Intermediate Term Optimism Index is now at its highest level in years. At this point, most of our sentiment indicators are demonstrating excessive optimism.

When the Intermediate Term Optimism Index crossed above 82, the S&P's median returns over the next 2 months were below average, even though most of the 1 year forward returns were bullish.

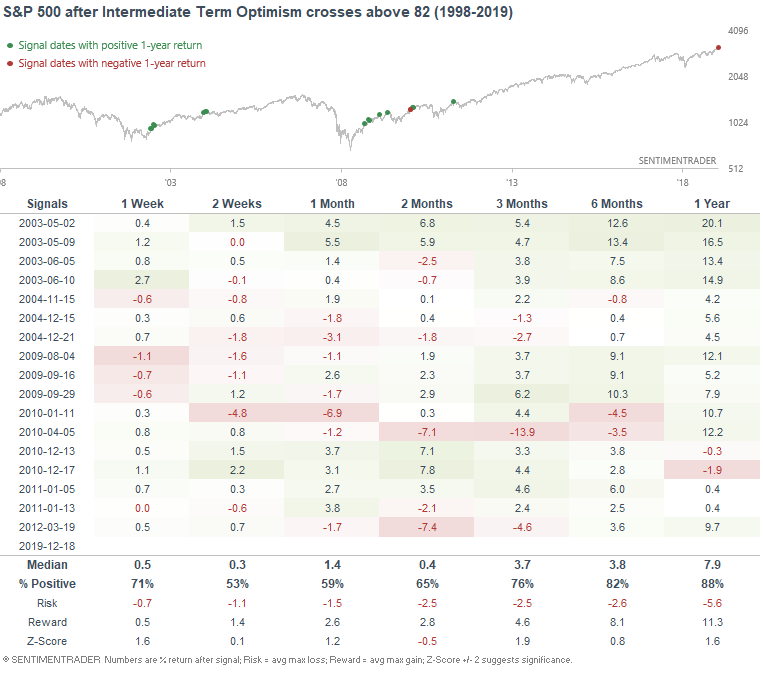
Many of the most positive returns came after the initial bursts of optimism following the ends of the last two protracted bear markets. Those are questionable precedents for our current environment. When extremely high optimism occurred along with multi-year highs in the S&P, it was more of a short- to medium-term negative.

This is an abridged version of our recent reports and notes. For immediate access with no obligation, sign up for a 30-day free trial now.

We also looked at:

  • "Pro" versus "Joe" sentiment in the housing market
  • NYSE new highs versus new lows just hit the highest mark in 200 days
  •  Smart Money / Dumb Money Confidence has been low for a very long time
  • Emerging market stocks are jumping out of their Bollinger Bands
  • What happens when the Relative Strength Index (RSI) on EEM is high
  • Bond optimism is relatively low
PRODUCTS
SentimenTrader
Trading Tools
Indicators & Data API
‍
Strategies & Scanner
‍
Research Reports
FREE
RESOUrCES
Simple Backtest
Calculator
Simple Seasonality
Calculator
The Kelly Criterion
Calculator
Sentiment Geo Map
‍
Public Research Reports
‍
Education
Sentiment Indicators
‍
Technical Indicators
‍
Pricing
Bundle pricing
‍
FAQ
‍
Announcements
‍
COMPANY
‍
About
‍
In the News
‍
Testimonials
‍
Client Success Stories
CONTACT
‍
General Inquiries
‍
Media Inquiries
‍
Financial Professionals Inquiries
‍
© 2026 Sundial Capital Research Inc. All rights reserved.
Setsail Marketing
TermsPrivacyAffiliate Program
Risk Disclosure: The information and tools provided are for research and analytical purposes only and are not intended as investment advice. Market analysis involves uncertainty, and outcomes may differ from expectations. Users should conduct their own due diligence and consider their individual circumstances before making any financial decisions. Past performance is not necessarily indicative of future results.

Hypothetical Performance Disclosure: Hypothetical performance results have many inherent limitations, some of which are described below. No representation is being made that any account will or is likely to achieve profits or losses similar to those shown; in fact, there are frequently sharp differences between hypothetical performance results and the actual results subsequently achieved by any particular trading program. One of the limitations of hypothetical performance results is that they are generally prepared with the benefit of hindsight. In addition, hypothetical trading does not involve financial risk, and no hypothetical trading record can completely account for the impact of financial risk of actual trading. for example, the ability to withstand losses or to adhere to a particular trading program in spite of trading losses are material points which can also adversely affect actual trading results. There are numerous other factors related to the markets in general or to the implementation of any specific trading program which cannot be fully accounted for in the preparation of hypothetical performance results and all which can adversely affect trading results.

Testimonial Disclosure: Testimonials appearing on this website may not be representative of other clients or customers and is not a guarantee of future performance or success.