
Bull Market Tailwinds with a Fragile Foundation

Key Points:
- Defensive sector breadth collapses, bullish long-term
- New highs lack support, high short-term risks
- Long-term bullish vs. short-term risky conflict, rising volatility
A "Risk-On" Signal Backed by Historical Blueprints
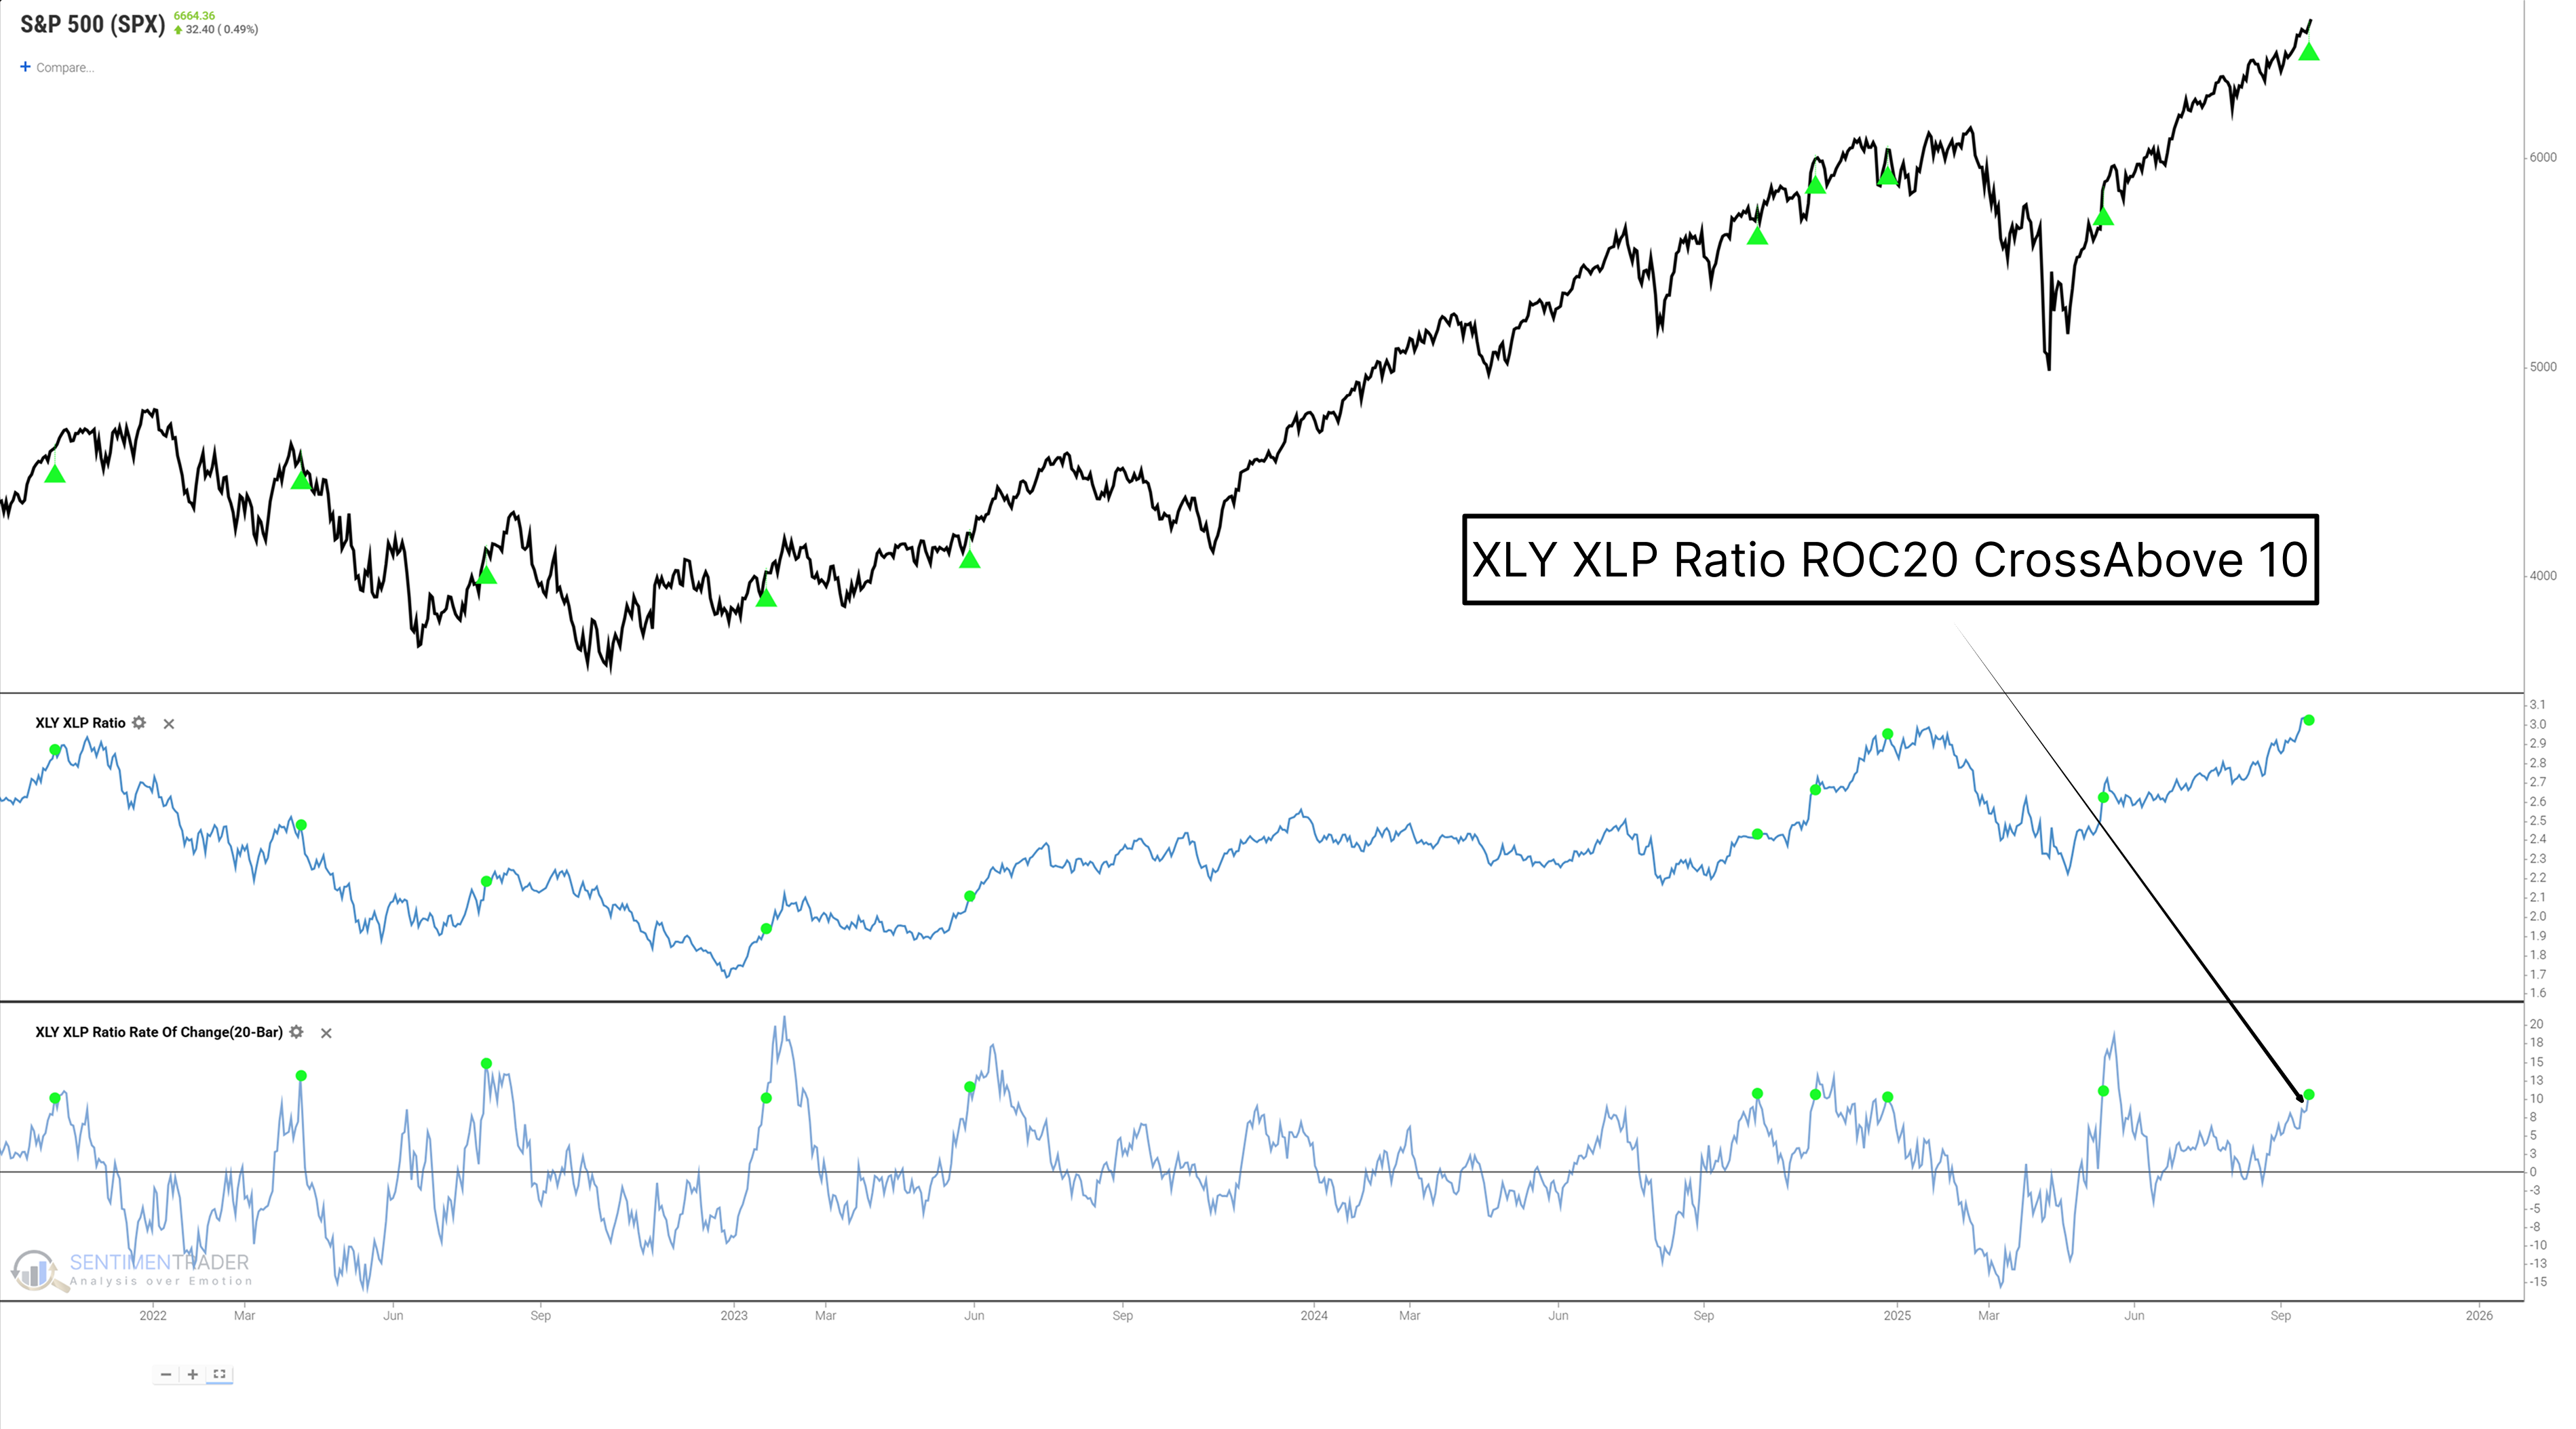
Last week, on September 18, the market sent a notable signal: the 20-day change rate of the ratio between Consumer Discretionary (XLY) and Consumer Staples (XLP) surged by over 10%. This ratio is regarded as a "risk barometer" for measuring investor sentiment.
XLP represents "Needs"-products consumers must buy regardless of economic conditions-while XLY represents "Wants"-items consumers are more willing to spend on when the economy is strong.
A sharp rise in this ratio means capital is rapidly rotating from defensive sectors to offensive sectors, a clear sign of significantly increased market risk appetite.
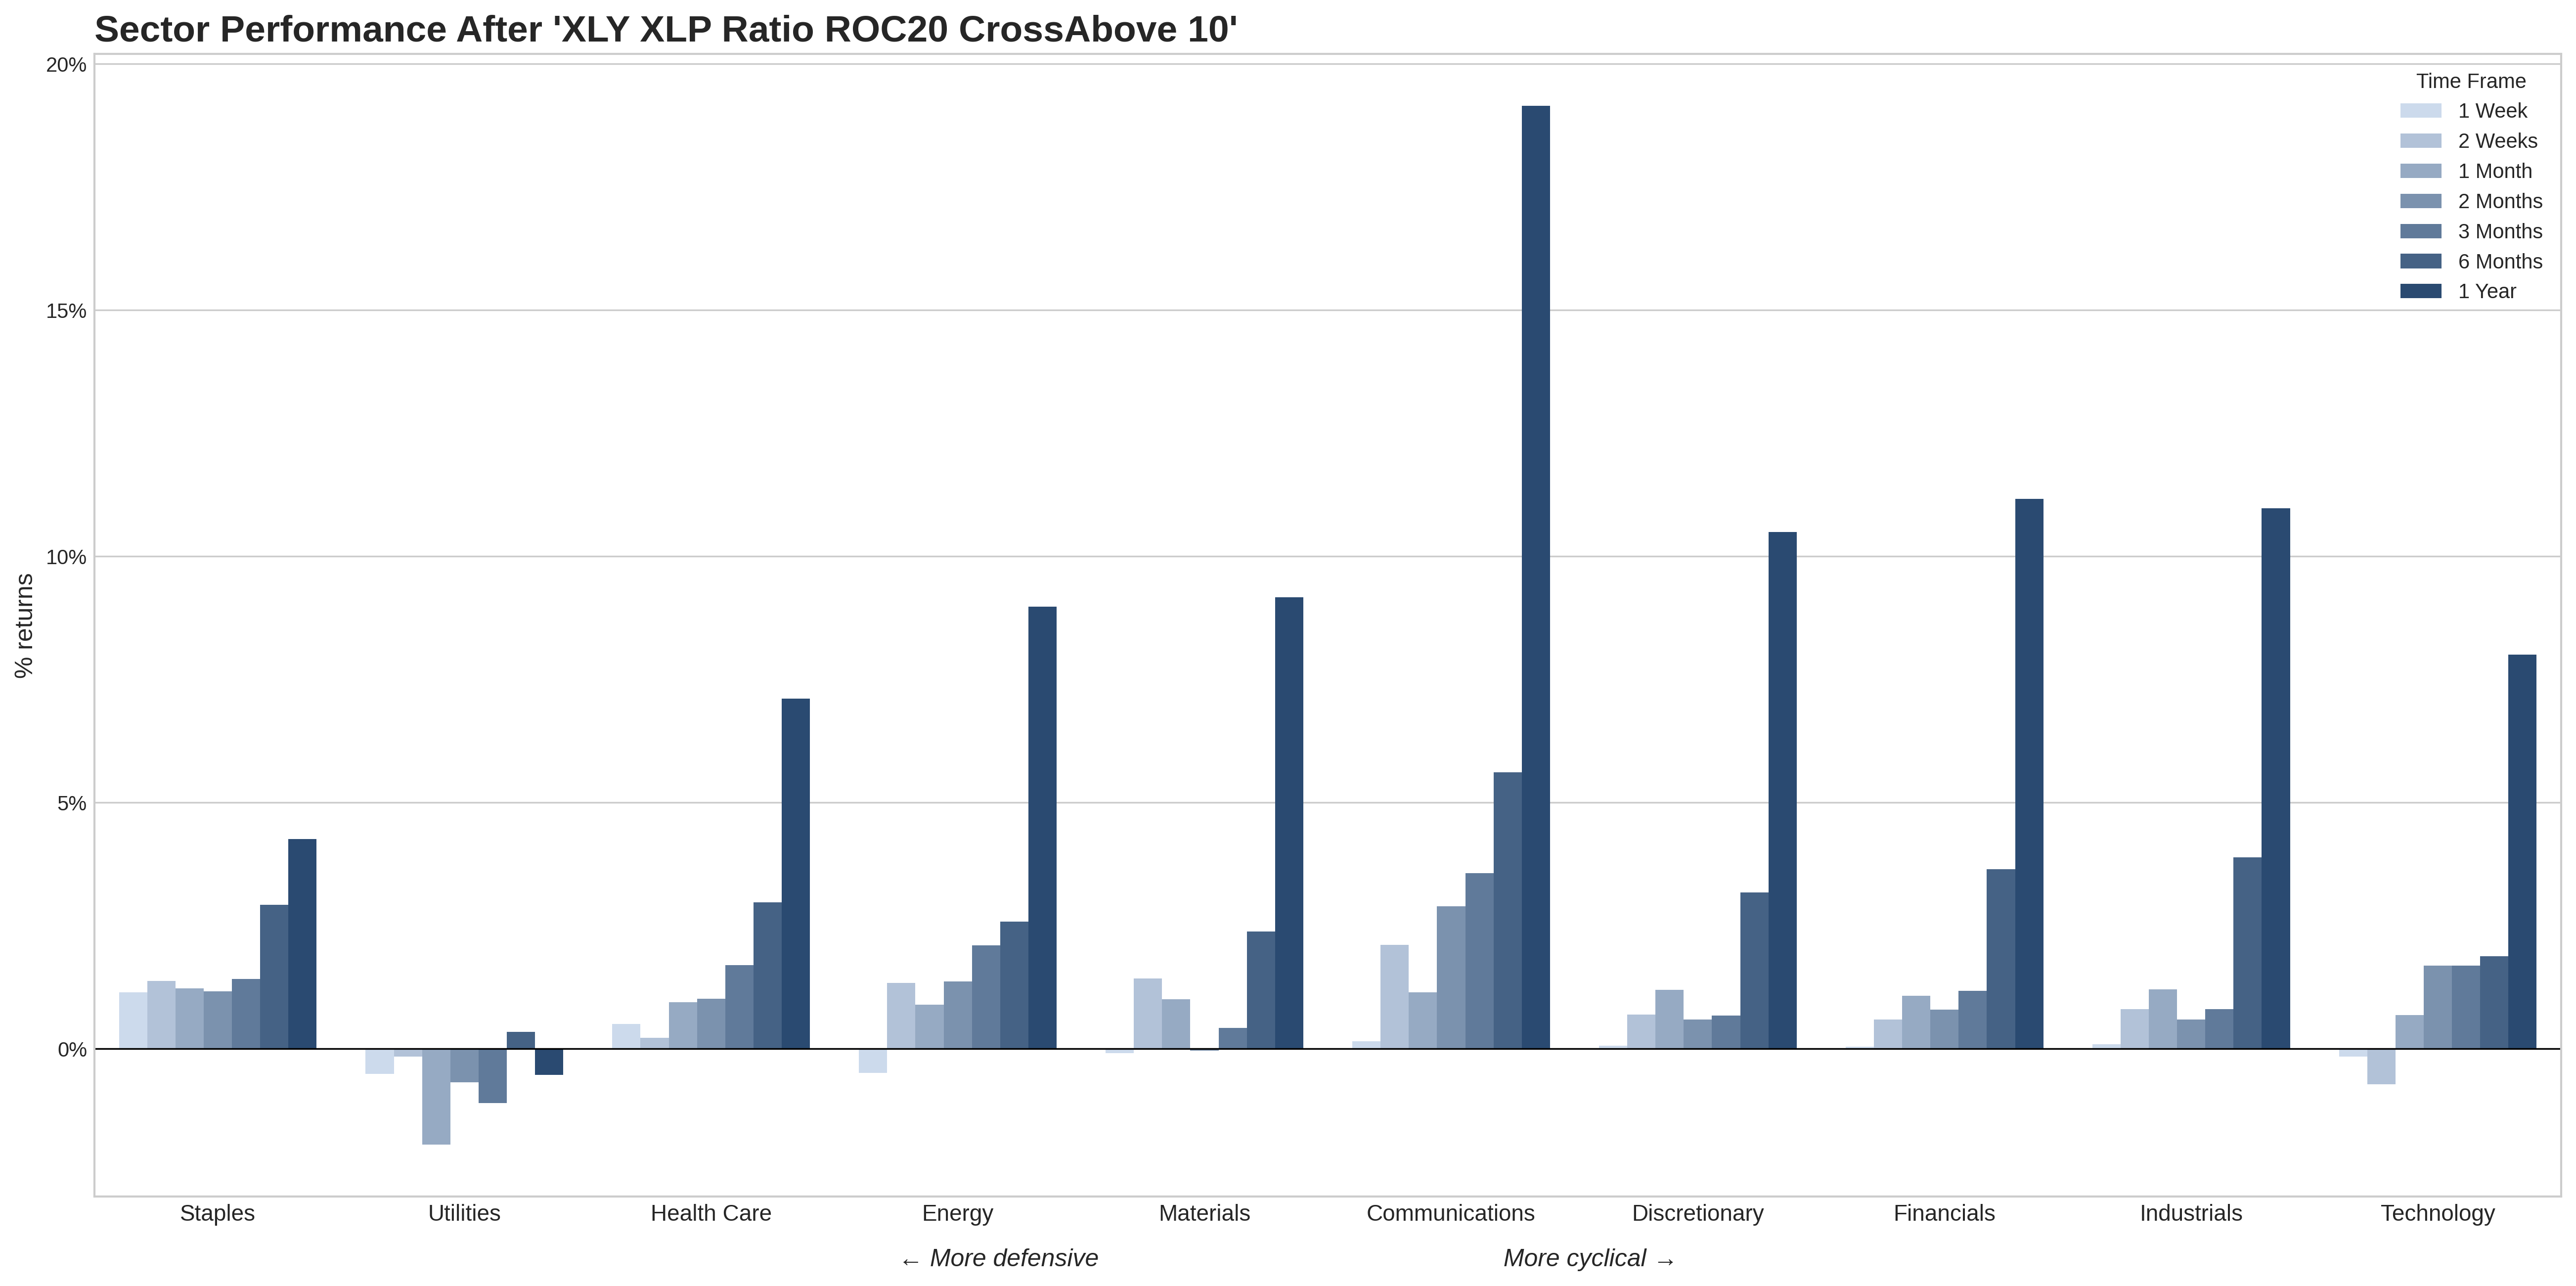
To understand the potential impact of this signal, we can refer to its historical performance. The chart below shows the average returns of various sectors after the signal is triggered.
This historical blueprint clearly depicts a structural rotation: capital flows out of the worst-performing Utilities sector and into all cyclical sectors such as Discretionary, Financials, and Industrials. This provides a benchmark for us to assess the current market dynamics.Related Backtest Click Here.
Warning: The Foundation of the Breakthrough Seems Unstable
While the historical performance of the above signal is encouraging, before we grow overly optimistic, we must examine the "quality" of last week's market breakthrough. The key to market analysis lies not only in observing "what happened" but also in understanding "how it happened."
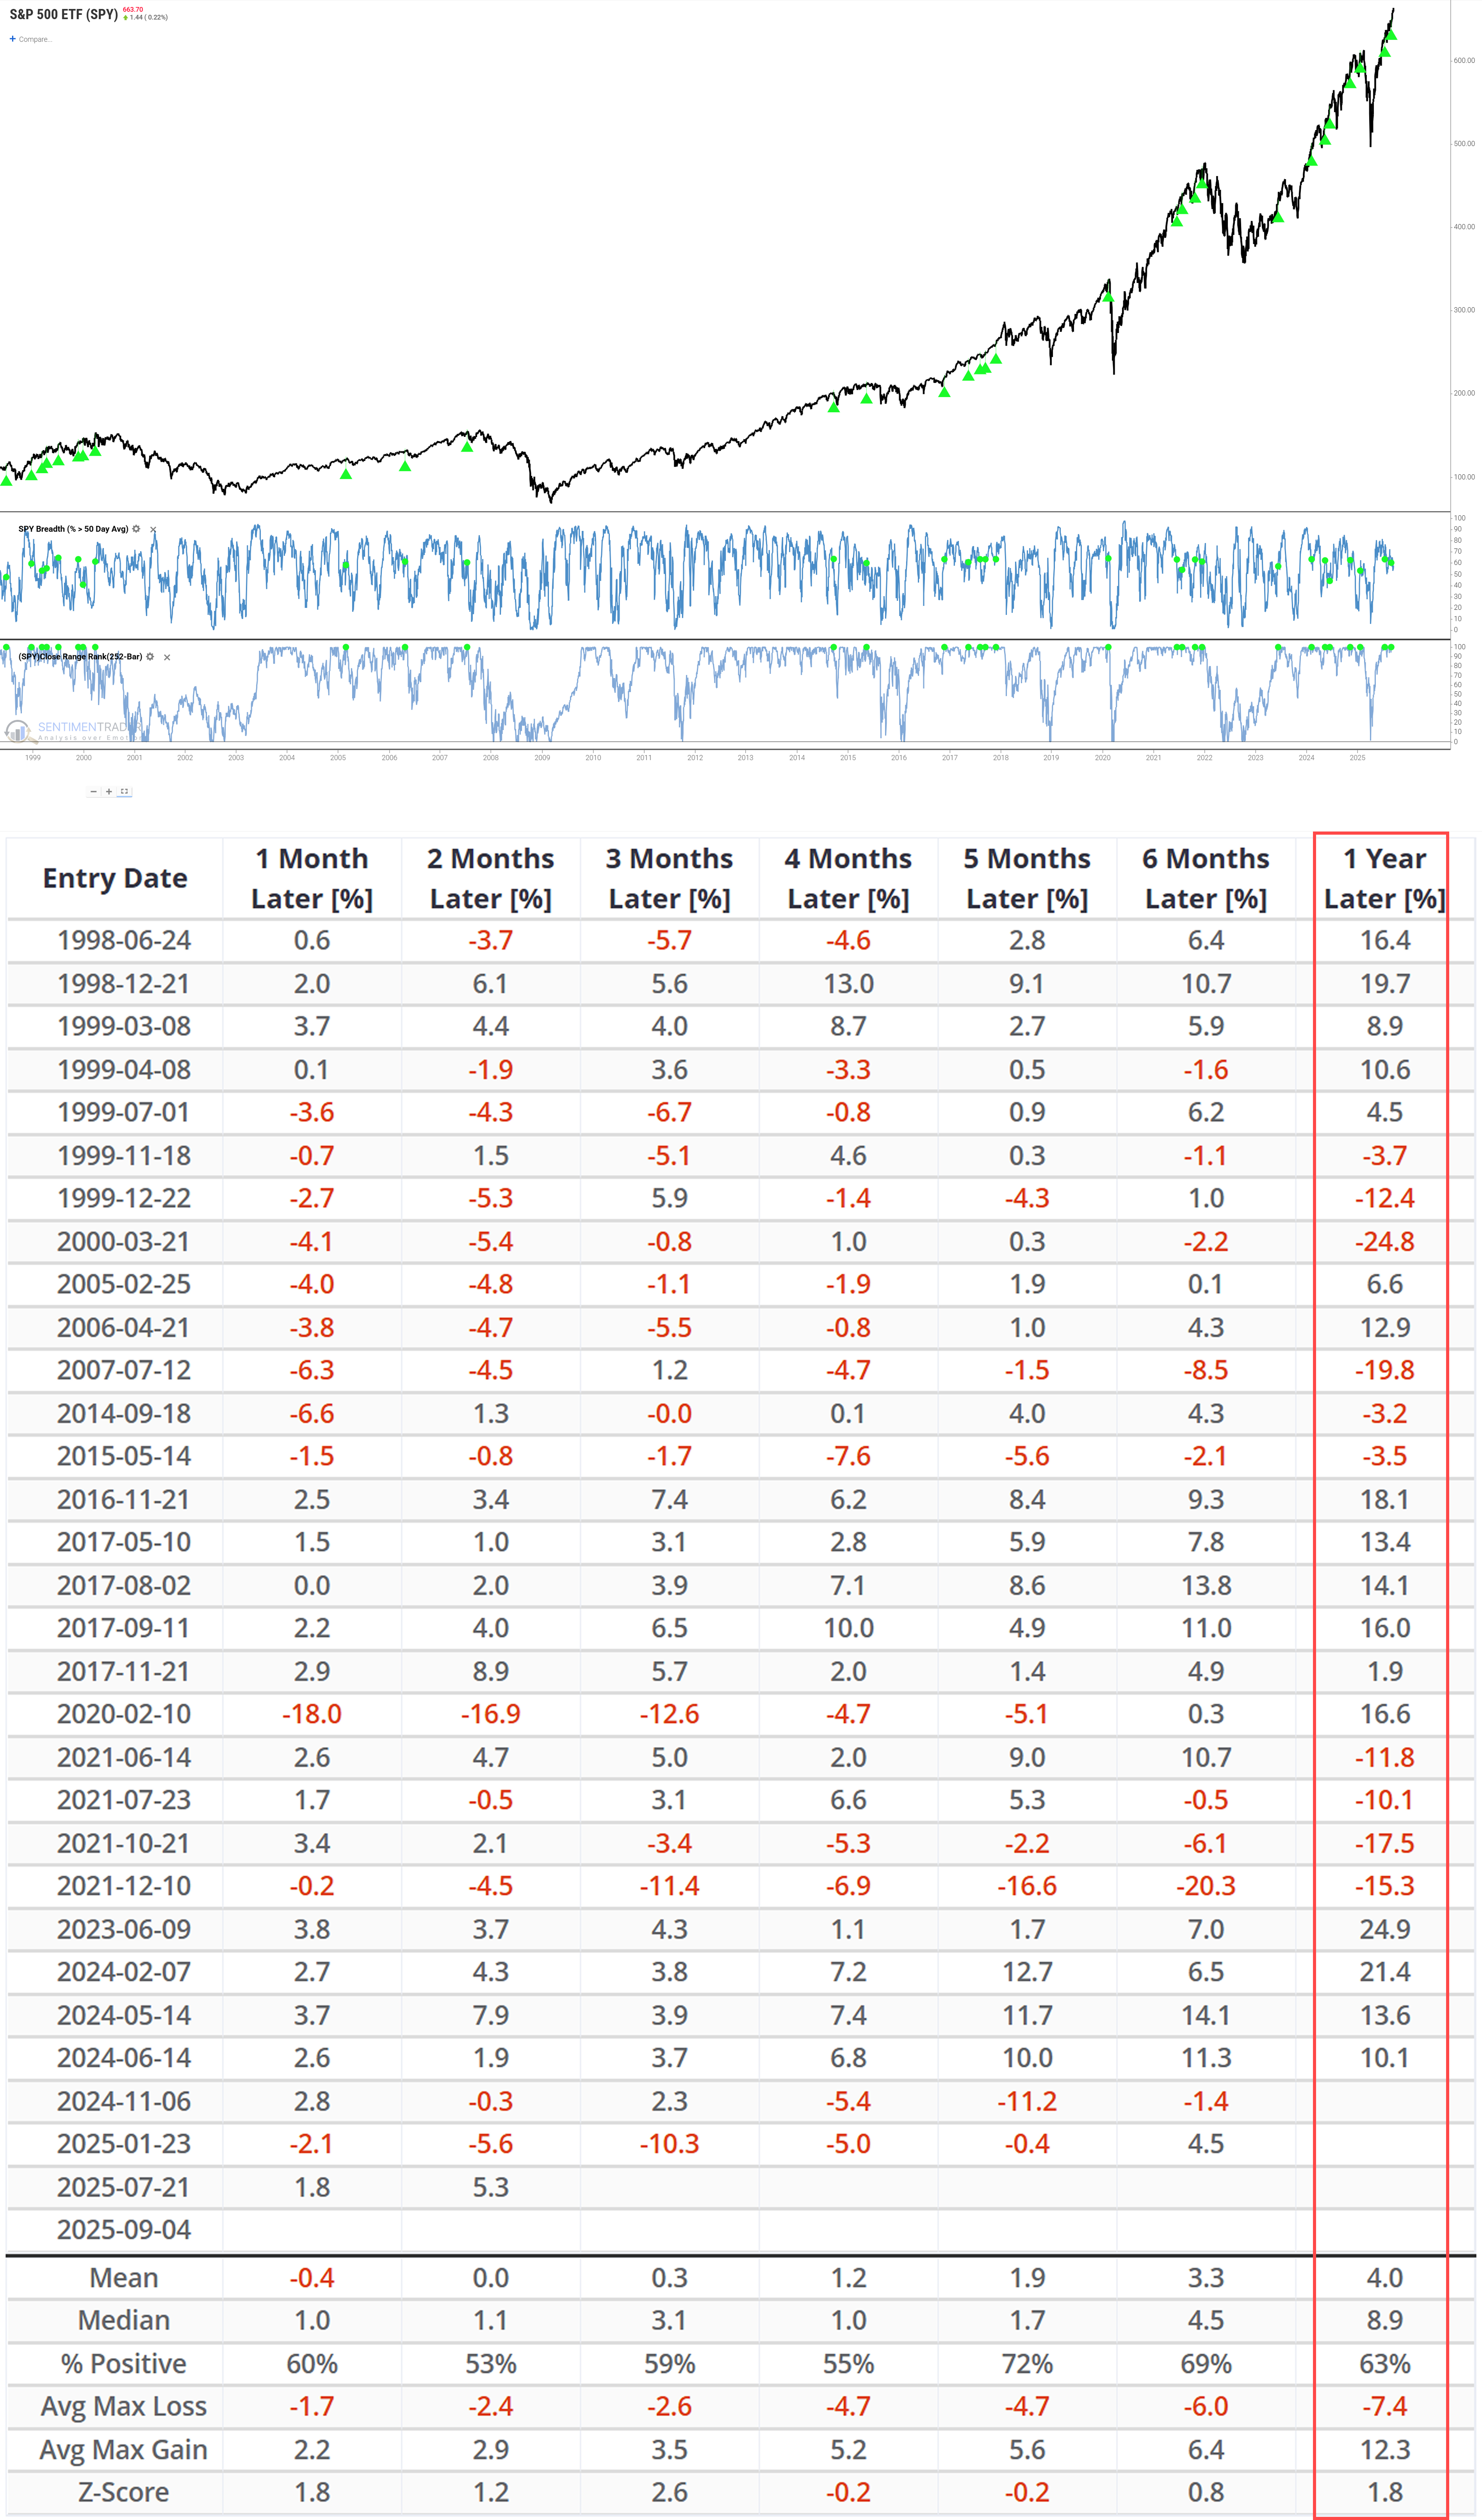
A healthy bull market breakthrough is usually driven by the participation of the vast majority of stocks-like a "thousand horses galloping"; an unhealthy breakthrough, however, may see only a few heavyweight "generals" (large-cap stocks) pulling the index, while most "soldier" stocks (mid-cap and small-cap stocks) have stagnated or even declined.
Unfortunately, the current market structure leans toward the latter. When the market hit a new all-time high last week, only 57.77% of S&P 500 components were trading above their 50-day moving average. We categorize all historical new highs into "strong" (>65% breadth) and "weak" (<65% breadth) based on participation breadth.
The current market environment clearly falls into the "weak" category. As shown in the table below, new highs with "weak breadth" have a median 1-year forward return of only +8.9% and a win rate of just 63%.Related Backtest Click Here.
Turning Point: "Safe Sector" Capitulation Is a Contradictory Bullish Signal
Just as we grow concerned about the market's short-term structure, another stronger signal emerges from the other end of the market-rooted precisely in the extreme weakness of the defensive sectors that triggered this rotation.
In investing, when everyone abandons "safety," this is often not the start of panic, but its end. This kind of "capitulation-style selling" has historically been a reliable leading indicator of market bottoms or the start of a new rally.
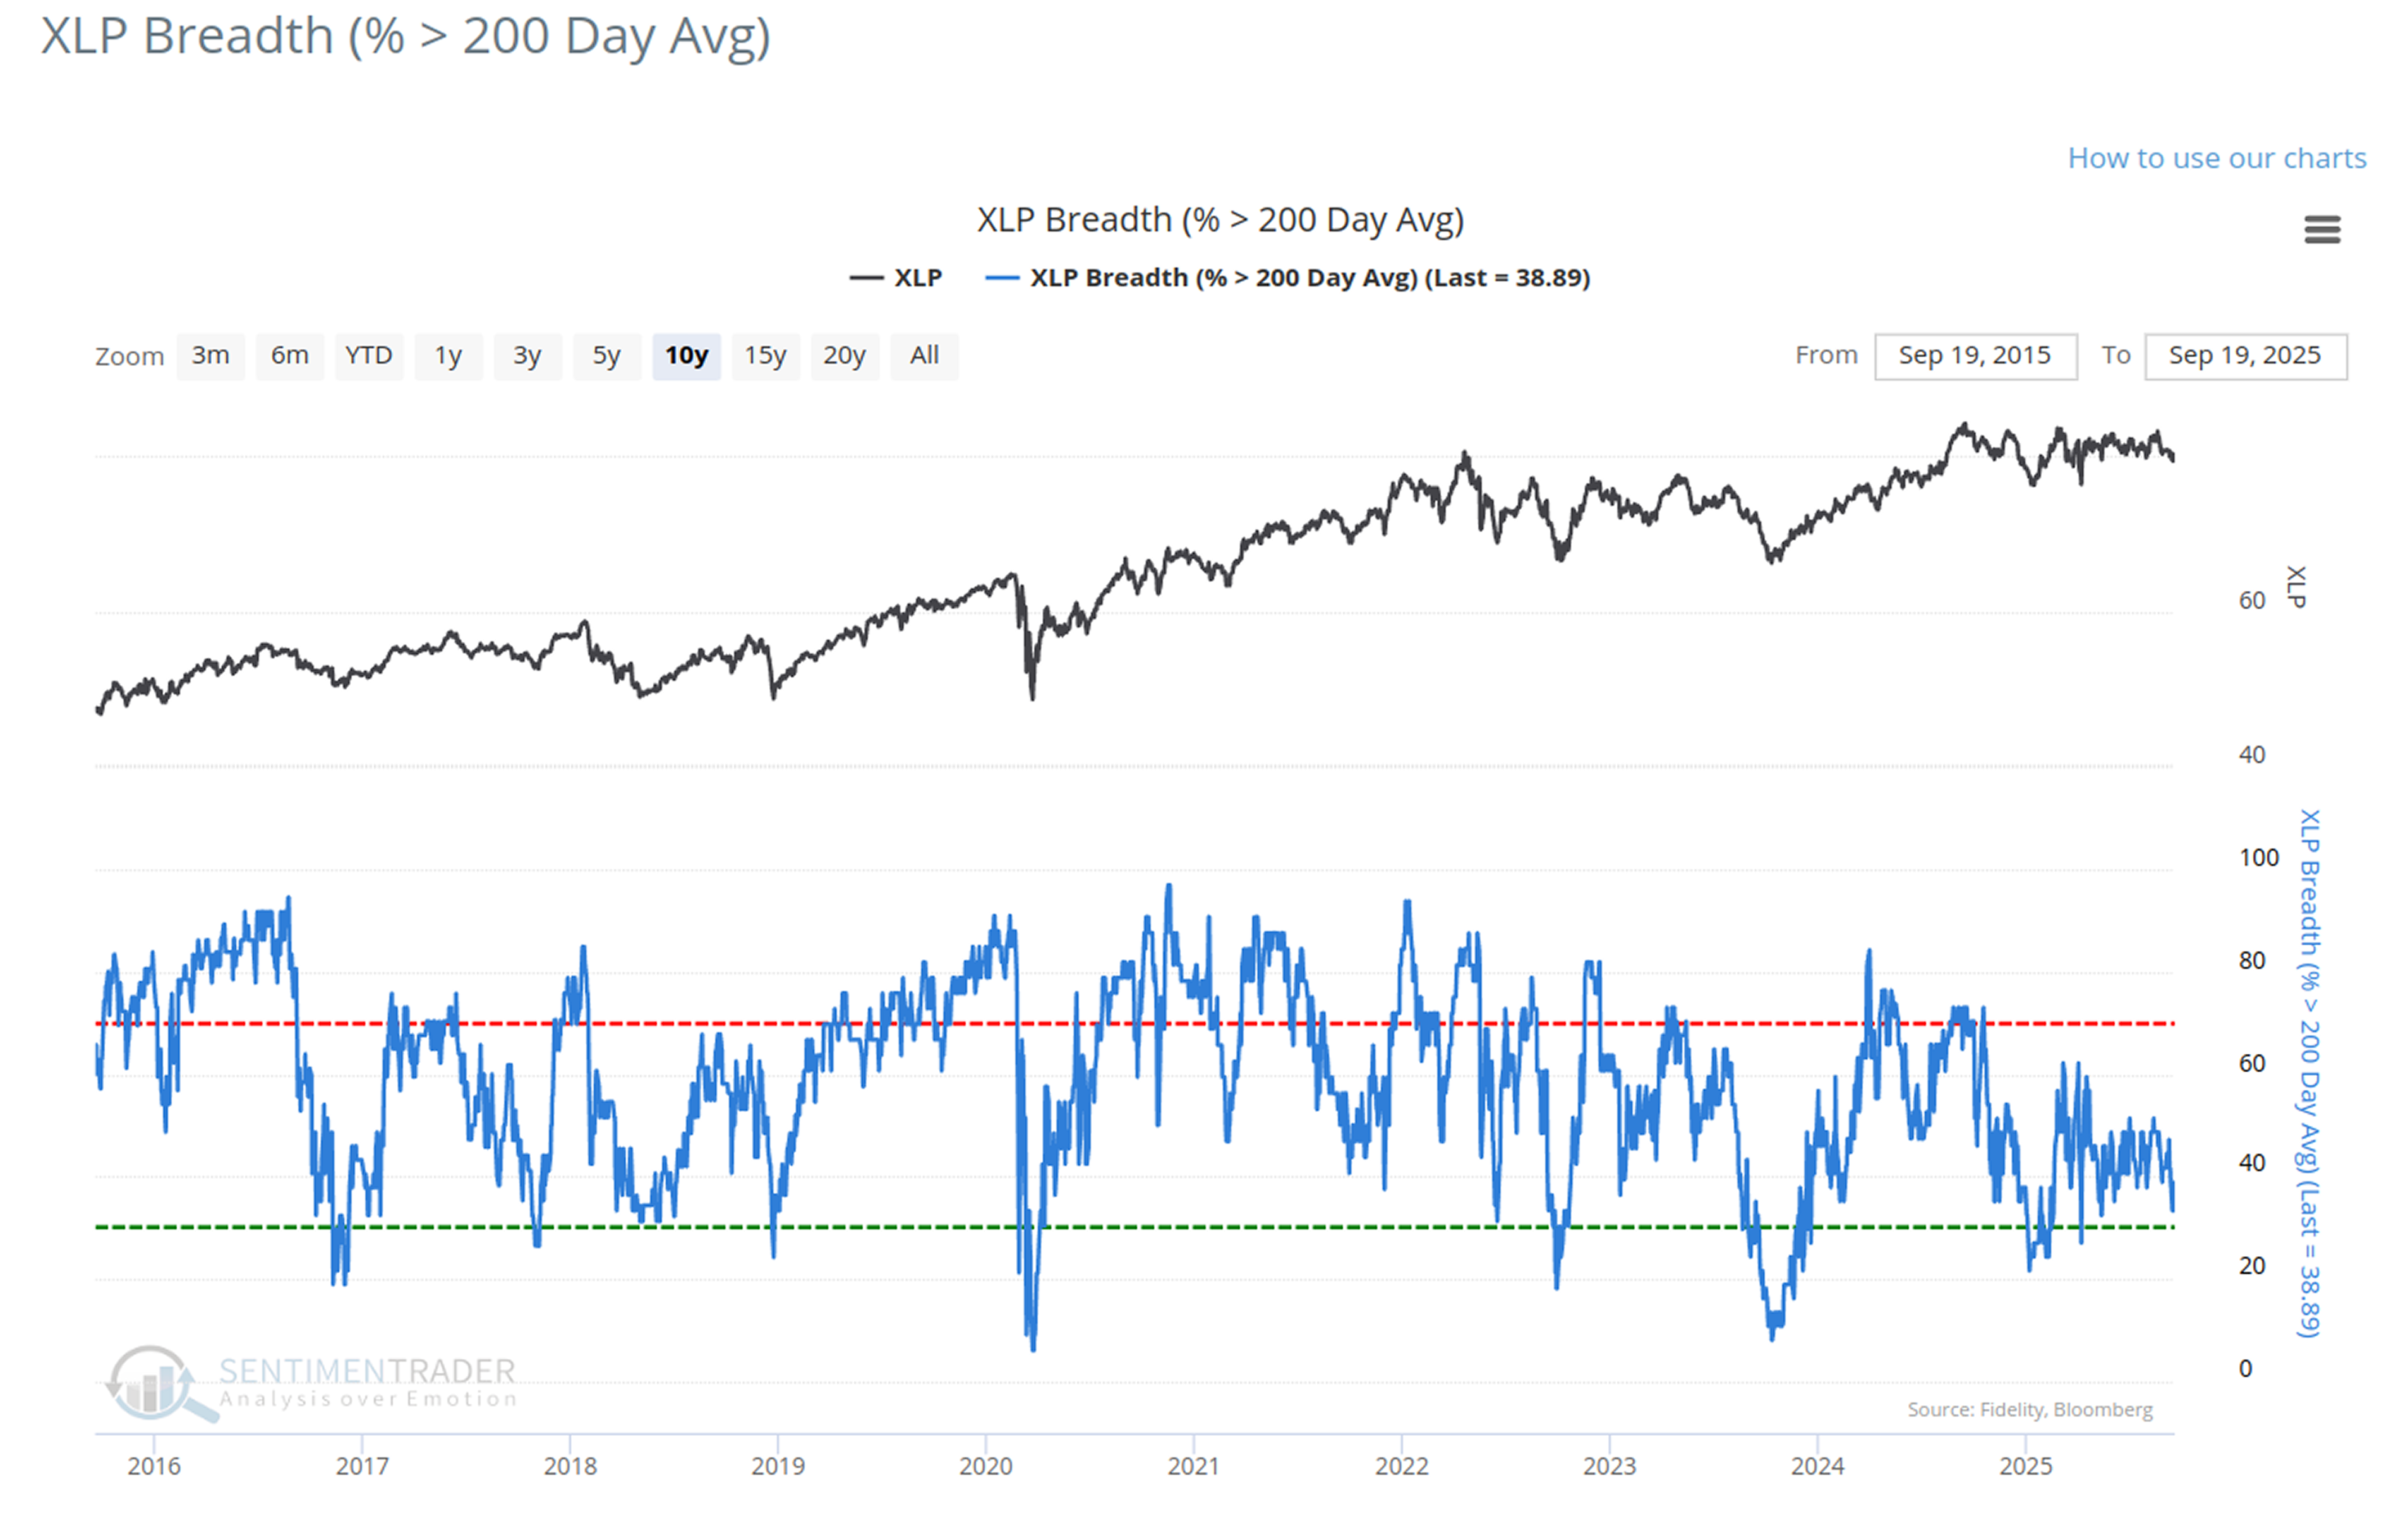
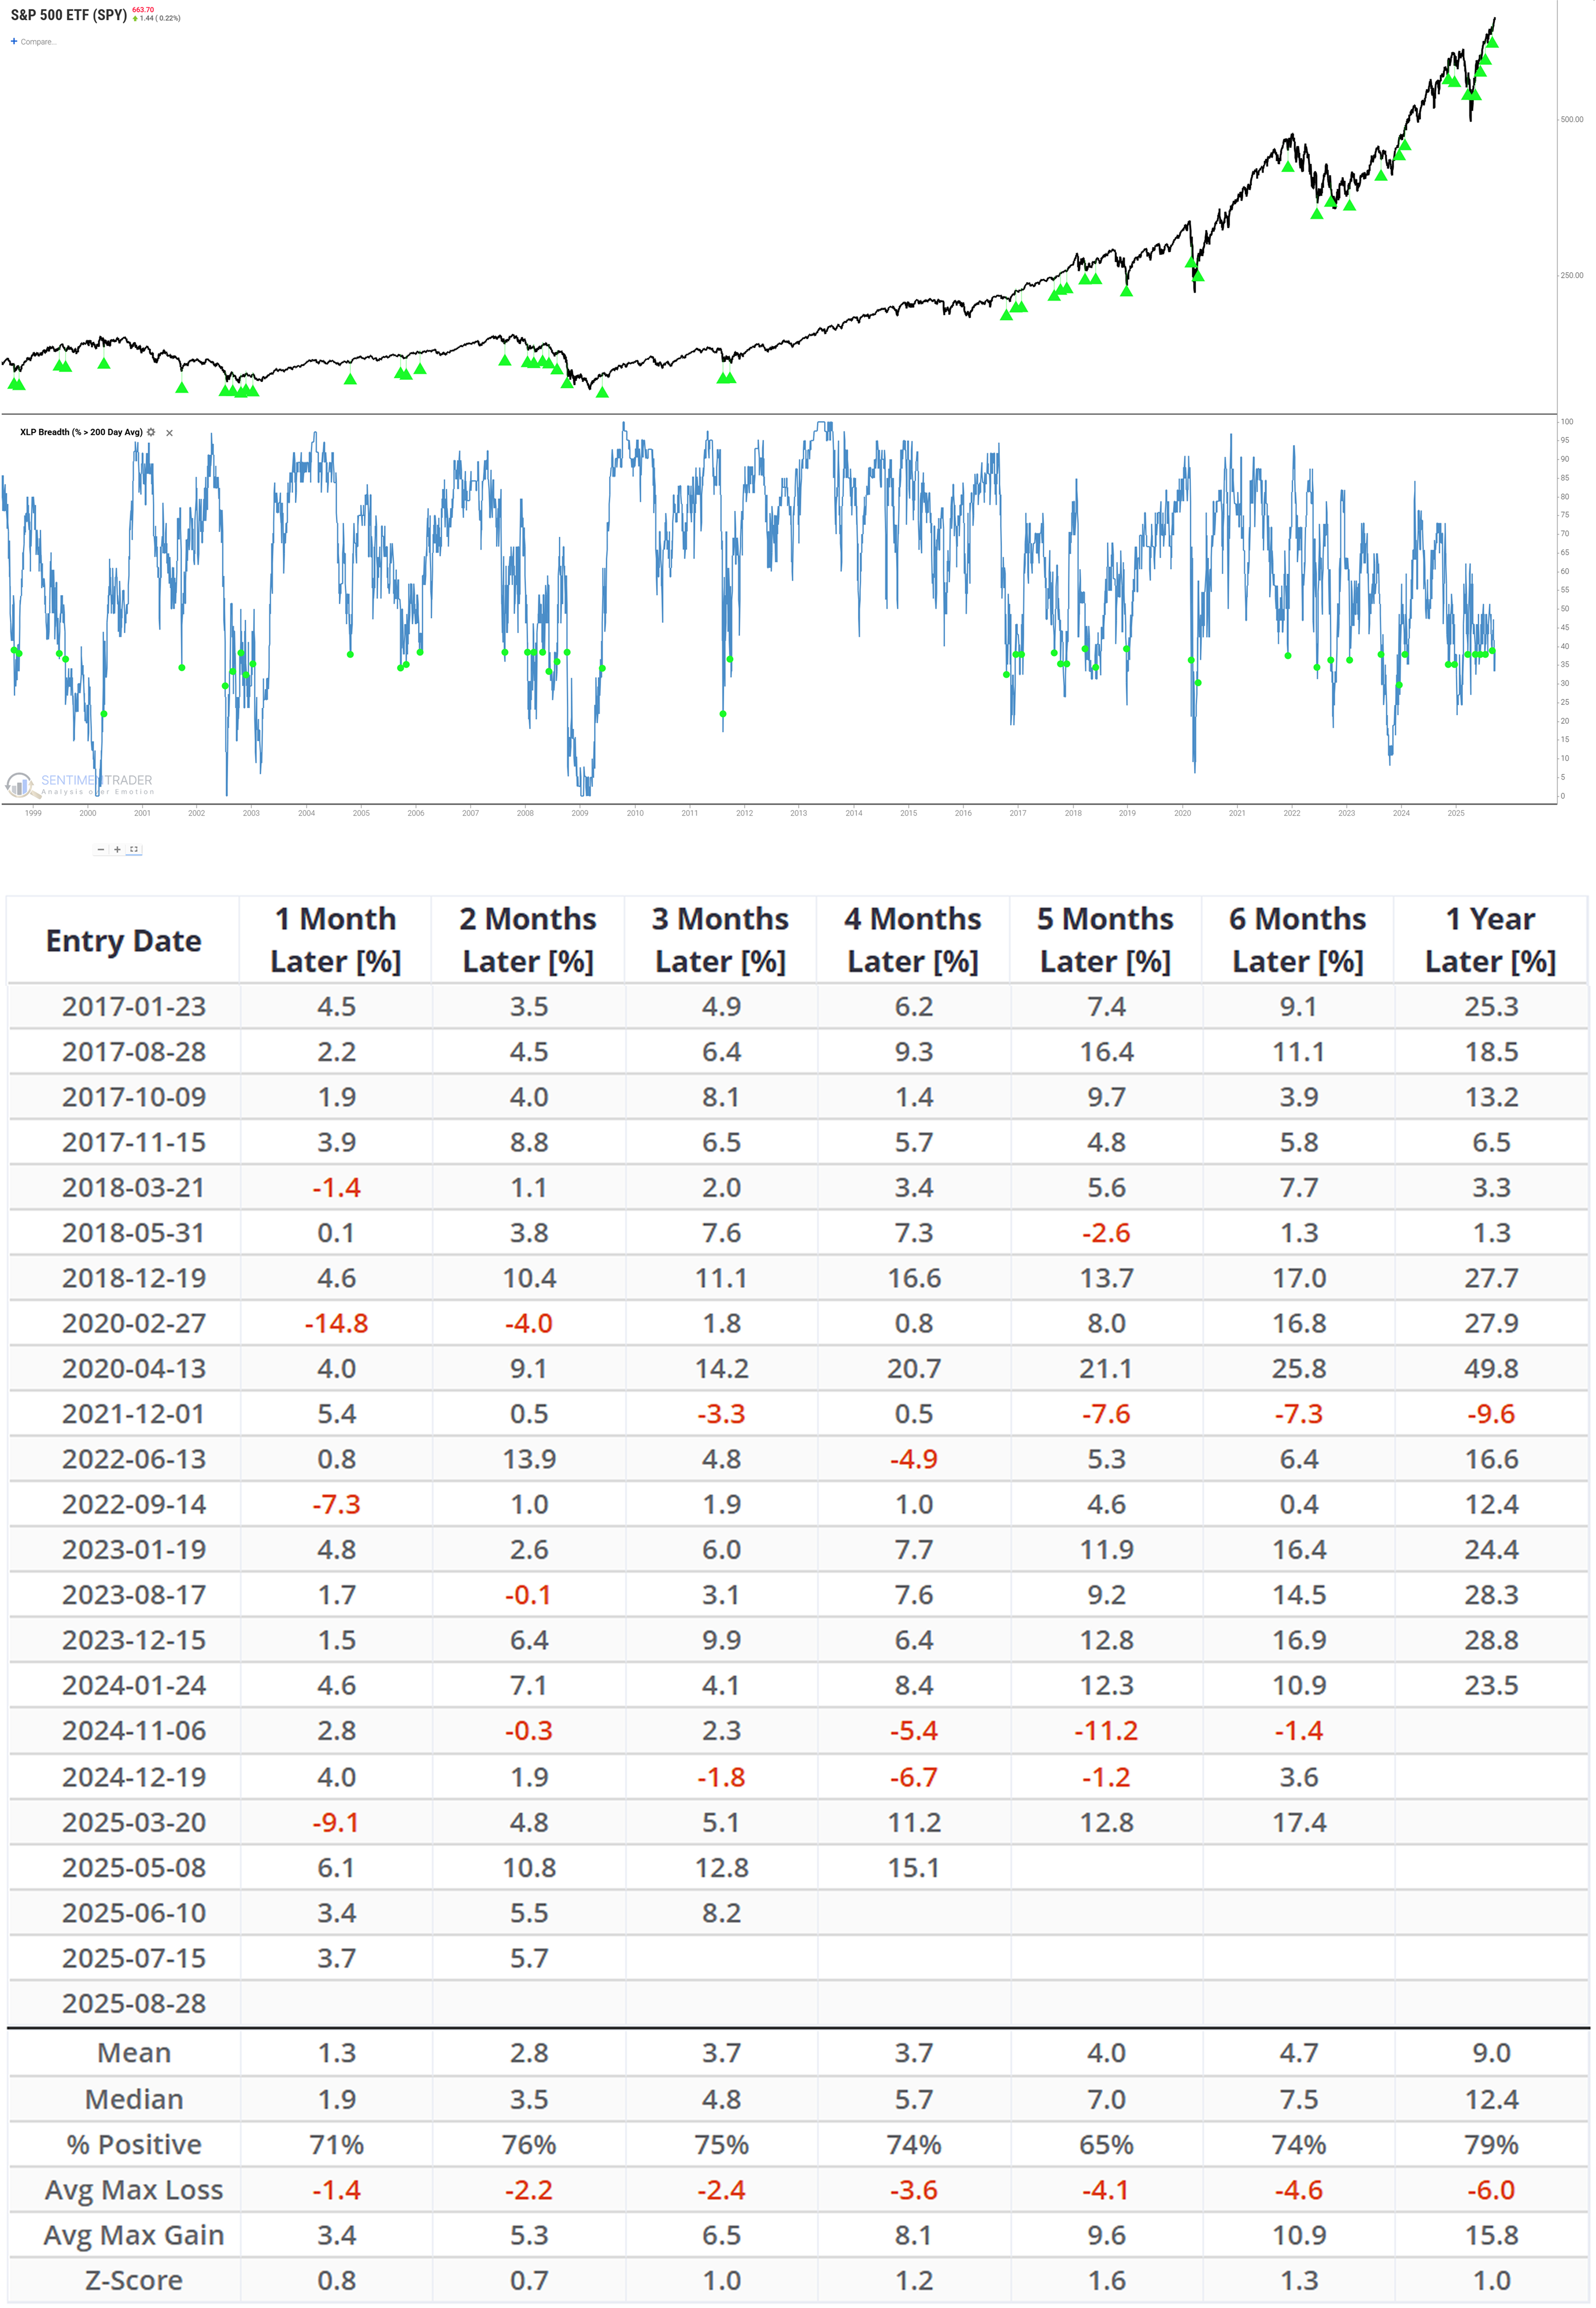
Our backtest data strongly supports this view. As shown in the table below, when the long-term health of the XLP Breadth (% > 200 Day Avg)-collapses to below 40% (currently 38.89%), the S&P 500's future performance becomes exceptionally strong.
After the signal is triggered, the market's median 1-year forward return reaches a high of +12.4%, with a win rate of 79%. This indicates that while the market's surface structure appears fragile, its underlying sentiment indicators may have already bottomed out.Related Backtest Click Here.
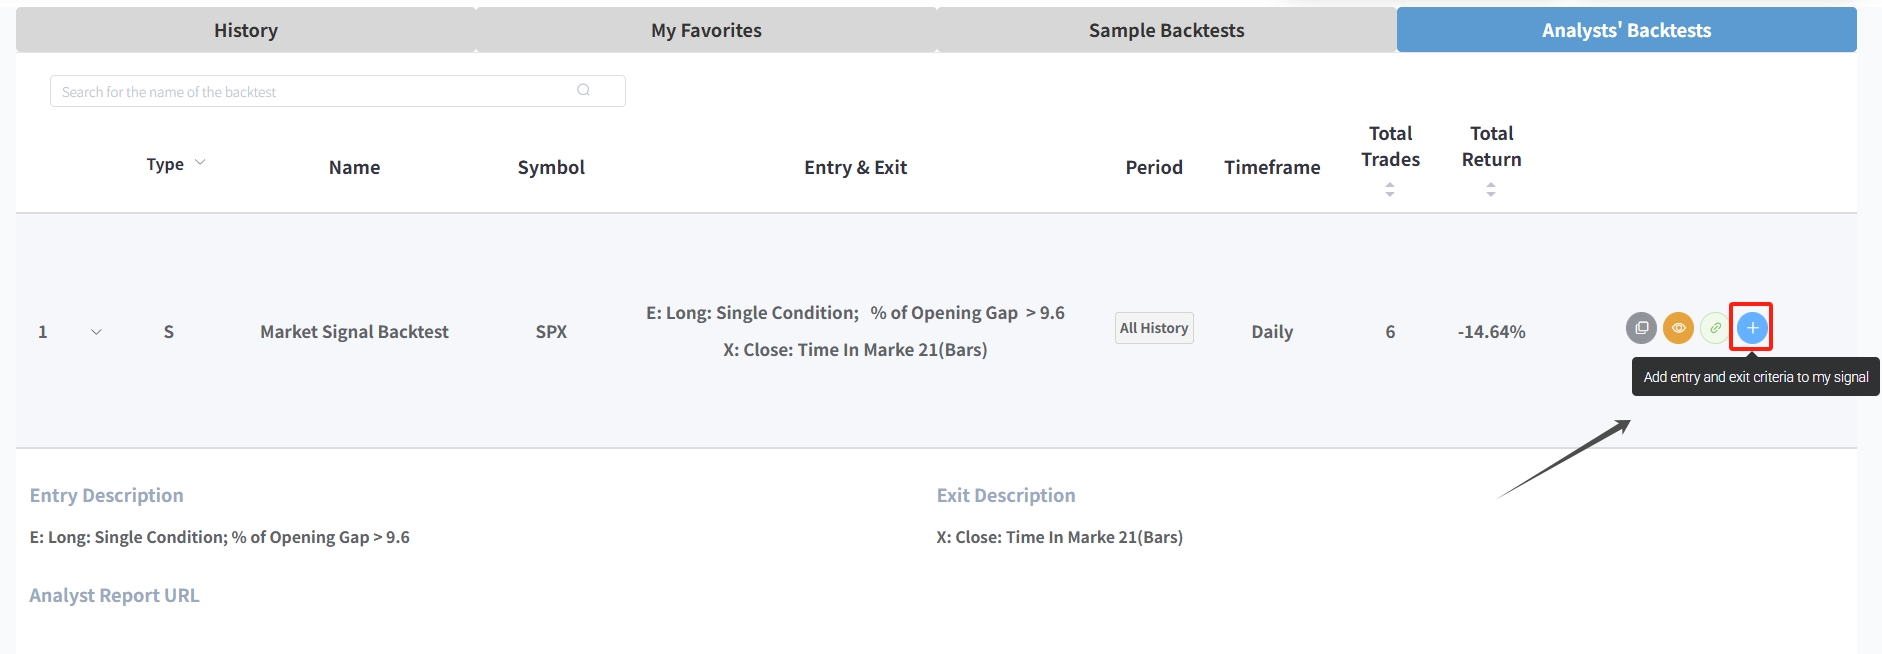
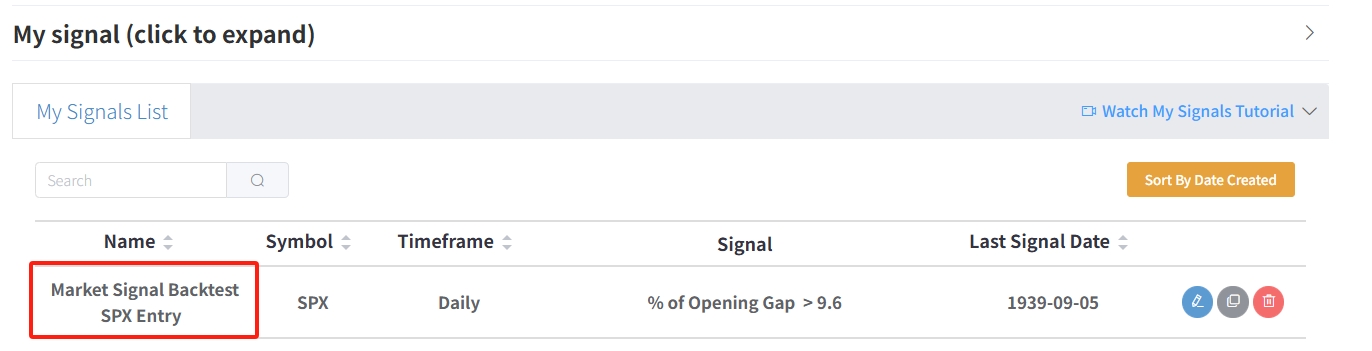
Never miss a crucial signal again. The Analysts' Backtests interface now features a "+ Add to My Signals" button that lets you instantly import entry and exit criteria from any analyst's backtest (e.g., a Trend Tracking Backtest, Market Signal Backtest, or other strategy) into your personal My Signals List.
What the Research Tells Us...
The current market structure presents us with a complex and contradictory puzzle. On one hand, a powerful, medium-to-long-term bullish signal (defensive sector capitulation)-repeatedly validated by history-has been clearly triggered, providing long-term investors with a solid reason to remain cautiously optimistic.
On the other hand, we must never ignore the significant near-term risks. The market's short-term structure is fragile: the recent all-time highs lack broad internal support, and this pattern has historically been associated with high volatility and significant pullback risks. This is a clear signal that the market is highly vulnerable to negative shocks in the short term.
Therefore, the final conclusion is not a simple "bullish" or "bearish" prediction. A more accurate description is: the market's medium-to-long-term "tailwinds" are colliding head-on with an unstable short-term structure. This means the market is likely to experience higher-than-usual volatility in the coming months. While the long-term scales may tilt toward bulls, any investment decision must treat this potential short-term volatility as a core risk factor. For investors, understanding and balancing this short-term and long-term contradiction based on their own investment horizons will be the key to success in the period ahead.