Products
SentimenTrader Trading Tools
‍
Backtest Engine
My Trading Toolkit
Correlation Analysis
Seasonality
Market Prediction
Indicators & Data API
‍
Proprietary Indicators & Charts
Market Data API
Strategies & Scanner
‍
50+ Trading Strategies
Smart Stock Scanner
Smart Option Scanner
Research Reports
‍
Research Solutions
Reports Library
Free Resources
Simple Backtest Calculator
Simple Seasonality Calculator
The Kelly Criterion Calculator
Sentiment Geo Map
Public Research Reports
Education
Sentiment Indicators
Technical Indicators
Pricing
Company
About
In the News
Testimonials
Client Success Stories
Contact
Log inLoginSign up
< BACK TO ALL REPORTS

Broad-based breakouts to all-time highs

by Sentimentrader
2025-09-22
Following a six-month low, four major U.S. equity indexes recorded an all-time high in the same week for the first time since 2020. Similar breakouts suggest the uptrend in stocks persists, favoring Nasdaq and small-cap stocks in the near-term.

Key points:

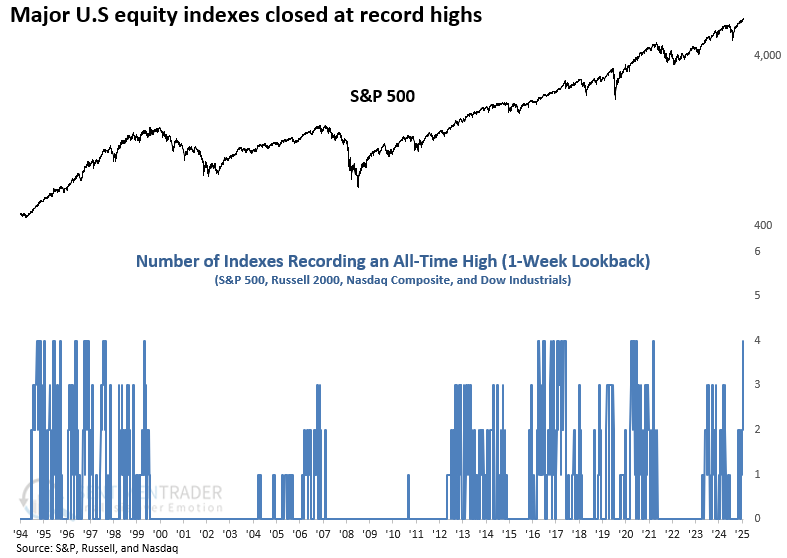
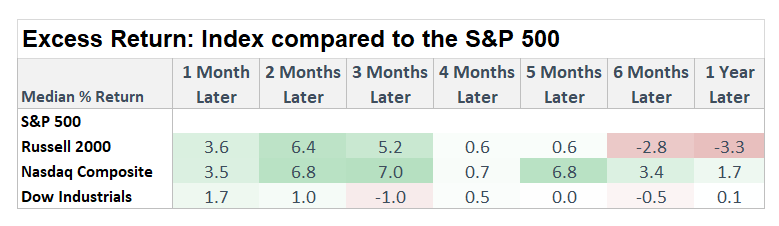
  • Record highs were reached by the S&P 500, Russell 2000, Nasdaq Composite, and Dow Industrials
  • The synchronized character of recent breakouts signals that the uptrend in equites persists
  • The Russell 2000 and Nasdaq Composite outperformed the S&P 500 over a medium-term horizon

Indexes suggest a broadening market backdrop

Last week marked a pivotal moment of broad market strength, as the S&P 500, Russell 2000, Nasdaq Composite, and Dow Industrials all closed at record highs together for the first time since 2020, isolating the first instance after a 6-month low in the S&P 500. The synchronized breakout across these four closely watched benchmarks underscores the depth of the rally, with large caps, small caps, growth stocks, and blue chips all participating.

Such alignment across major indexes has historically signaled favorable momentum, as leadership is not confined to a single corner of the market but instead reflects widespread investor confidence and risk appetite. This type of broad confirmation adds weight to the rally and reduces concerns that gains are overly concentrated. 

The uptrend is likely to persist

Although the sample size is limited, history shows that when a broad mix of benchmark indexes hit record highs in the same week, the S&P 500 often faltered in the following month before resuming its climb, implying the uptrend in equities has staying power. 

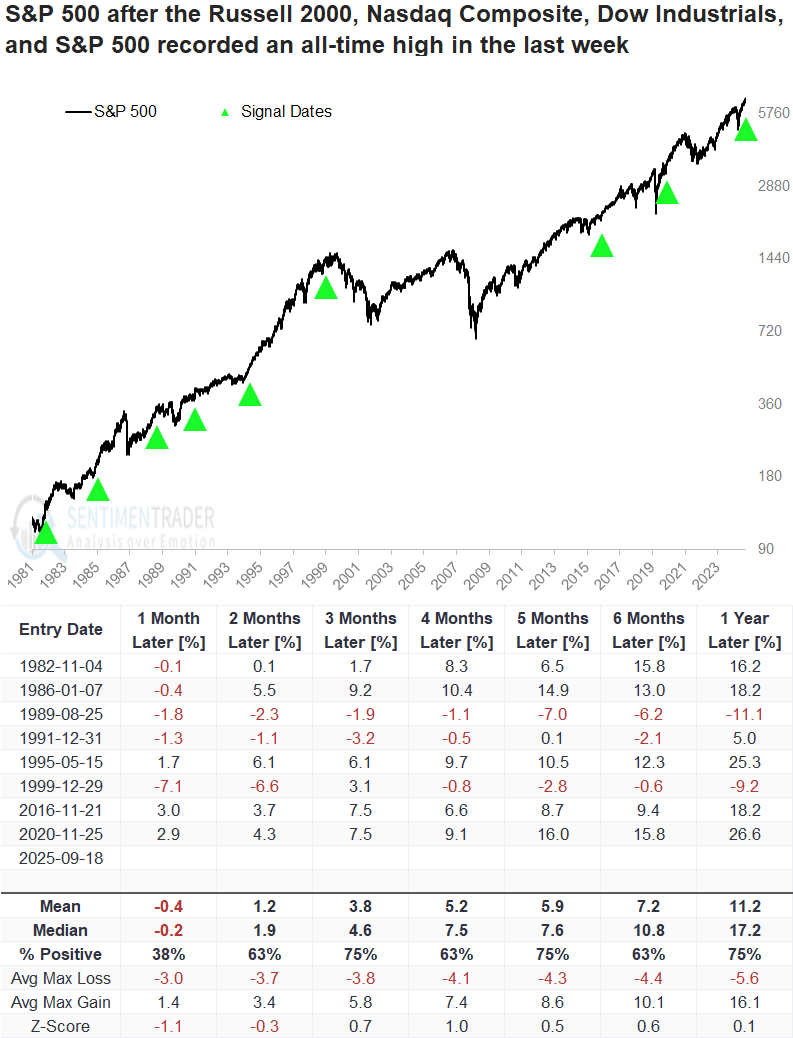
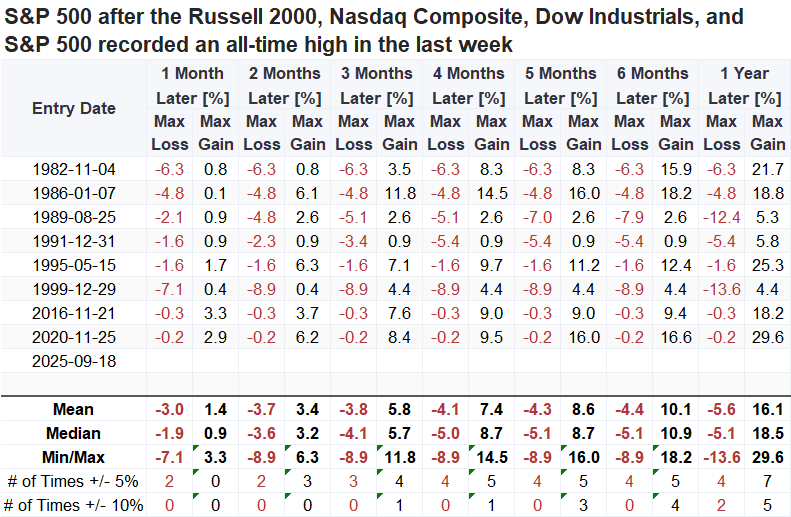
Over the following six months, the S&P 500 avoided a drawdown of 10% or more, though both 1989 and 1999 came close. In those cases, the larger declines materialized later.

The Russell 2000 and Nasdaq Composite delivered strong gains over the following three months, suggesting investors should stick with growth stocks and look for opportunities in small caps. 

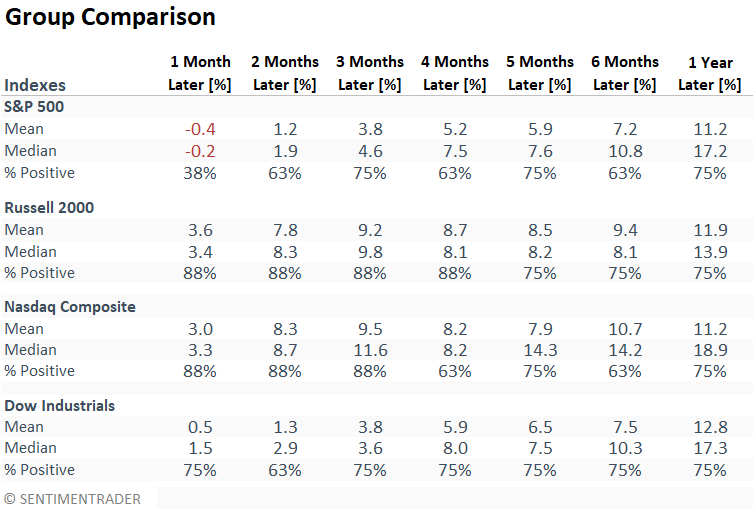
The Nasdaq Composite showed the most reliable relative outperformance across all time frames, indicating that investors may want to maintain exposure to growth and tech stocks. In contrast, the Russell 2000 exhibited strong relative performance early on, but that strength diminished over more extended periods.

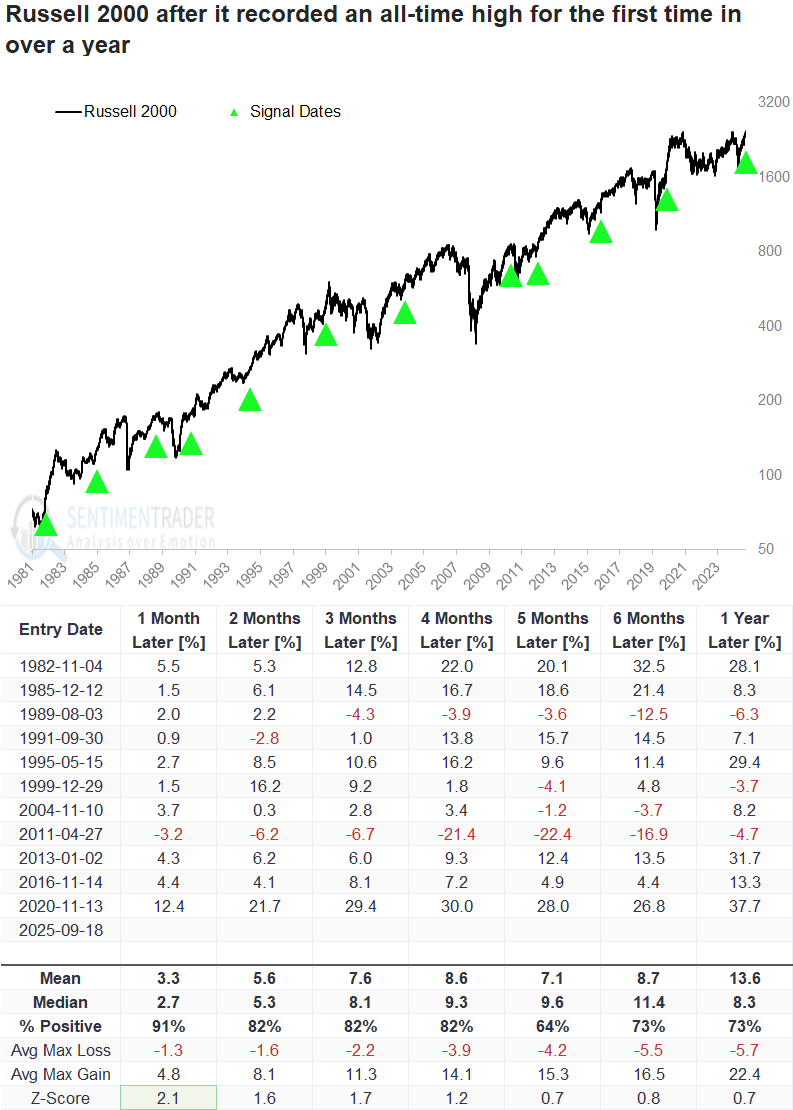
New record high in Russell 2000

The Russell 2000 recorded its first record high since November 2021. When a record high occurred for the first time in more than a year, the small-cap index rallied over the subsequent month in all but one instance. This upward momentum often extends through the four-month mark, which would overlap with a typically strong seasonal period for small caps in Q4.

That said, I view the opportunity as a trade, not an investment.


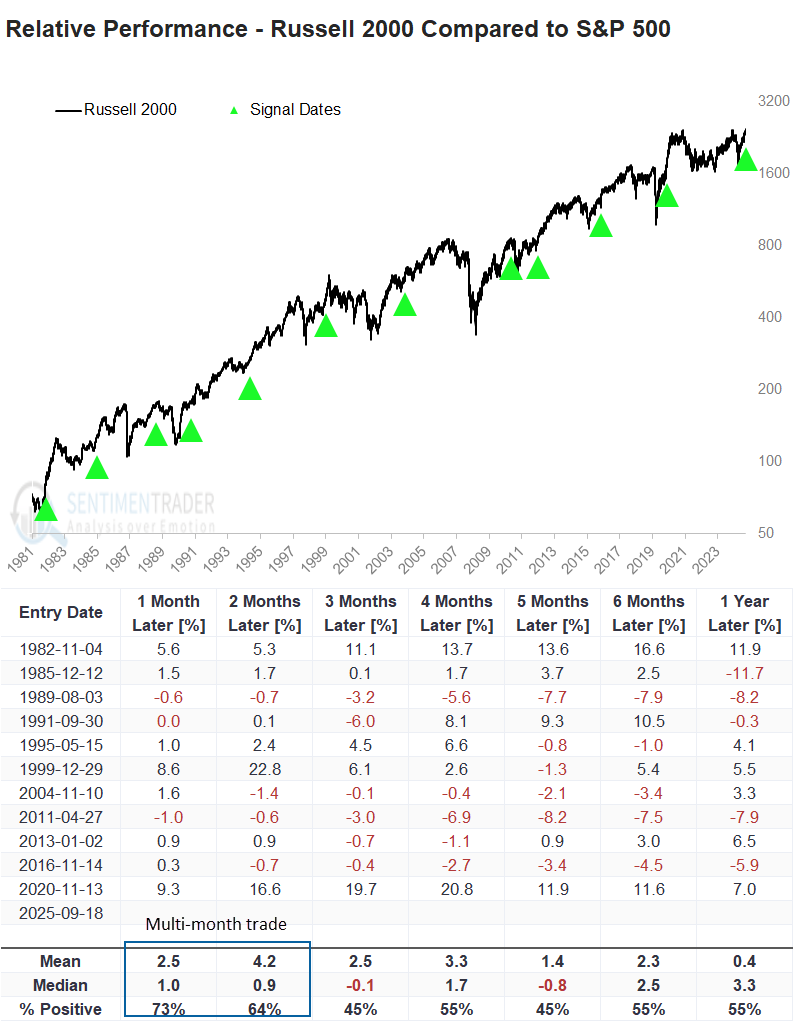
The Russell demonstrated the strongest tendency to outperform the S&P 500 during the first few months, consistent with the results of the breakout study. 

What the research tells us...

Four major U.S. equity indexes recently hit record highs in a rare, synchronized rally. This breakout, now encompassing small-cap stocks, points to a broadening uptrend that could support continued gains. Historically, the Nasdaq Composite has tended to outperform the S&P 500 over the following year, while the Russell 2000 often shows healthy near-term gains before fading over more extended periods. Therefore, investors should treat small-cap exposure as a tactical trade rather than a long-term investment.

PRODUCTS
SentimenTrader
Trading Tools
Indicators & Data API
‍
Strategies & Scanner
‍
Research Reports
FREE
RESOUrCES
Simple Backtest
Calculator
Simple Seasonality
Calculator
The Kelly Criterion
Calculator
Sentiment Geo Map
‍
Public Research Reports
‍
Education
Sentiment Indicators
‍
Technical Indicators
‍
Pricing
Bundle pricing
‍
FAQ
‍
Announcements
‍
COMPANY
‍
About
‍
In the News
‍
Testimonials
‍
Client Success Stories
CONTACT
‍
General Inquiries
‍
Media Inquiries
‍
Financial Professionals Inquiries
‍
© 2026 Sundial Capital Research Inc. All rights reserved.
Setsail Marketing
TermsPrivacyAffiliate Program
Risk Disclosure: The information and tools provided are for research and analytical purposes only and are not intended as investment advice. Market analysis involves uncertainty, and outcomes may differ from expectations. Users should conduct their own due diligence and consider their individual circumstances before making any financial decisions. Past performance is not necessarily indicative of future results.

Hypothetical Performance Disclosure: Hypothetical performance results have many inherent limitations, some of which are described below. No representation is being made that any account will or is likely to achieve profits or losses similar to those shown; in fact, there are frequently sharp differences between hypothetical performance results and the actual results subsequently achieved by any particular trading program. One of the limitations of hypothetical performance results is that they are generally prepared with the benefit of hindsight. In addition, hypothetical trading does not involve financial risk, and no hypothetical trading record can completely account for the impact of financial risk of actual trading. for example, the ability to withstand losses or to adhere to a particular trading program in spite of trading losses are material points which can also adversely affect actual trading results. There are numerous other factors related to the markets in general or to the implementation of any specific trading program which cannot be fully accounted for in the preparation of hypothetical performance results and all which can adversely affect trading results.

Testimonial Disclosure: Testimonials appearing on this website may not be representative of other clients or customers and is not a guarantee of future performance or success.