Products
SentimenTrader Trading Tools
‍
Backtest Engine
My Trading Toolkit
Correlation Analysis
Seasonality
Market Prediction
Indicators & Data API
‍
Proprietary Indicators & Charts
Market Data API
Strategies & Scanner
‍
50+ Trading Strategies
Smart Stock Scanner
Smart Option Scanner
Research Reports
‍
Research Solutions
Reports Library
Free Resources
Simple Backtest Calculator
Simple Seasonality Calculator
The Kelly Criterion Calculator
Sentiment Geo Map
Public Research Reports
Education
Sentiment Indicators
Technical Indicators
Pricing
Company
About
In the News
Testimonials
Client Success Stories
Contact
Log inLoginSign up
< BACK TO ALL REPORTS

Breath thrust as long-term momentum reaches inflection point

Jason Goepfert
2020-09-29
Stocks enjoyed a broad thrust on Monday as an overwhelming percentage of securities advanced. Coming off of a pullback within an uptrend, that has been a good sign. The long-term McClellan Summation Index fell below zero, though, which bears watching as momentum ebbs.

On Monday, stocks enjoyed a broad surge. We noted that the Up Issues Ratio jumped above 85%, which is relatively rare in an uptrending market. There are all kinds of securities that trade on the NYSE, and getting an overwhelming percentage of them to point the same way is like herding cats.

Using a lesser extreme for the test, we can see that forward returns were still very positive.

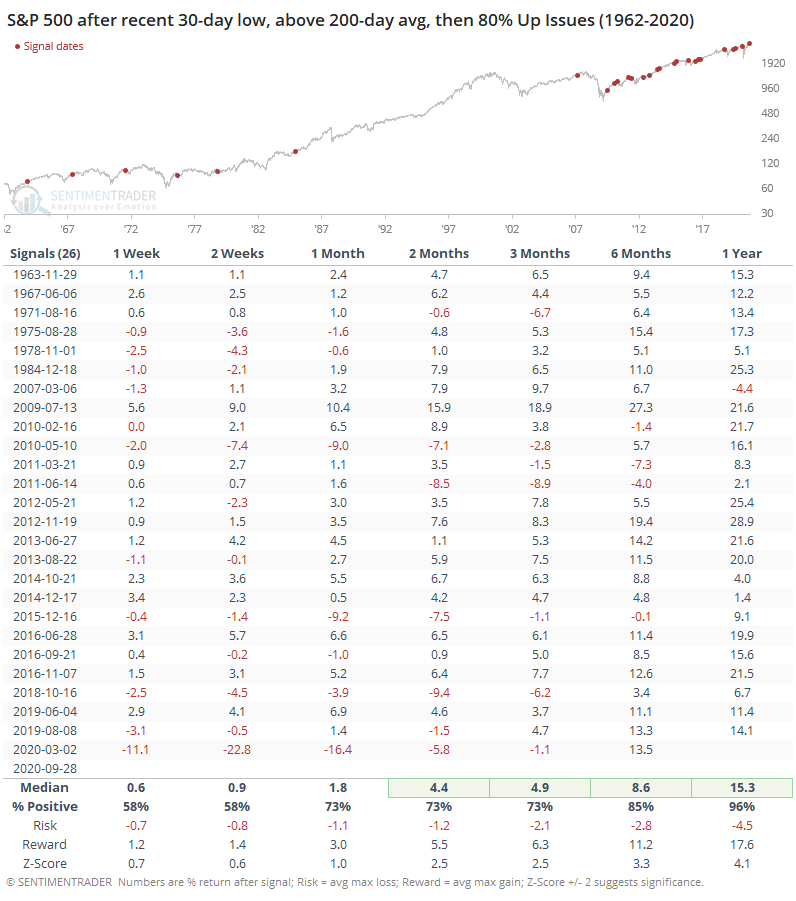
Thanks in part to decimalization, breadth metrics have become more volatile, and so we've seen most of these extremes in just the past decade. Because it was dominated by a persistent bull market, after these signals there were only 4 losses over the next 6 months, and 2 of those were tiny. The risk/reward was heavily skewed to the "reward" side. A year later, there was only 1 small loss out of 26 signals.

The thrust came just as the long-term McClellan Summation Index dropped into negative territory.

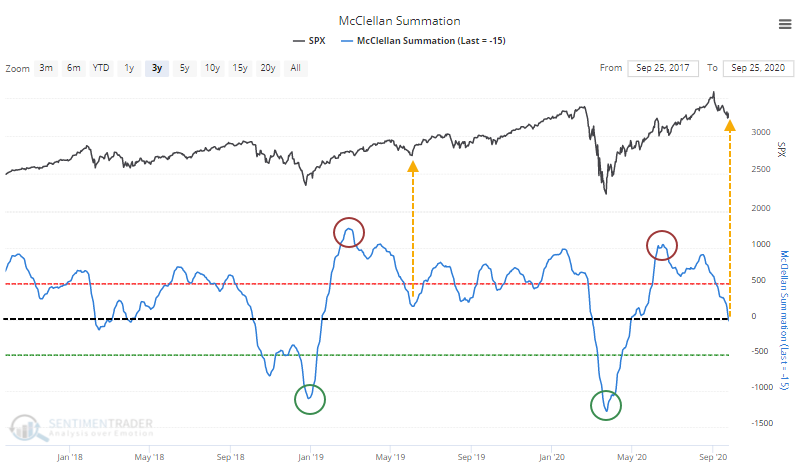
The last time the Summation Index cycled from extreme oversold to extreme overbought within a year, then drifted down toward zero was in May 2019. Buying pressure can in soon and the Summation Index never quite made it down to zero. When it did, forward returns were mostly positive and risk was small.

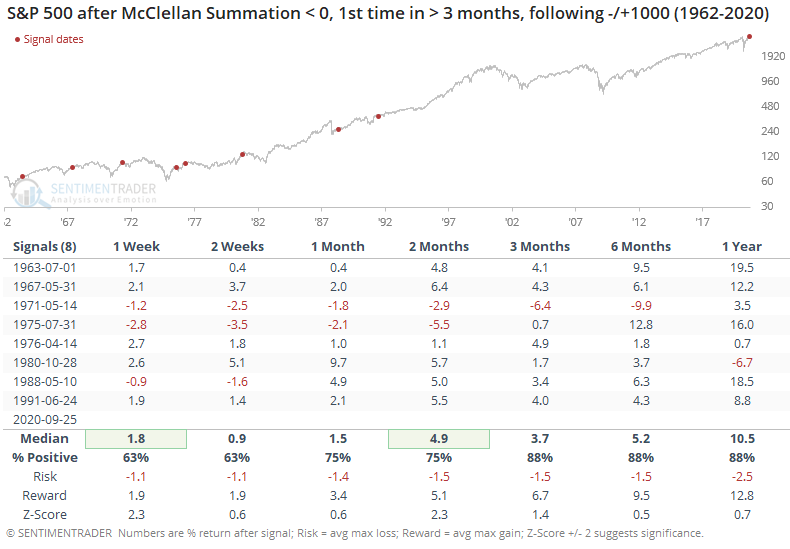
If we ignore the oversold reading and just look for the first dip below zero for the first time in months, following a big overbought reading, then returns were still good.

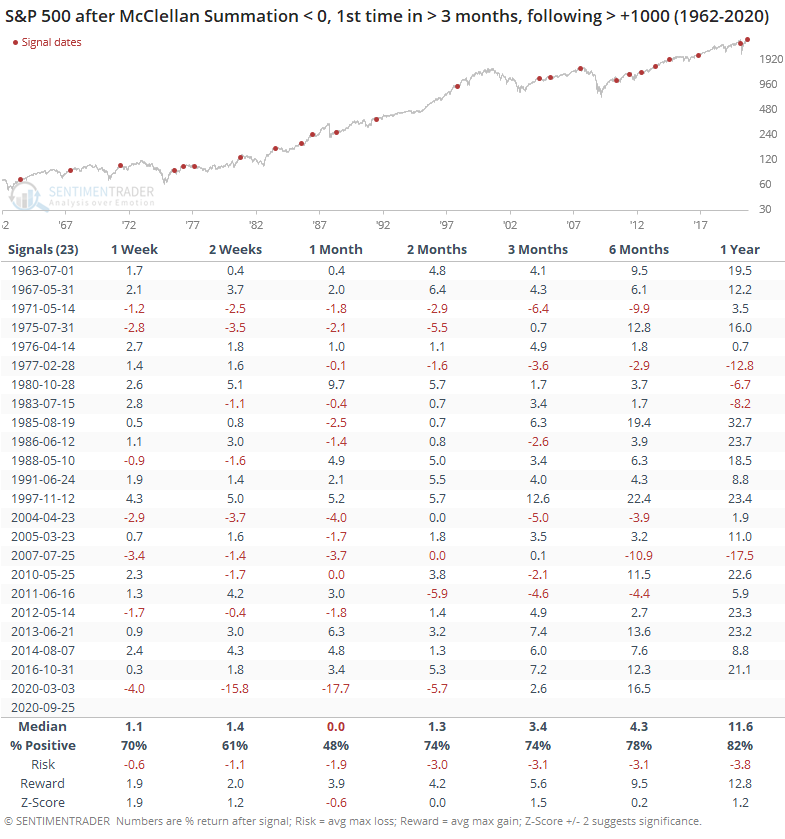
The Summation Index is one of the indicators we monitor to determine the overall market environment. When it's below zero and declining but not yet oversold, it's the worst possible combination. The only caveat here is that it's been above zero for a long time and coming off a very high reading, showing notable positive momentum. That suggests any dip here could be smaller than usual, and a curl up in the Summation Index would help confirm that.

PRODUCTS
SentimenTrader
Trading Tools
Indicators & Data API
‍
Strategies & Scanner
‍
Research Reports
FREE
RESOUrCES
Simple Backtest
Calculator
Simple Seasonality
Calculator
The Kelly Criterion
Calculator
Sentiment Geo Map
‍
Public Research Reports
‍
Education
Sentiment Indicators
‍
Technical Indicators
‍
Pricing
Bundle pricing
‍
FAQ
‍
Announcements
‍
COMPANY
‍
About
‍
In the News
‍
Testimonials
‍
Client Success Stories
CONTACT
‍
General Inquiries
‍
Media Inquiries
‍
Financial Professionals Inquiries
‍
© 2026 Sundial Capital Research Inc. All rights reserved.
Setsail Marketing
TermsPrivacyAffiliate Program
Risk Disclosure: The information and tools provided are for research and analytical purposes only and are not intended as investment advice. Market analysis involves uncertainty, and outcomes may differ from expectations. Users should conduct their own due diligence and consider their individual circumstances before making any financial decisions. Past performance is not necessarily indicative of future results.

Hypothetical Performance Disclosure: Hypothetical performance results have many inherent limitations, some of which are described below. No representation is being made that any account will or is likely to achieve profits or losses similar to those shown; in fact, there are frequently sharp differences between hypothetical performance results and the actual results subsequently achieved by any particular trading program. One of the limitations of hypothetical performance results is that they are generally prepared with the benefit of hindsight. In addition, hypothetical trading does not involve financial risk, and no hypothetical trading record can completely account for the impact of financial risk of actual trading. for example, the ability to withstand losses or to adhere to a particular trading program in spite of trading losses are material points which can also adversely affect actual trading results. There are numerous other factors related to the markets in general or to the implementation of any specific trading program which cannot be fully accounted for in the preparation of hypothetical performance results and all which can adversely affect trading results.

Testimonial Disclosure: Testimonials appearing on this website may not be representative of other clients or customers and is not a guarantee of future performance or success.