Products
SentimenTrader Trading Tools
‍
Backtest Engine
My Trading Toolkit
Correlation Analysis
Seasonality
Indicators & Data API
‍
Proprietary Indicators & Charts
Market Data API
Strategies & Scanner
‍
50+ Trading Strategies
Smart Stock Scanner
Research Reports
‍
Research Solutions
Reports Library
Free Resources
Simple Backtest Calculator
Simple Seasonality Calculator
The Kelly Criterion Calculator
Sentiment Geo Map
Public Research Reports
Education
Sentiment Indicators
Technical Indicators
Pricing
Company
About
In the News
Testimonials
Client Success Stories
Contact
Log inLoginSign up
< BACK TO ALL REPORTS

Breakout In "Overboughtness"

Jason Goepfert
2019-11-19
null

This is an abridged version of our recent reports and notes. For immediate access with no obligation, sign up for a 30-day free trial now.


Overbought breakouts

The worst environments for sentiment indicators are momentum markets. They don’t happen very often, but when they do, sentiment can get stuck. It’s that old trope about “extreme can get more extreme.”

It doesn’t happen very often, but it did in 2013 and 2017, and we saw a lot of failures in our indicators. Instead of making excuses or hiding, we’ve always tried to analyze the failures and see what it means. Like in February 2017, the consistent failures of a high risk level caused its Brier Score to spike.

That’s why we spend quite a bit of time looking at momentum-related studies in here and the premium notes. We want to gauge the price action and underlying dynamics of the indexes and their components to see if we’re seeing high-quality momentum that might overwhelm extreme sentiment.

If we look at pure price action and indicators like the Relative Strength Index (RSI), it’s hard to find any faults. The Dow Industrials managed to score a multi-year high with its RSI breaking out as well.

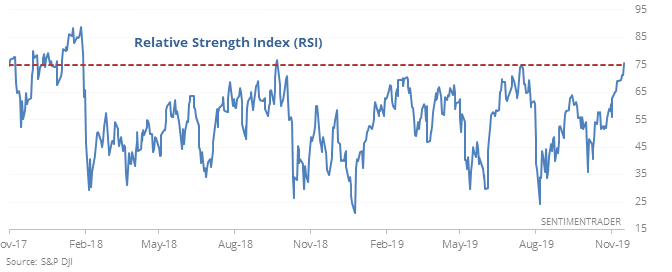
That has been only modestly positive in the shorter-term and quite a bit better long-term. If we only look for times when the Dow was at a multi-year high at the time, then it’s happened only five times before now. Returns over the next few weeks were mixed in three of the cases, while two of them proceeded to rise almost without interruption. Notably, they ended up leading to two of the best momentum years in history, in 1995 and 2017.


Earnings Plateau

When we look at the S&P’s returns through Friday’s close, it has gone through 222 trading days in 2019. Its rolling 222-day return had recently spiked because of the trouble near the end of last year, yet its year-over-year change in operating earnings is negative.

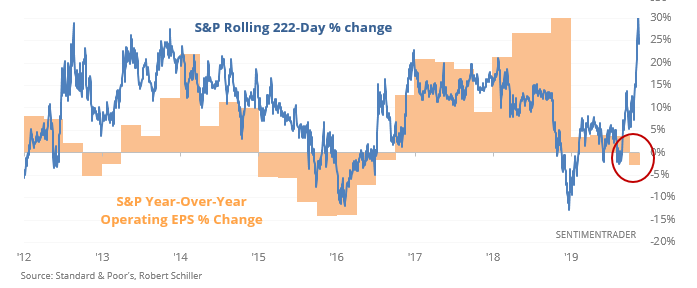
This is unusual - usually, there is a positive correlation between earnings growth and the S&P's trailing return.

It doesn’t happen very often. It triggered in 2009 as stocks shot higher in the initial recovery from the financial crisis. Something similar happened in 1975, and both ended up leading to good long-term returns. Shorter-term returns were questionable, though, and that was the case with most of the others, too.

We also looked at:

  • Breakout in healthcare sector
  • Big jump in French stocks over the past ~30 days
  • GDPNow forecast shows a big drop
  • Momentum in the MSCI World index
  • Stocks keep rallying despite consistent negative breadth
PRODUCTS
SentimenTrader
Trading Tools
Indicators & Data API
‍
Strategies & Scanner
‍
Research Reports
FREE
RESOUrCES
Simple Backtest
Calculator
Simple Seasonality
Calculator
The Kelly Criterion
Calculator
Sentiment Geo Map
‍
Public Research Reports
‍
Education
Sentiment Indicators
‍
Technical Indicators
‍
Pricing
Bundle pricing
‍
FAQ
‍
Announcements
‍
COMPANY
‍
About
‍
In the News
‍
Testimonials
‍
Client Success Stories
CONTACT
‍
General Inquiries
‍
Media Inquiries
‍
Financial Professionals Inquiries
‍
© 2026 Sundial Capital Research Inc. All rights reserved.
Setsail Marketing
TermsPrivacyAffiliate Program
Risk Disclosure: Futures and forex trading contains substantial risk and is not for every investor. An investor could potentially lose all or more than the initial investment. Risk capital is money that can be lost without jeopardizing ones’ financial security or life style. Only risk capital should be used for trading and only those with sufficient risk capital should consider trading. Past performance is not necessarily indicative of future results.

Hypothetical Performance Disclosure: Hypothetical performance results have many inherent limitations, some of which are described below. No representation is being made that any account will or is likely to achieve profits or losses similar to those shown; in fact, there are frequently sharp differences between hypothetical performance results and the actual results subsequently achieved by any particular trading program. One of the limitations of hypothetical performance results is that they are generally prepared with the benefit of hindsight. In addition, hypothetical trading does not involve financial risk, and no hypothetical trading record can completely account for the impact of financial risk of actual trading. for example, the ability to withstand losses or to adhere to a particular trading program in spite of trading losses are material points which can also adversely affect actual trading results. There are numerous other factors related to the markets in general or to the implementation of any specific trading program which cannot be fully accounted for in the preparation of hypothetical performance results and all which can adversely affect trading results.

Testimonial Disclosure: Testimonials appearing on this website may not be representative of other clients or customers and is not a guarantee of future performance or success.