Products
SentimenTrader Trading Tools
‍
Backtest Engine
My Trading Toolkit
Correlation Analysis
Seasonality
Market Prediction
Indicators & Data API
‍
Proprietary Indicators & Charts
Market Data API
Strategies & Scanner
‍
50+ Trading Strategies
Smart Stock Scanner
Smart Option Scanner
Research Reports
‍
Research Solutions
Reports Library
Free Resources
Simple Backtest Calculator
Simple Seasonality Calculator
The Kelly Criterion Calculator
Sentiment Geo Map
Public Research Reports
Education
Sentiment Indicators
Technical Indicators
Pricing
Company
About
In the News
Testimonials
Client Success Stories
Contact
Log inLoginSign up
< BACK TO ALL REPORTS

Breadth warnings are no longer isolated events

by Sentimentrader
2026-07-09
A breadth-based market model tracking S&P 500 participation across multiple timeframes triggered a new warning signal. After similar alerts, the index typically struggled through a drawdown over the next three months before recovering, with roughly four out of five instances posting positive one-year returns but maximum losses exceeding maximum gains at every horizon out to six months.

Key points:

  • The S&P 500 remains close to its highs, but recent trading has become more uneven beneath the surface
  • This is not the first breadth warning in recent months, and the question is whether repeated warnings are becoming the market environment
  • Similar breadth clusters near highs have tended to create a less favorable short-term risk/reward profile

The market feels strong and unstable at the same time

Most investors have already felt that the market is no longer an easy ride. The indexes sit near their highs, lifted at times by semiconductors and AI-related shares, but the day-to-day action has grown uneven, capital has rotated toward defensive names, and elevated valuations have left the market more sensitive to bad news.

We have already discussed several breadth-related signals over recent weeks. For this reason, the more useful question is not whether breadth has weakened, but whether the repetition is starting to describe the market's operating environment rather than a routine divergence.

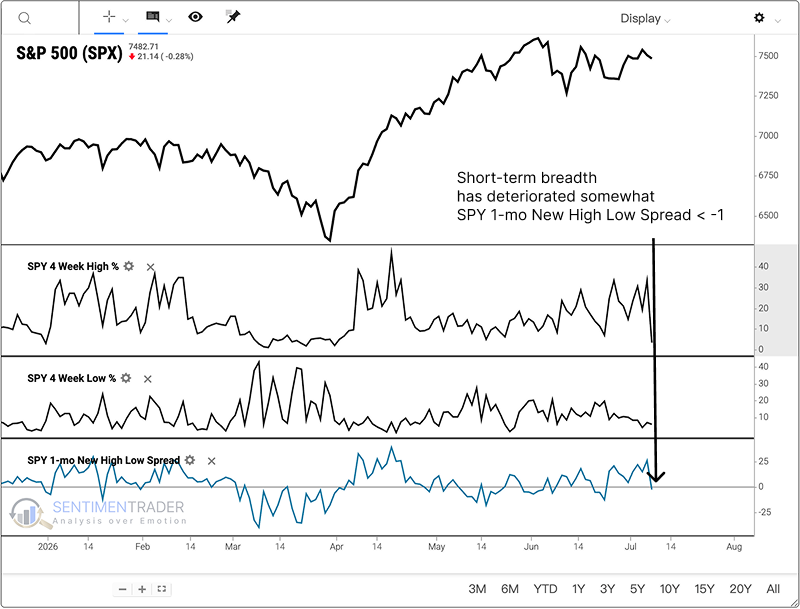
The latest signal is not built on one noisy breadth input. It requires several forms of participation to weaken while the S&P 500 remains close to a 252-day high.

Short-term breadth has slipped first. The spread between new highs and new lows has turned negative, a sign that the average stock is no longer keeping pace with the index even as the h

Sorry, you don't have access to this report

Upgrade your subscription plan to get access
Go to Dasboard
PRODUCTS
SentimenTrader
Trading Tools
Indicators & Data API
‍
Strategies & Scanner
‍
Research Reports
FREE
RESOUrCES
Simple Backtest
Calculator
Simple Seasonality
Calculator
The Kelly Criterion
Calculator
Sentiment Geo Map
‍
Public Research Reports
‍
Education
Sentiment Indicators
‍
Technical Indicators
‍
Pricing
Bundle pricing
‍
FAQ
‍
Announcements
‍
COMPANY
‍
About
‍
In the News
‍
Testimonials
‍
Client Success Stories
CONTACT
‍
General Inquiries
‍
Media Inquiries
‍
Financial Professionals Inquiries
‍
© 2026 Sundial Capital Research Inc. All rights reserved.
Setsail Marketing
TermsPrivacyAffiliate Program
Risk Disclosure: The information and tools provided are for research and analytical purposes only and are not intended as investment advice. Market analysis involves uncertainty, and outcomes may differ from expectations. Users should conduct their own due diligence and consider their individual circumstances before making any financial decisions. Past performance is not necessarily indicative of future results.

Hypothetical Performance Disclosure: Hypothetical performance results have many inherent limitations, some of which are described below. No representation is being made that any account will or is likely to achieve profits or losses similar to those shown; in fact, there are frequently sharp differences between hypothetical performance results and the actual results subsequently achieved by any particular trading program. One of the limitations of hypothetical performance results is that they are generally prepared with the benefit of hindsight. In addition, hypothetical trading does not involve financial risk, and no hypothetical trading record can completely account for the impact of financial risk of actual trading. for example, the ability to withstand losses or to adhere to a particular trading program in spite of trading losses are material points which can also adversely affect actual trading results. There are numerous other factors related to the markets in general or to the implementation of any specific trading program which cannot be fully accounted for in the preparation of hypothetical performance results and all which can adversely affect trading results.

Testimonial Disclosure: Testimonials appearing on this website may not be representative of other clients or customers and is not a guarantee of future performance or success.