
Breadth points to potential opportunity - but for whom?

Key Points
- SPY Breadth (% > 50 Day Avg) has fallen to a level that tends to portend market strength over the next six to twelve months, but mixed results from one week to three months
- SPY Breadth (% > 200 Day Avg) has fallen to a level that tends to portend market strength over the next two weeks to three months, but less robust results over the six to twelve-month time frame
- Will either of these prove accurate this time around? If so, which one? OR will it be both? Or neither?
- And most importantly, how should short-term traders and long-term investors use this information?
- Let's dig a little deeper
Overview
One of the more challenging jobs for any analyst or investor is deciding what to do with conflicting information. In reality, in many cases, there are no hard and fast rules. Individuals must weigh the evidence and then decide for themselves what to do with certain pieces of information. In the end, the more significant task is to determine how to translate the data into action - including position sizing and risk management.
SPY Breadth (% > 50 Day Avg)
This indicator shows the percentage of stocks in the named exchange-traded fund (ETF) that are currently trading above their 50-day moving average. Extreme readings often mark exhaustion for a particular price move - but not always.
The chart below displays those times when the SPY Breadth (% > 50 Day Avg) indicator dropped below 5%. The table shows a summary of SPY performance following a signal.
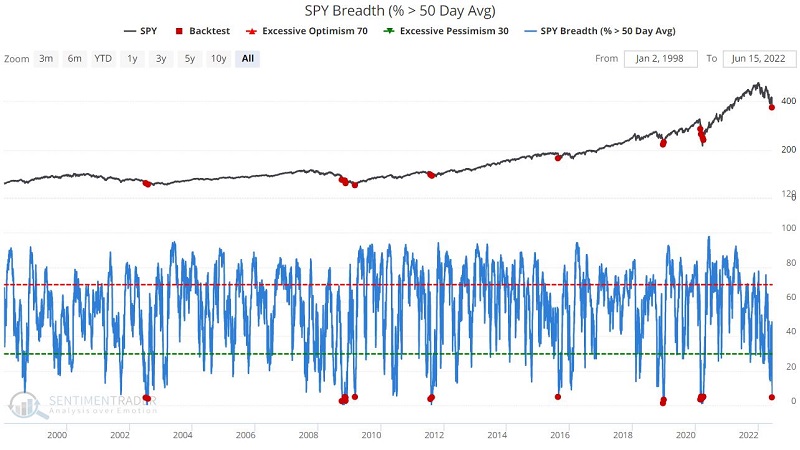
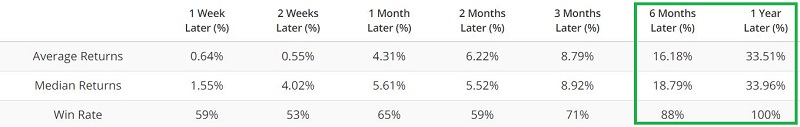
Note that results are little better than a coinflip during the first two month. But 6-month and 12-month results are pretty compelling. This suggests that investors be actively looking for a buying opportunity in the next several months, hoping to see higher prices in the year ahead.
SPY Breadth (% > 200 Day Avg)
This shows the percentage of stocks in the named exchange-traded fund (ETF) that are currently trading above their 200-day moving average. Extreme readings often mark exhaustion for a particular price move - but not always.
The chart below displays those times when the SPY Breadth (% > 200 Day Avg) indicator dropped below 17% for the first time in 6 months. The table shows a summary of SPY performance following a signal.
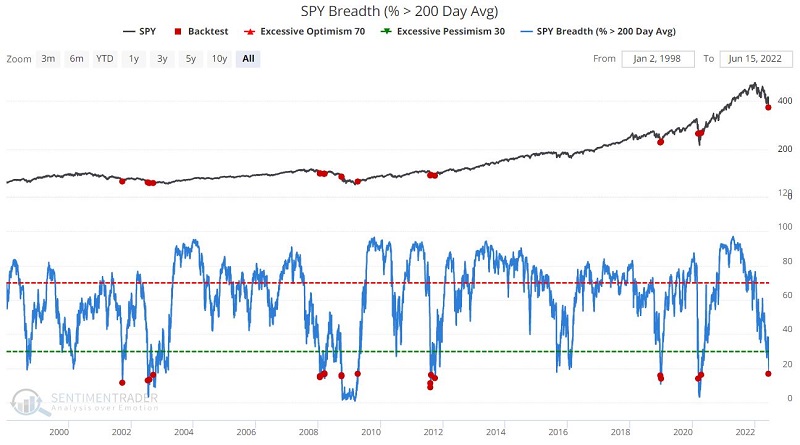
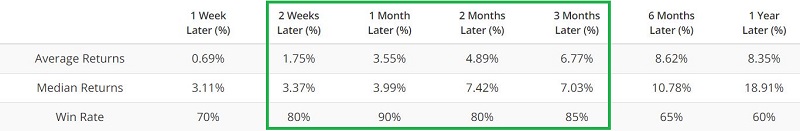
In the table above we see a very different pattern of returns than with the 50-day average. In this case, the Win Rate is highest (80%+) during the 2-weeks to 3-months time frame, and falls off during the 6-month and 12-month periods.
What to do with this information
As I said before, there are no hard and fast rules. It comes down to an individual's own preference and style. A few thoughts on this topic follow.
Short-term traders
Individuals who want to pursue a bullish short-term trading opportunity, should be looking to get into a position sooner than later, based on results from the 200-day average test results. A trader could consider buying SPY shares with a stop below the recent low of 370.59. An alternative might be to consider a bullish options trade. The limited risk on an options trade might afford a trader a little more "staying power" even if the recent low is taken out temporarily.
Longer-term investors
Individuals with more of long-term investors mindset should be watching closely for a buying opportunity in the months ahead (see this article for more thoughts and things to look for), in hopes that the market will be higher 12 months from now (based on the 50-day average test results). An investor in this category is not prone to try to "pick a bottom", but would instead a) see some signs of capitulation before jumping in, or even b) an actual strong reversal to the upside after a bottom to confirm the start of a sustainable new uptrend.
The bottom line: a trader should be looking for an opportunity sooner than later, an investor should likely be patient for now.
What the research tells us…
Extreme oversold readings such as those highlighted above, often do a good job of highlighting decent buying opportunities. However, the thing to remember is that each new signal is a unique event, and the results going forward may or may not resemble those seen in the past. As a result, some steps to consider:
After a bullish oversold signal;
- Consider your trading/investment timeframe
- Decide "what" you will trade (Index ETF, options, individual stocks)
- Identify one or more "confirming" indicators (to avoid relying on just one oversold indicator) that should trigger before you enter a position
- Determine what % of your investment capital you will commit
- Determine (in advance!) how much of your committed capital you are actually willing to risk (i.e., where to place a stop, or how much to commit to an options trade), and then stick to it
Remember, there are lots of useful indicators, but there are NO "magic bullets." What you choose to trade, how much money you choose to commit and how much money you are willing to risk are the decisions that will ultimately decide your fate. So, think long and hard about those things, formulate a plan, and stick to it.
And don't rely on any one indicator to make you rich.