
Breadth in 3 important indices reach new highs

Key points:
- The Advance/Decline Line for the Dow Industrials, S&P 500, and Nasdaq 100 all hit new highs
- These new highs in breadth are occurring despite the indices themselves being at least 5% off their highs
- Similar signals tended to be excellent long-term signs of positive returns with limited drawdowns
Breadth in the grandaddy index hits a new high
Despite chaotic headlines, conflicting macroeconomic variables, and a sizable drawdown in many stocks, breadth is at an all-time high.
In this case, "breadth" can be defined in several ways. When we use it as a broad term, we refer to a cumulative advance/decline line. That is simply each day's net number of advancing minus declining stocks, which is added to the previous day's total. If more stocks rose than fell, the number will increase.
The broadest measure includes all issues traded on the NYSE. That indicator has not yet made a new high, though it's getting close. It includes many securities that are not common stocks, and we don't want to dismiss that-it can contain important information.
Still, the stocks in some major indices have been acting well. Among the first, the Cumulative Advance/Decline Line for the Dow Industrials hit a new record high last week, despite the index itself being mired in a correction, more than 10% below its prior high.
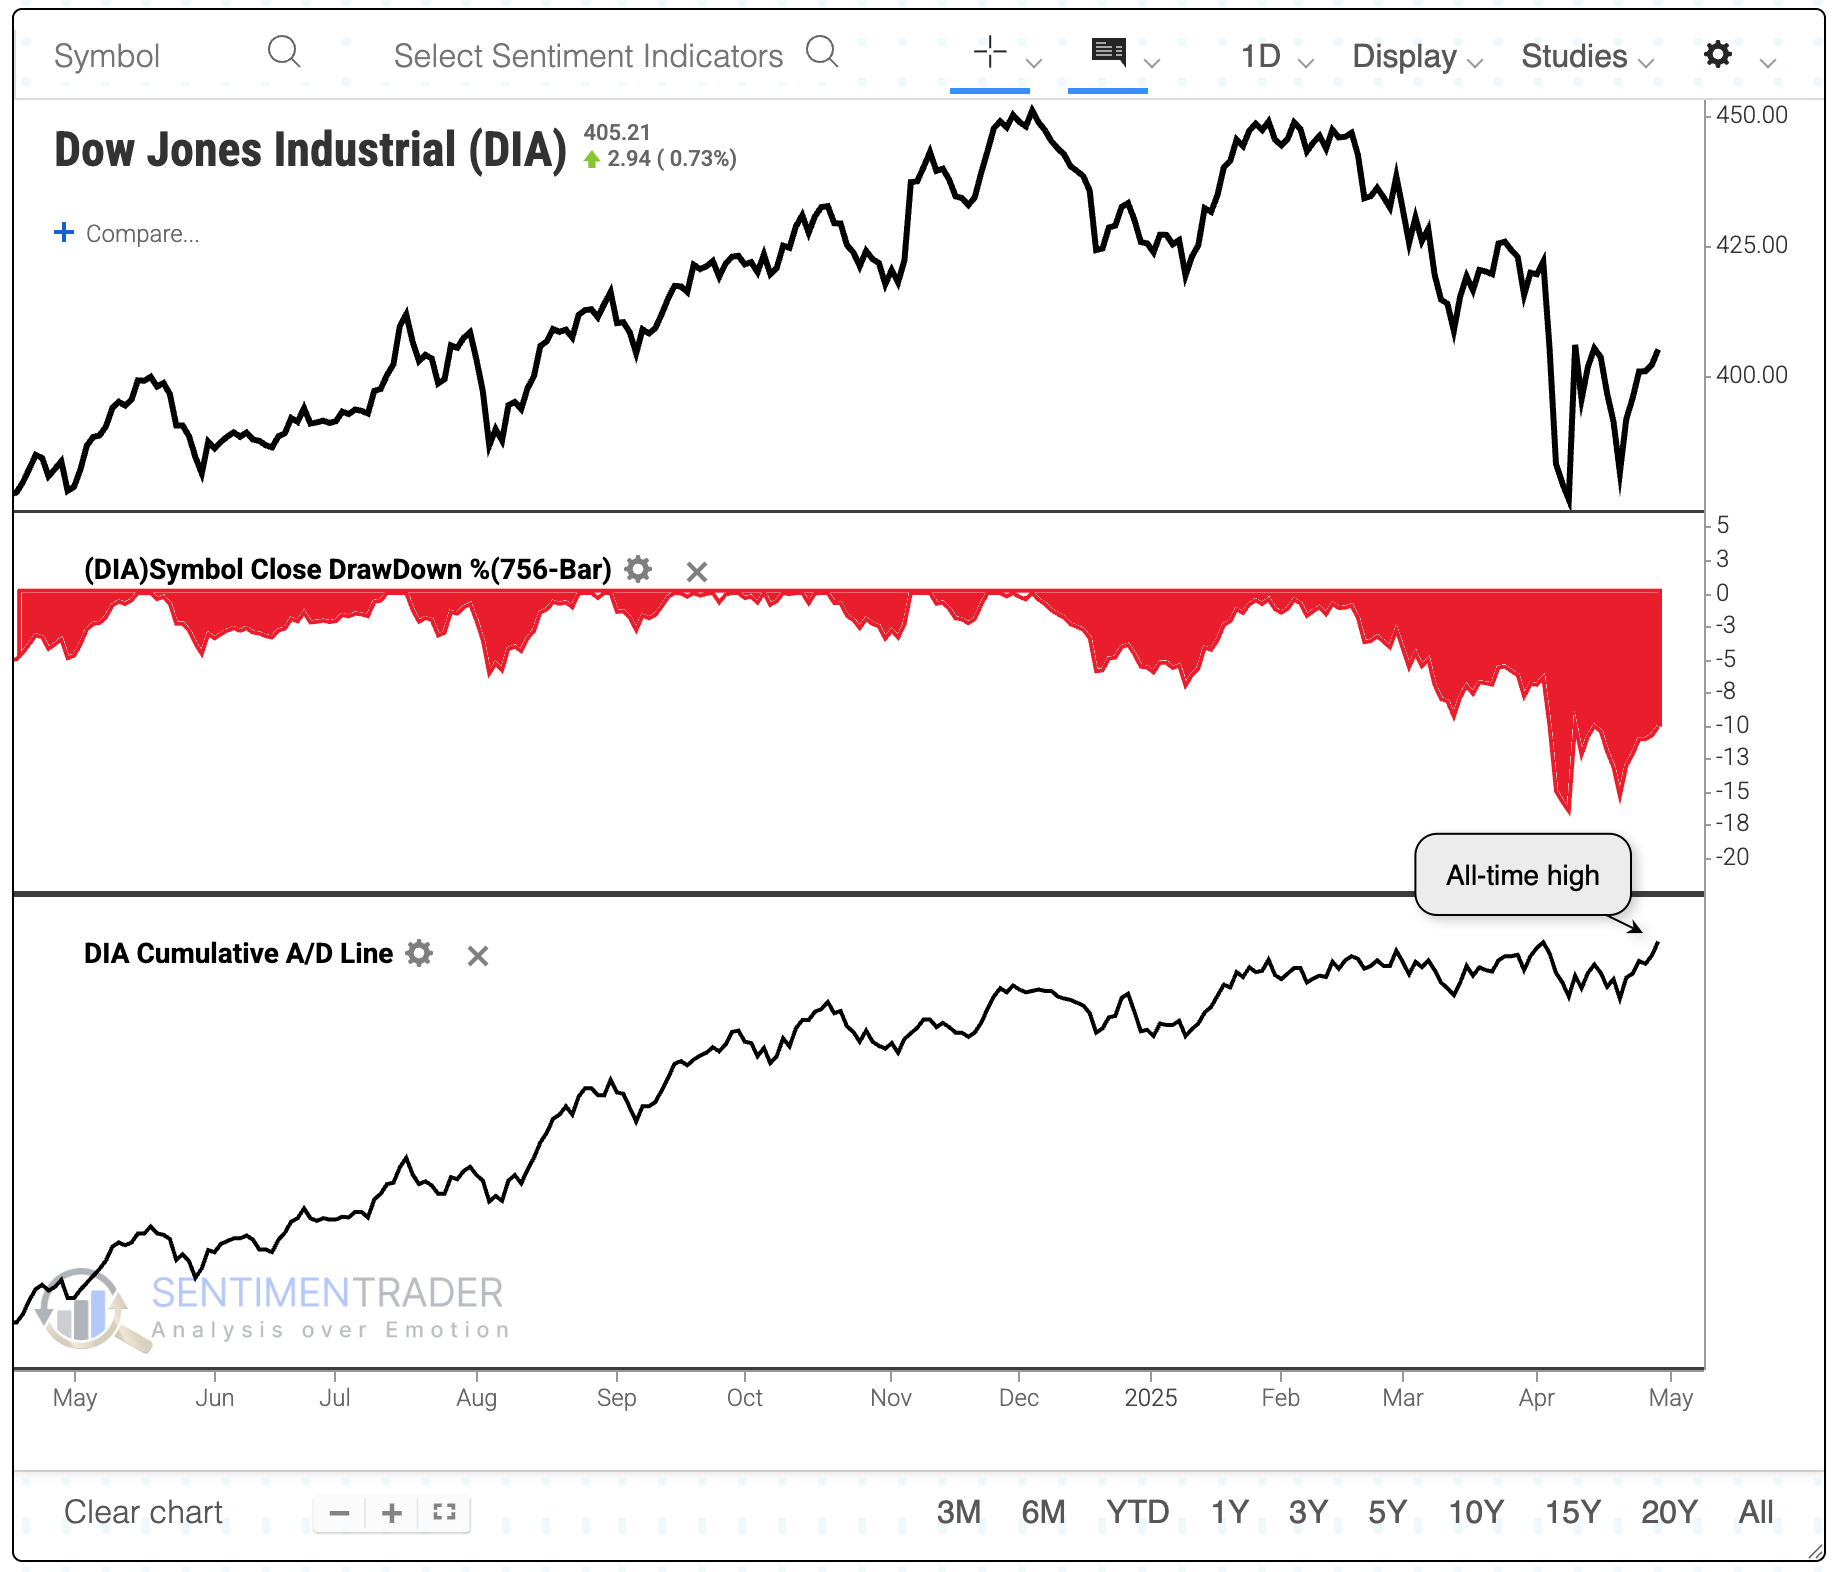
The last time the Dow was in a correction while its A/D Line hit a new high was nearly 15 years ago. In over 60 years, it's happened only a handful of times, shown in the table below. What's most notable among them is their consistency, with no significant losses across any time frame. The upside wasn't all that impressive, but the lack of downside was.
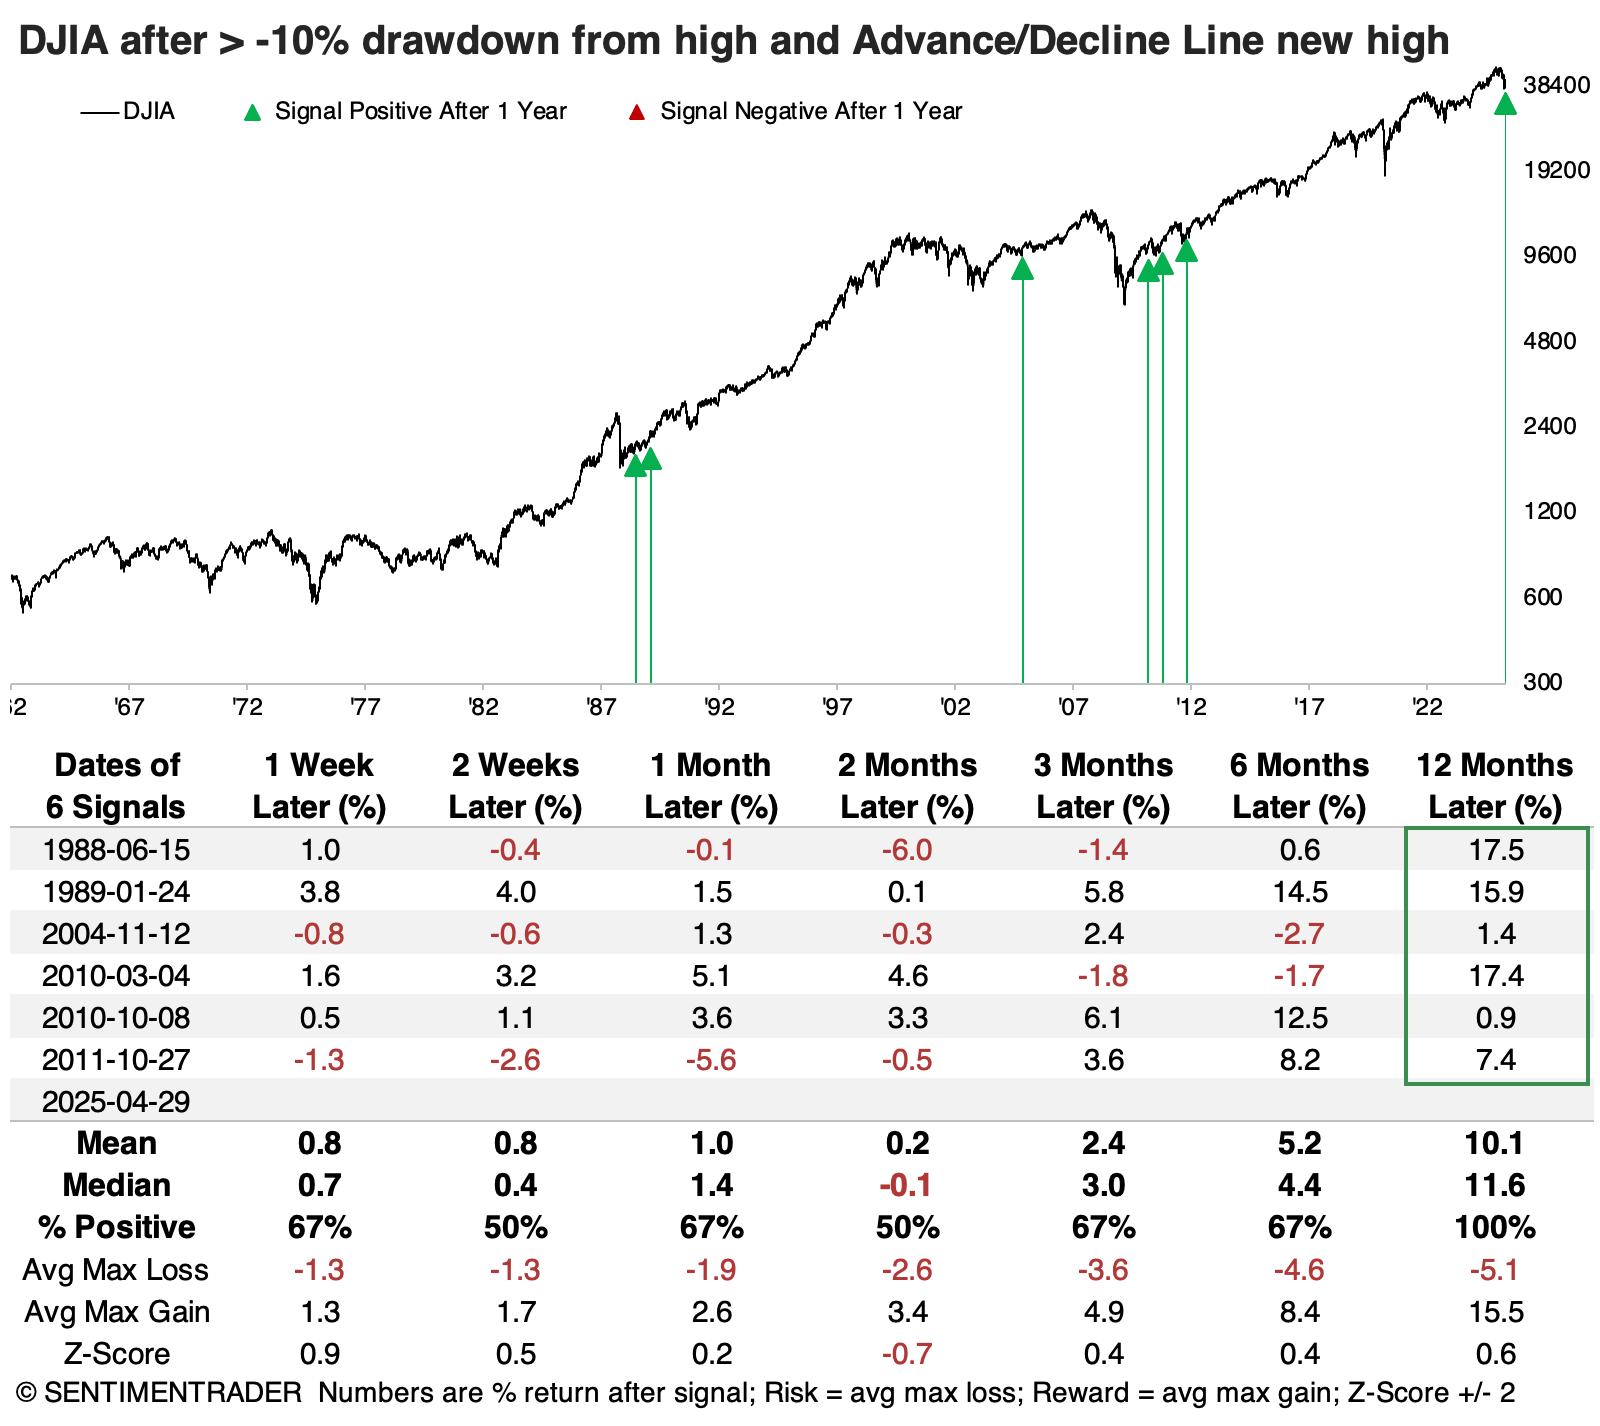
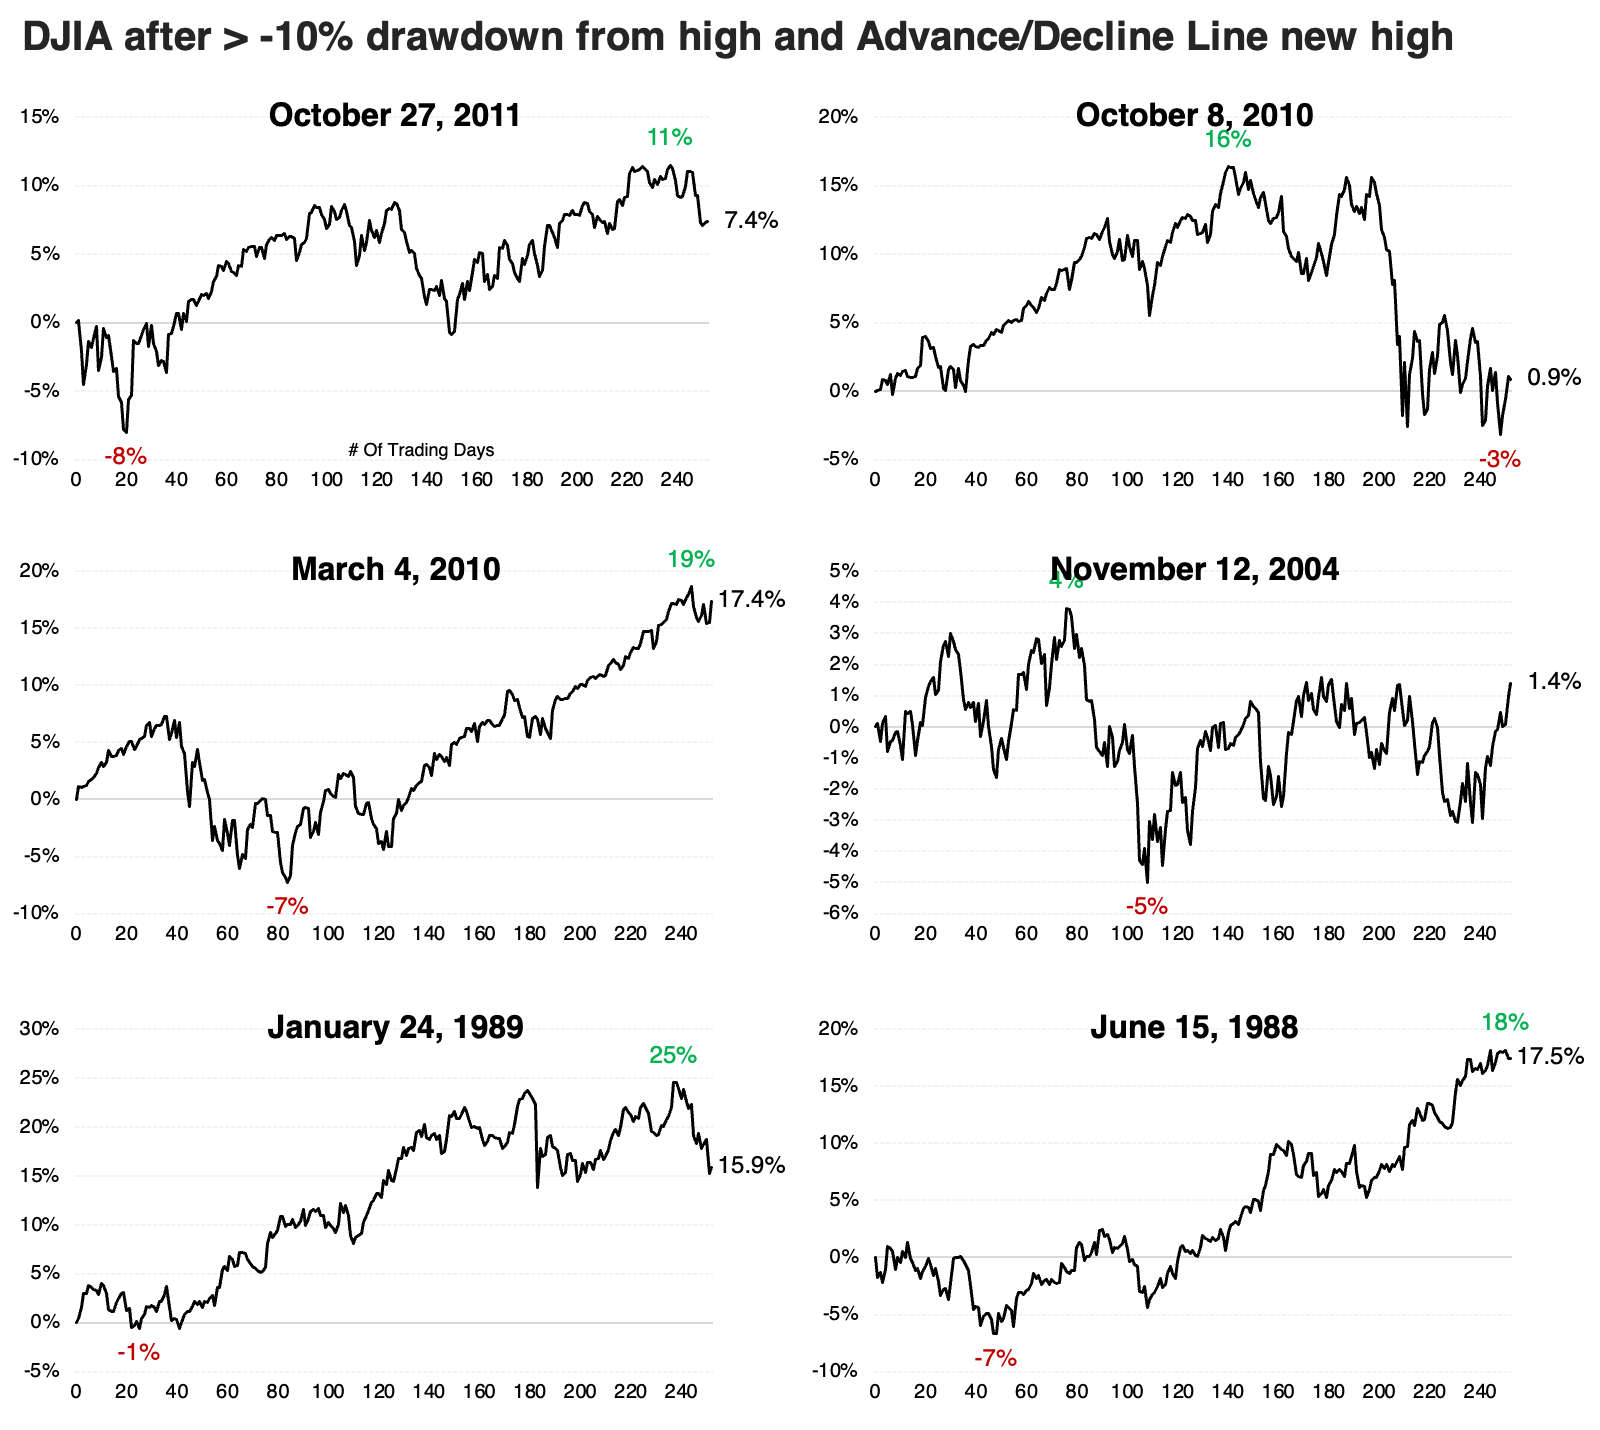
The thumbnail charts below show how the Dow performed in the year following each instance, with its maximum drawdown and drawup highlighted on the charts. We can see how choppy the next couple of months tended to be, though all but the 2010 signal saw the Dow steadily recover as the months wore on.
The most benchmarked index did, too
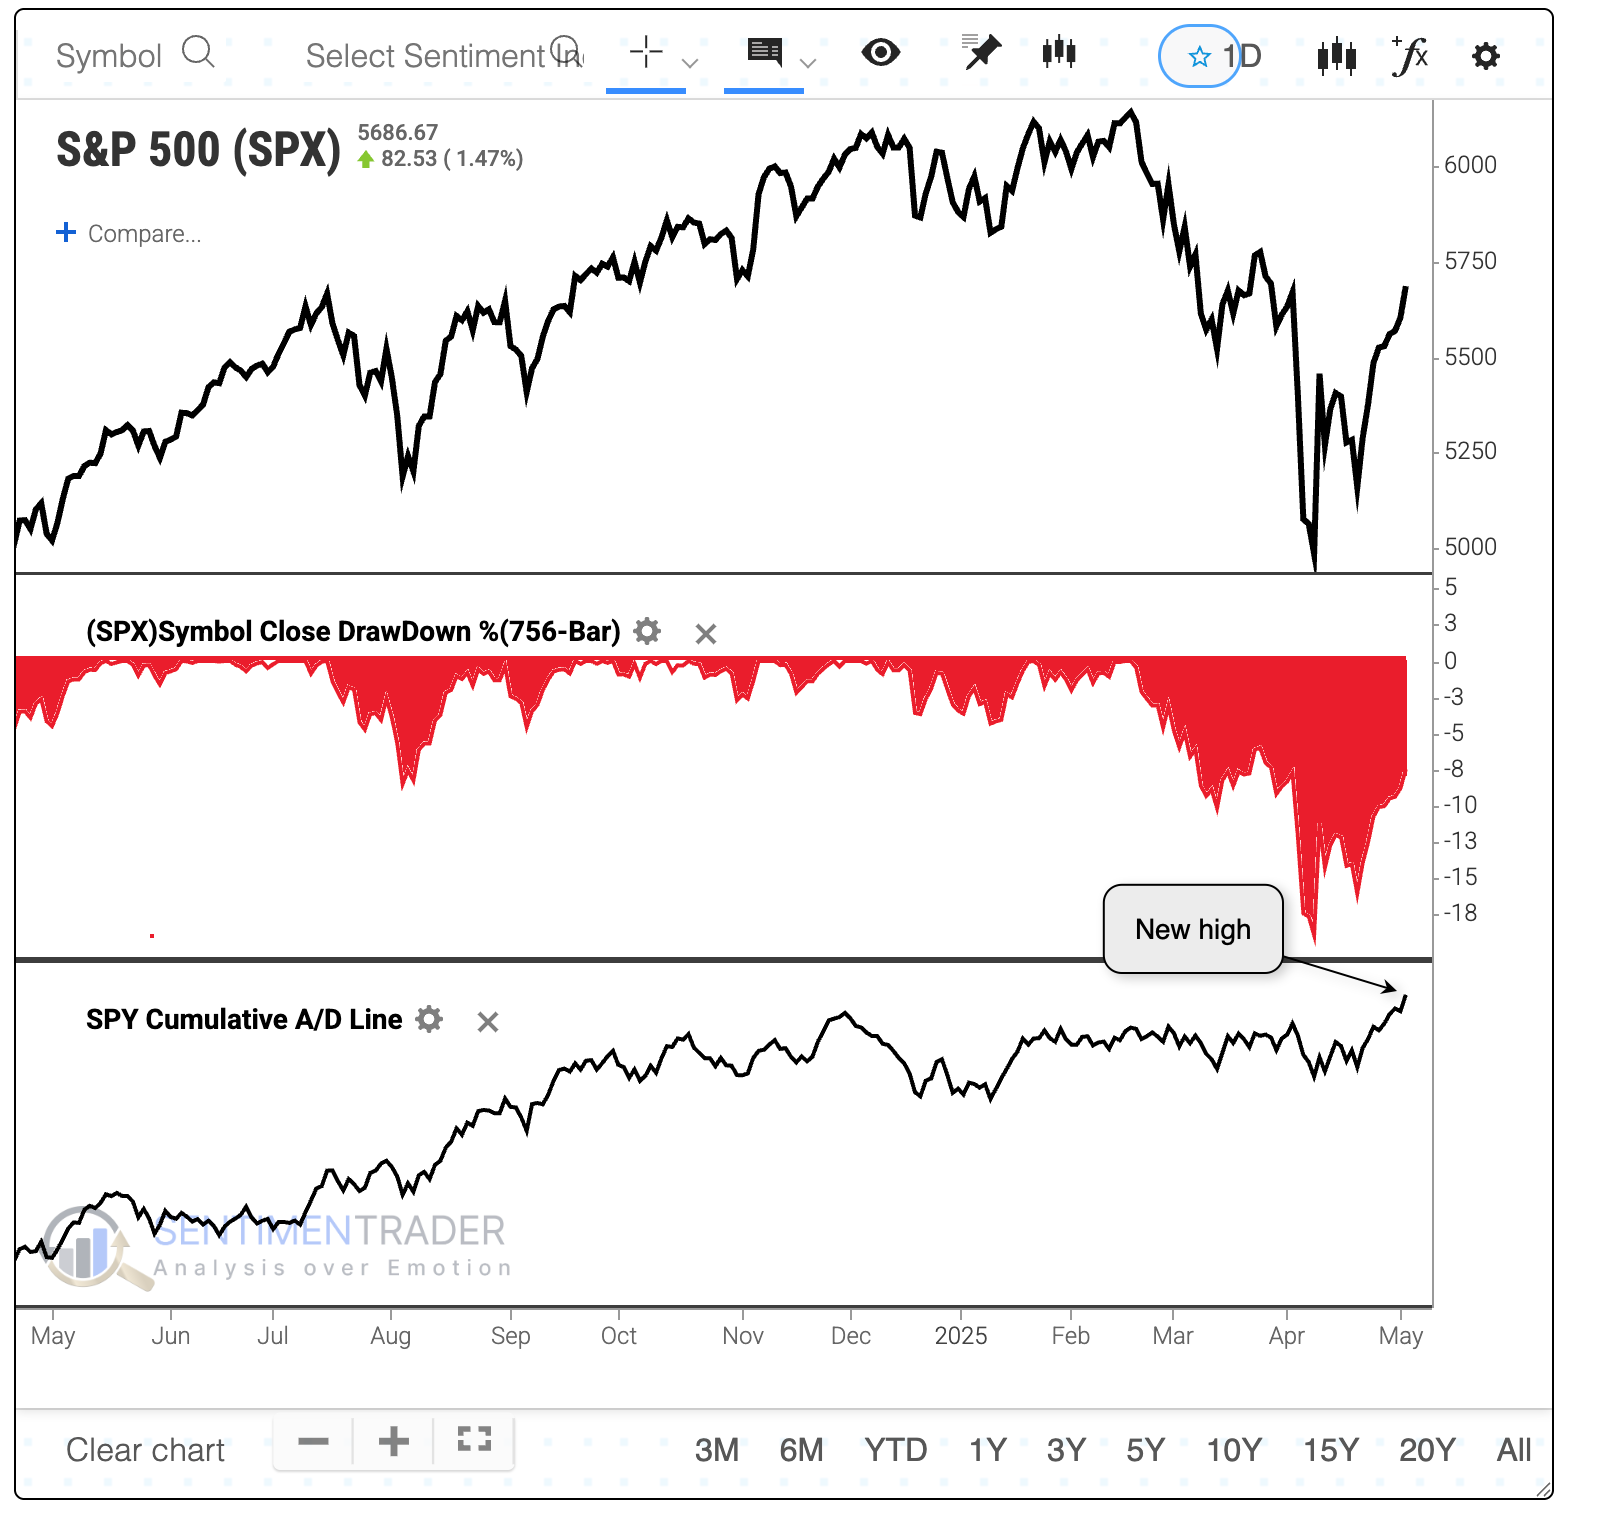
The Dow Industrials is an average of only 30 stocks, so it can be easier for breadth to recover. It's more impressive when a broader index does so, especially when that index has the most assets riding on it than any other equity index in the world.
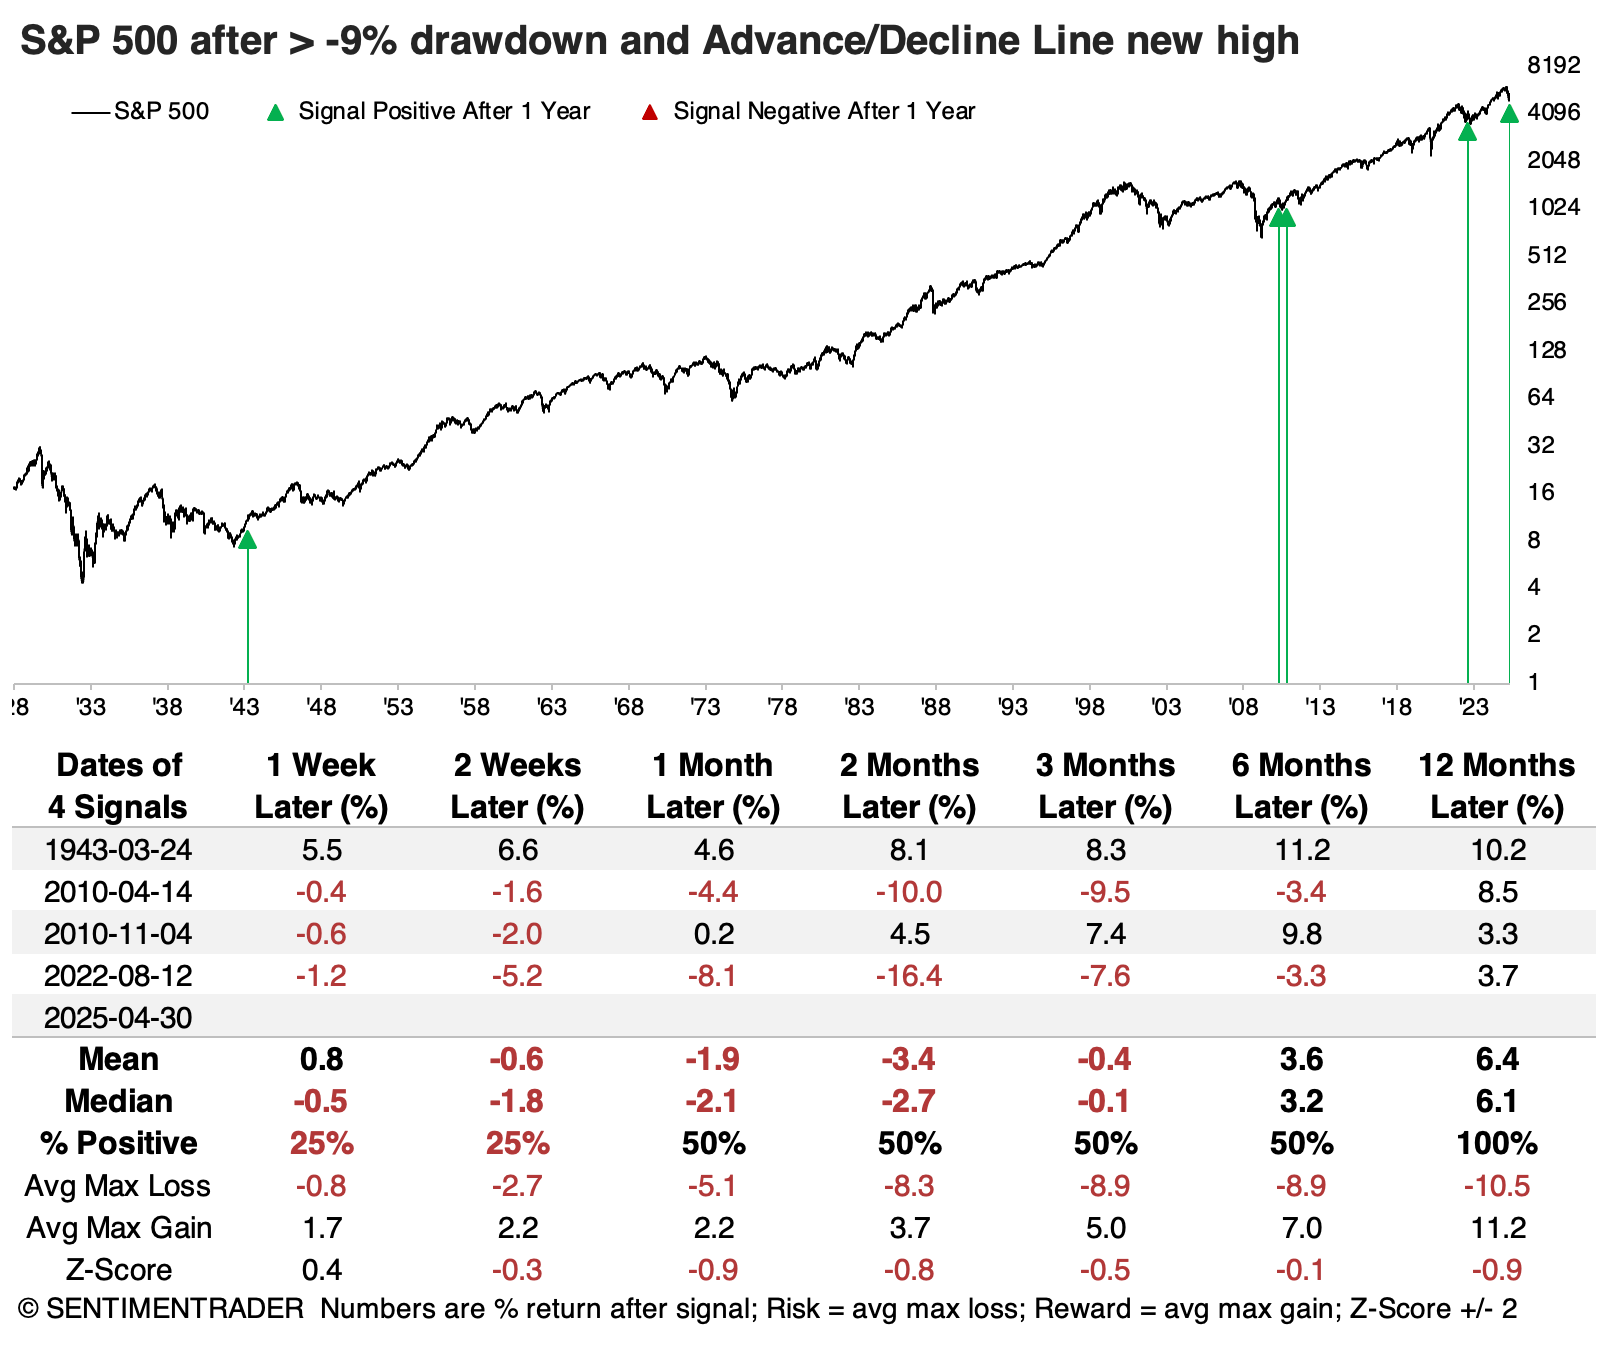
The S&P 500's Cumulative Advance/Decline Line also reached a new high last week. While the index recovered a bit more than the Dow, it was still more than 9% below its high.
The table below shows how unusual this has been. Since 1928, there have been only four other times the index was more than 9% below a 3-year high while its A/D Line made a new multi-year high. For what it's worth, the S&P suffered some short-term weakness after three of the four signals, though all resolved higher over the year.
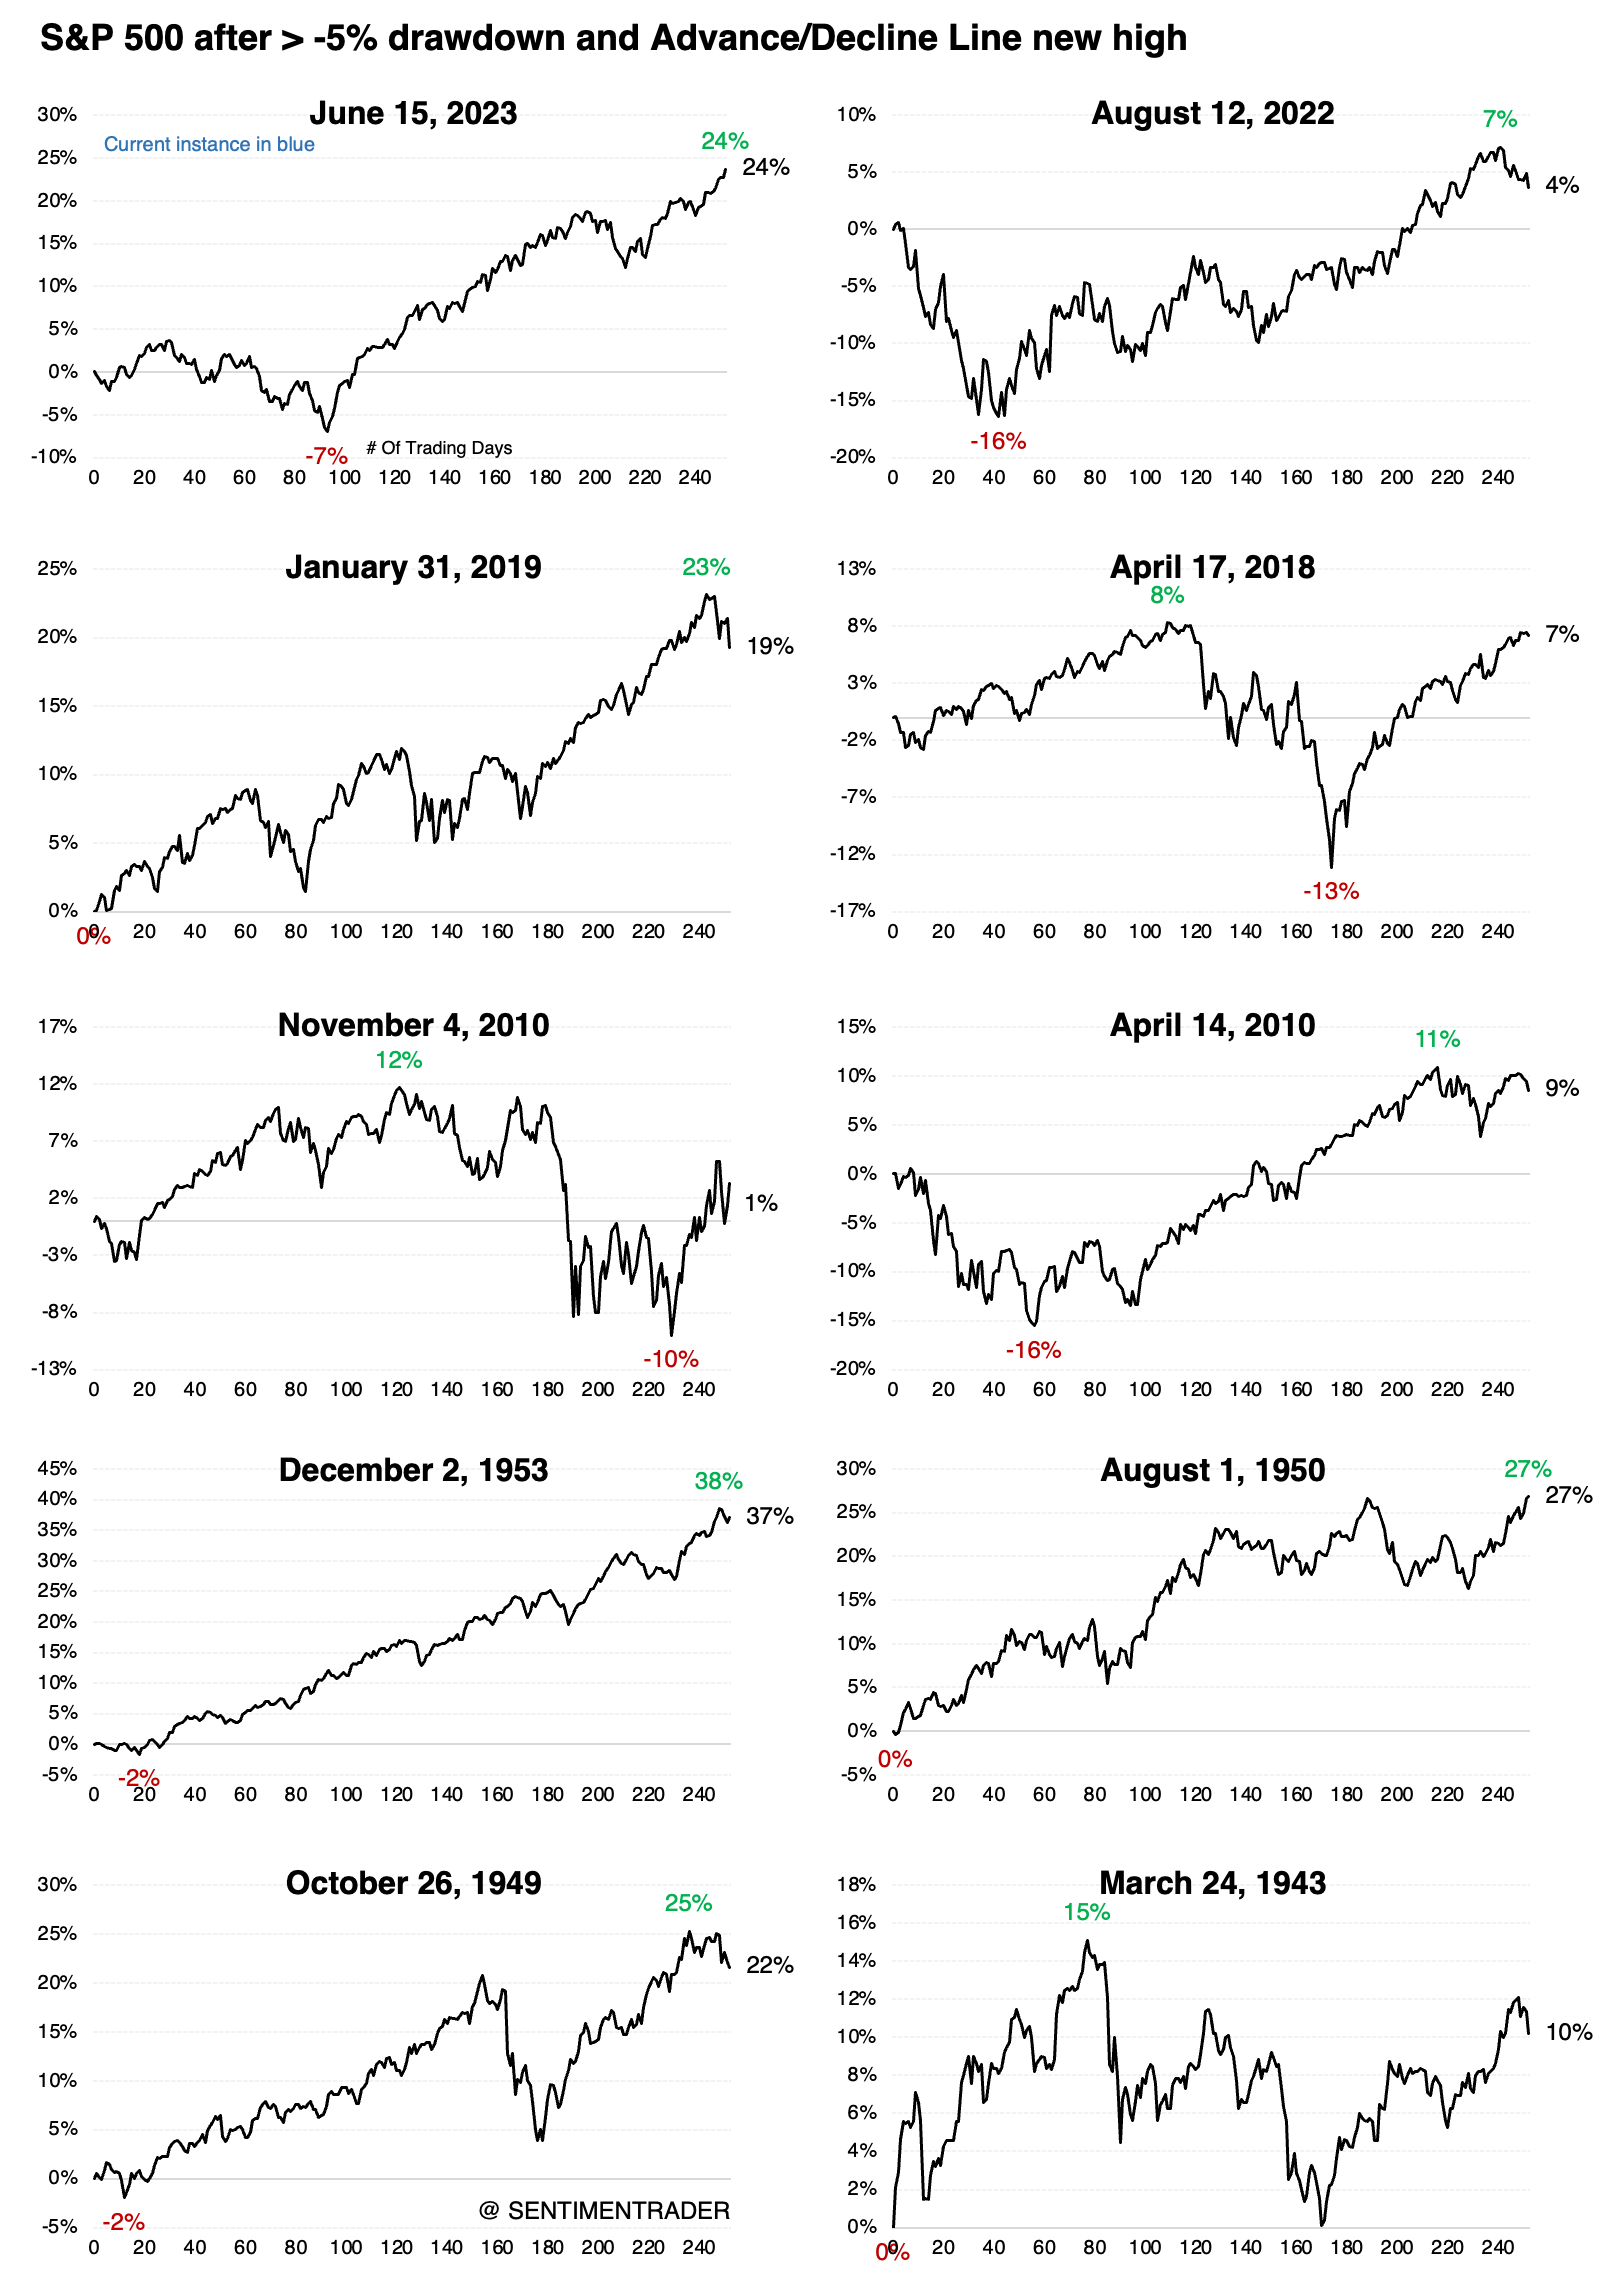
We have to relax the parameters to generate a larger sample size, so the table below looks for new highs in breadth when the S&P was at least 5% from its most recent peak. Returns following these signals were impressive; while the index often showed some weakness in the first few weeks, it was positive every time over the following year with an above-average return.
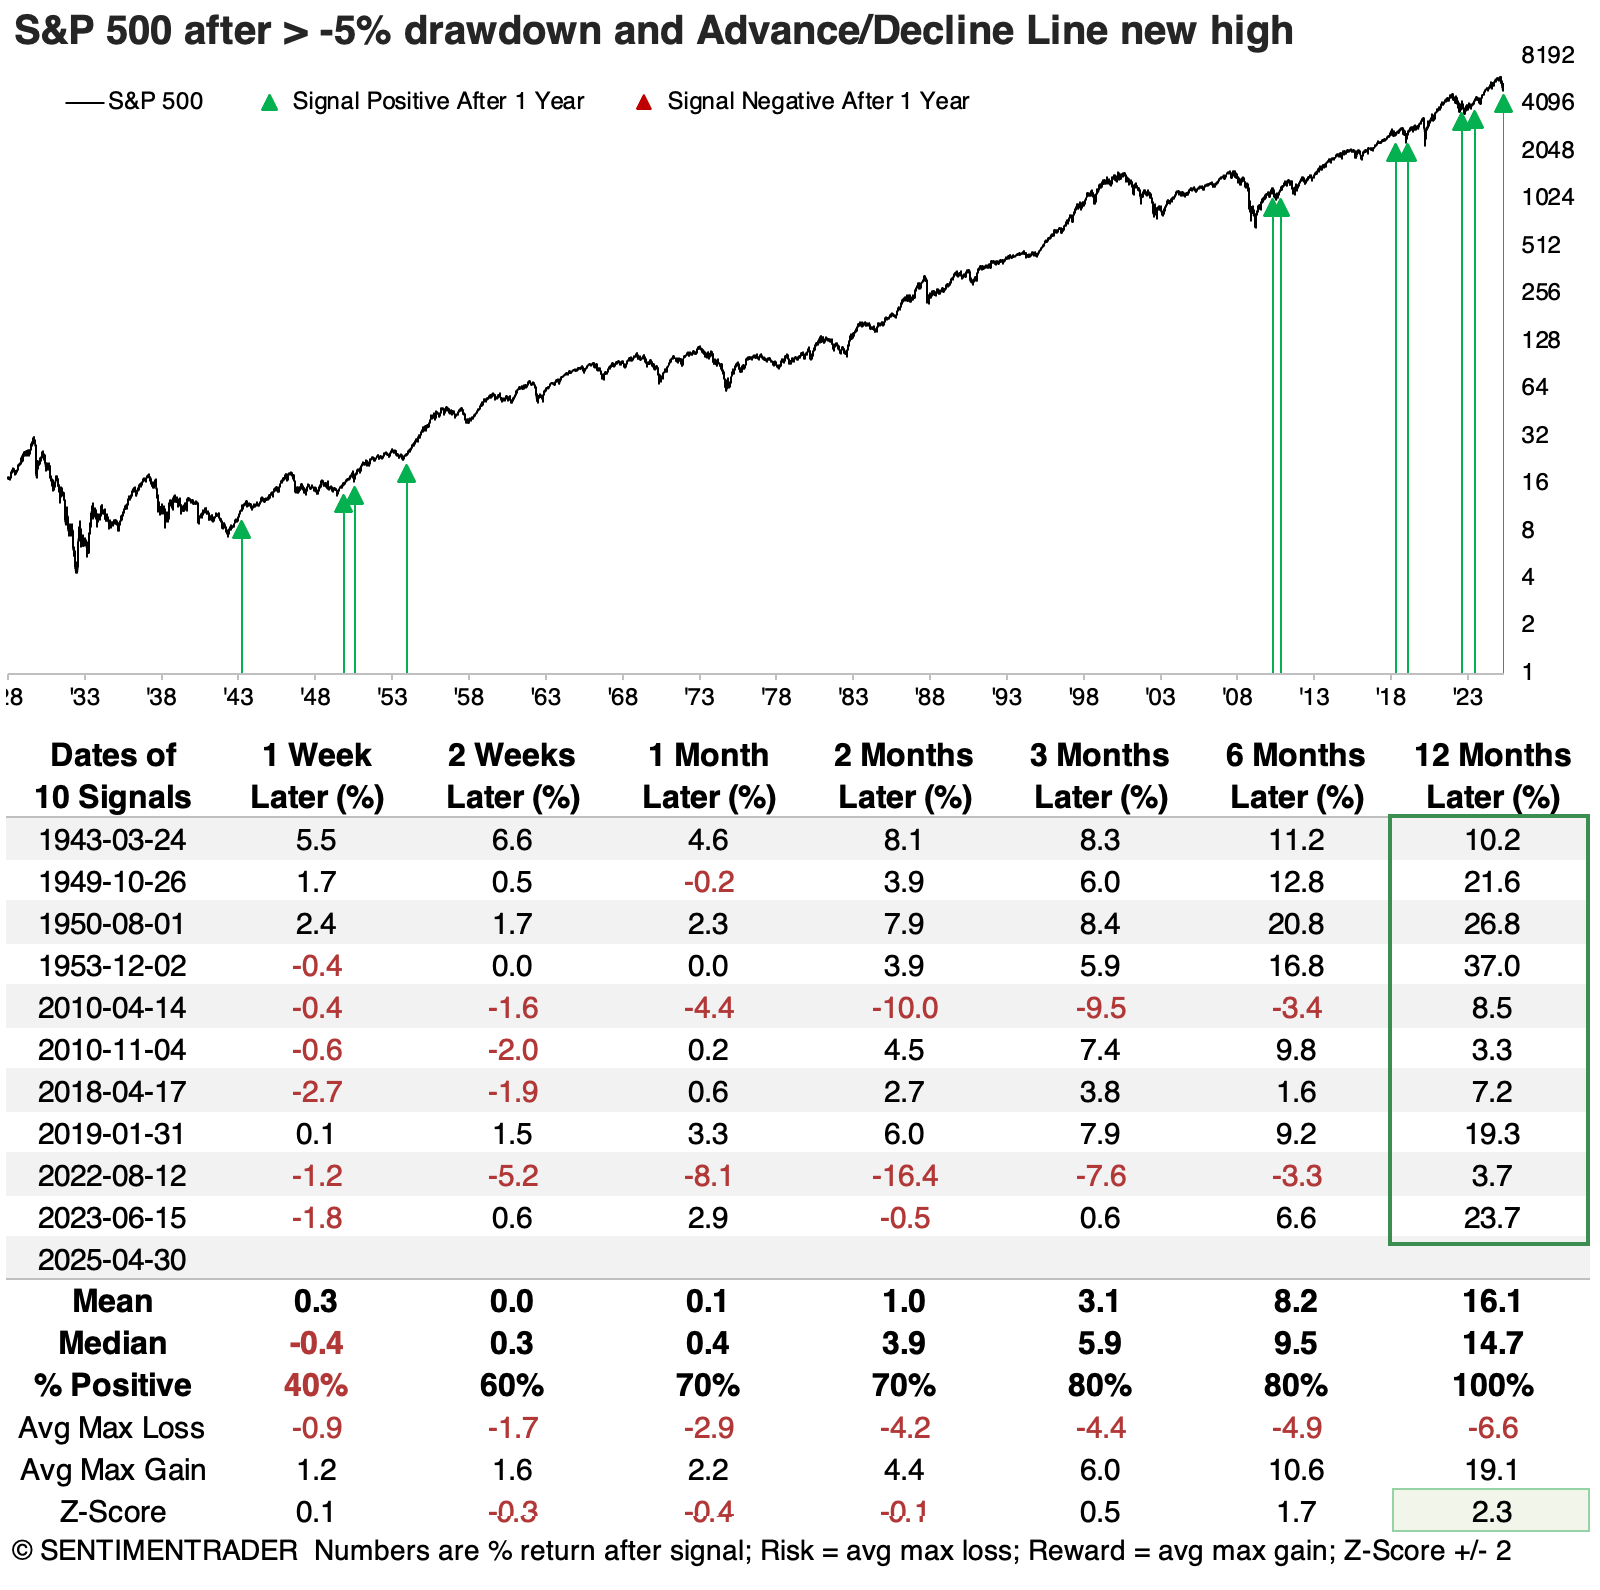
A couple of these signals, like 2022 and 2010, tested bulls' resolve almost immediately. They both suffered about a 16% drawdown within three months, but they both also fully recovered those losses in the months ahead. While volatility could be pretty high for some of the other signals, they were mostly up-and-to-the-right.
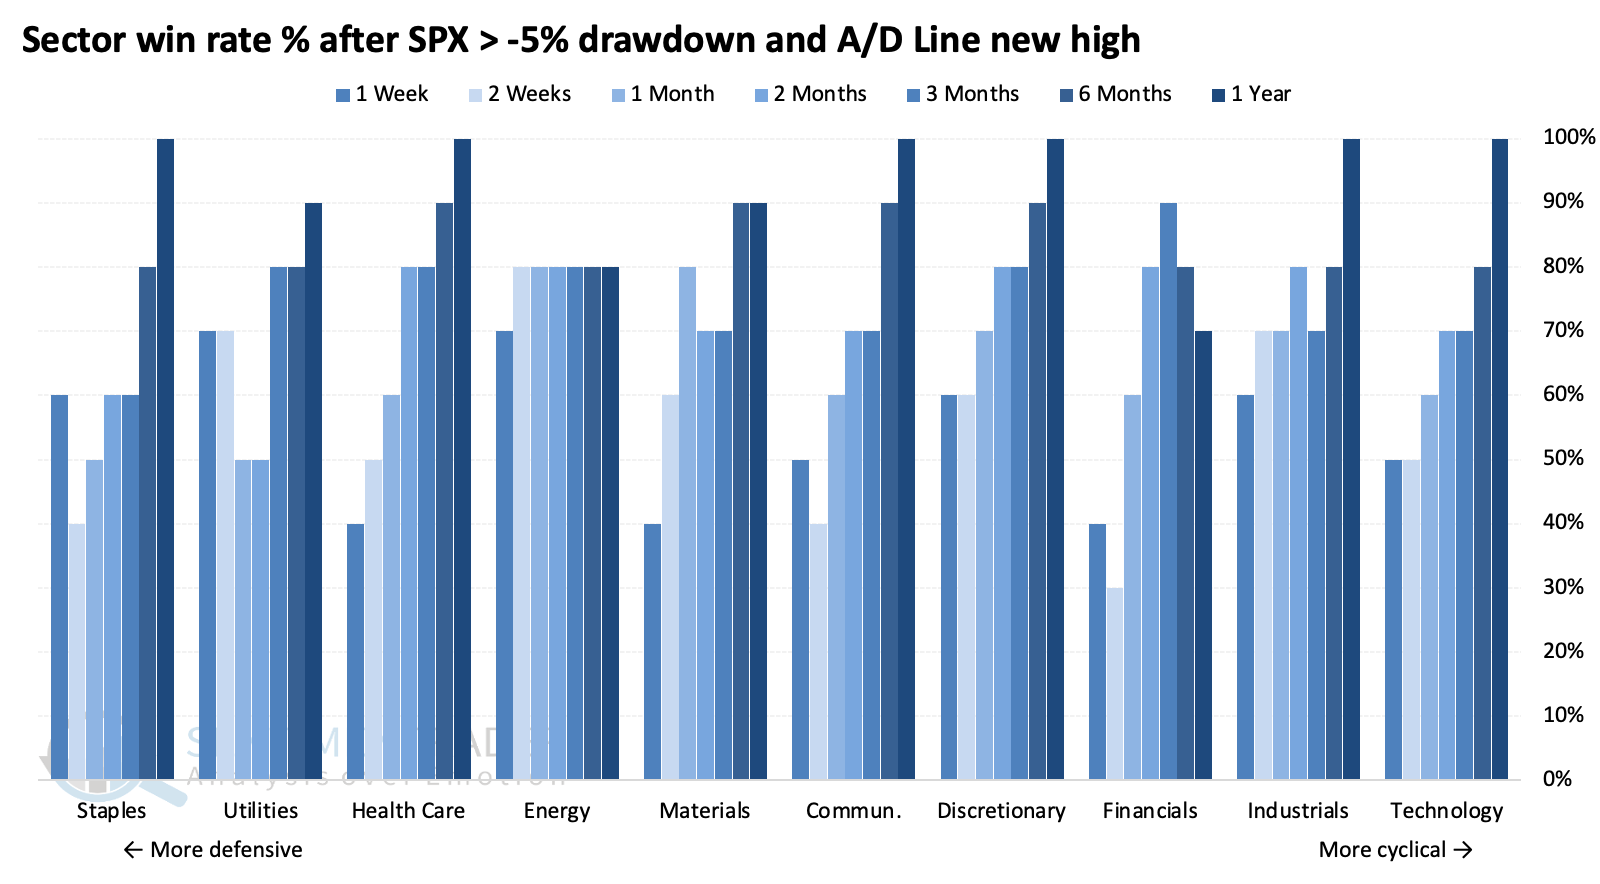
Several studies over the past few weeks have indicated that cyclical sectors tend to outperform defensive ones under similar circumstances. This is a stark difference from what many studies indicated at the end of last year and the beginning of this year.
These signals further that trend, with a clear tendency for higher returns in more cyclical sectors after the S&P 500's A/D Line reached a new high.
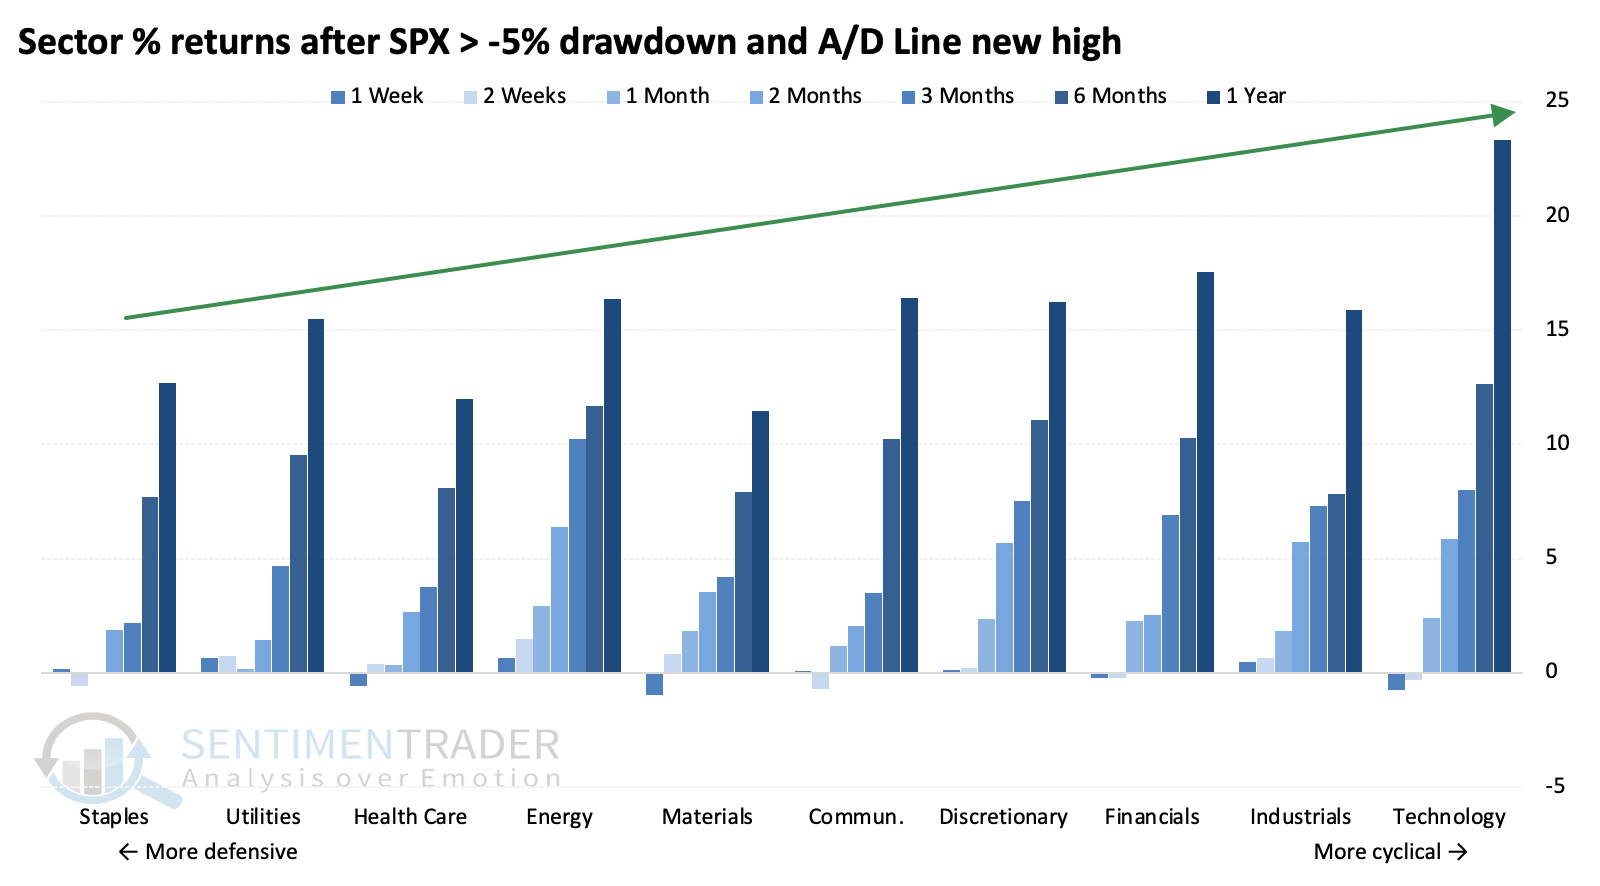
The Win Rates show the percentage of time each sector showed a positive return over various time frames after these signals. Discretionary stocks showed among the most consistent win rates across time frames.
Big tech joins
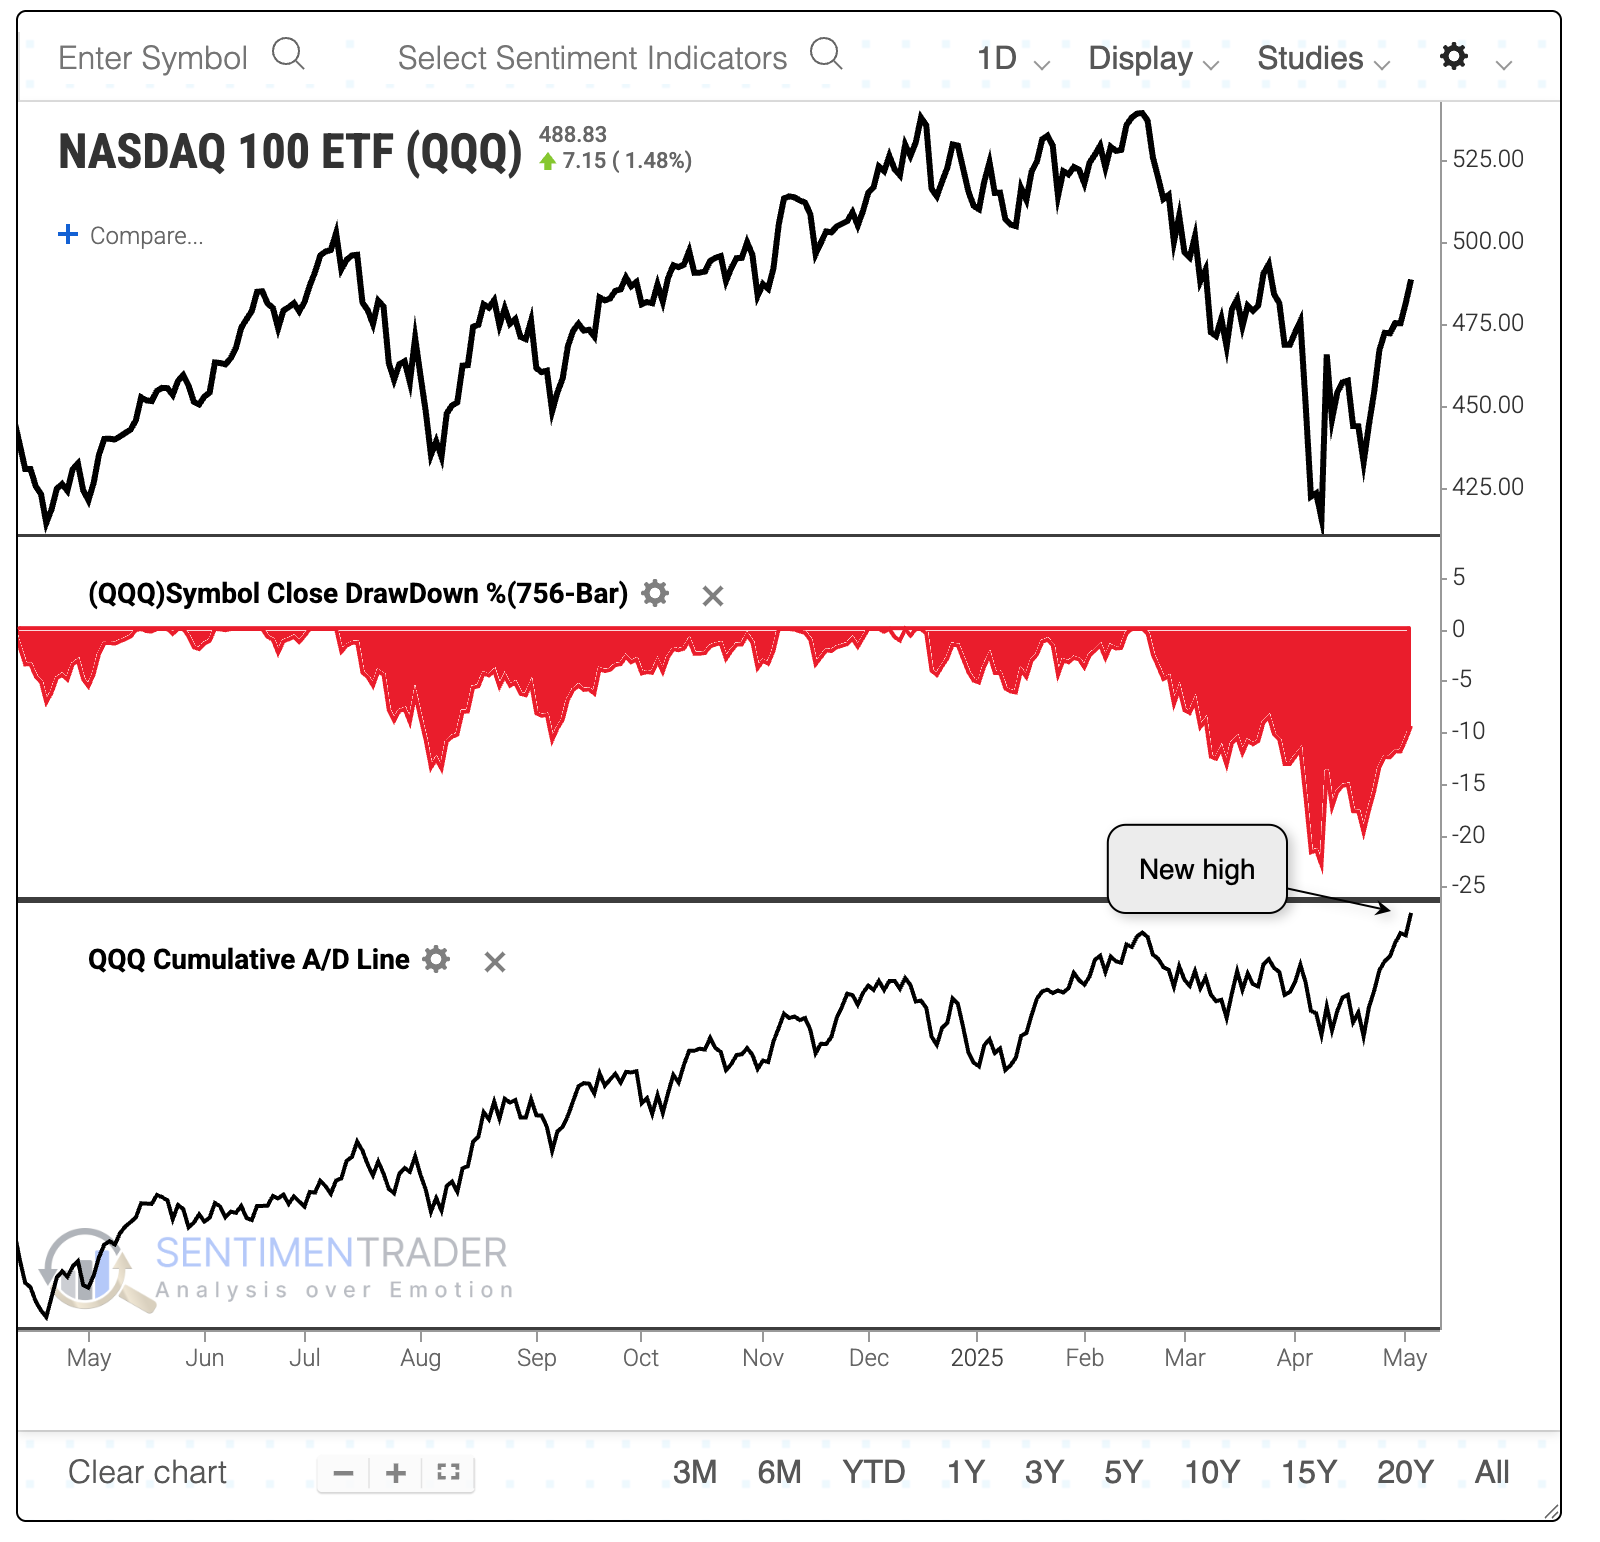
Not to be outdone, and probably to the surprise of many, the Cumulative Advance/Decline Line for the big tech-infused Nasdaq 100 also recorded a new high.
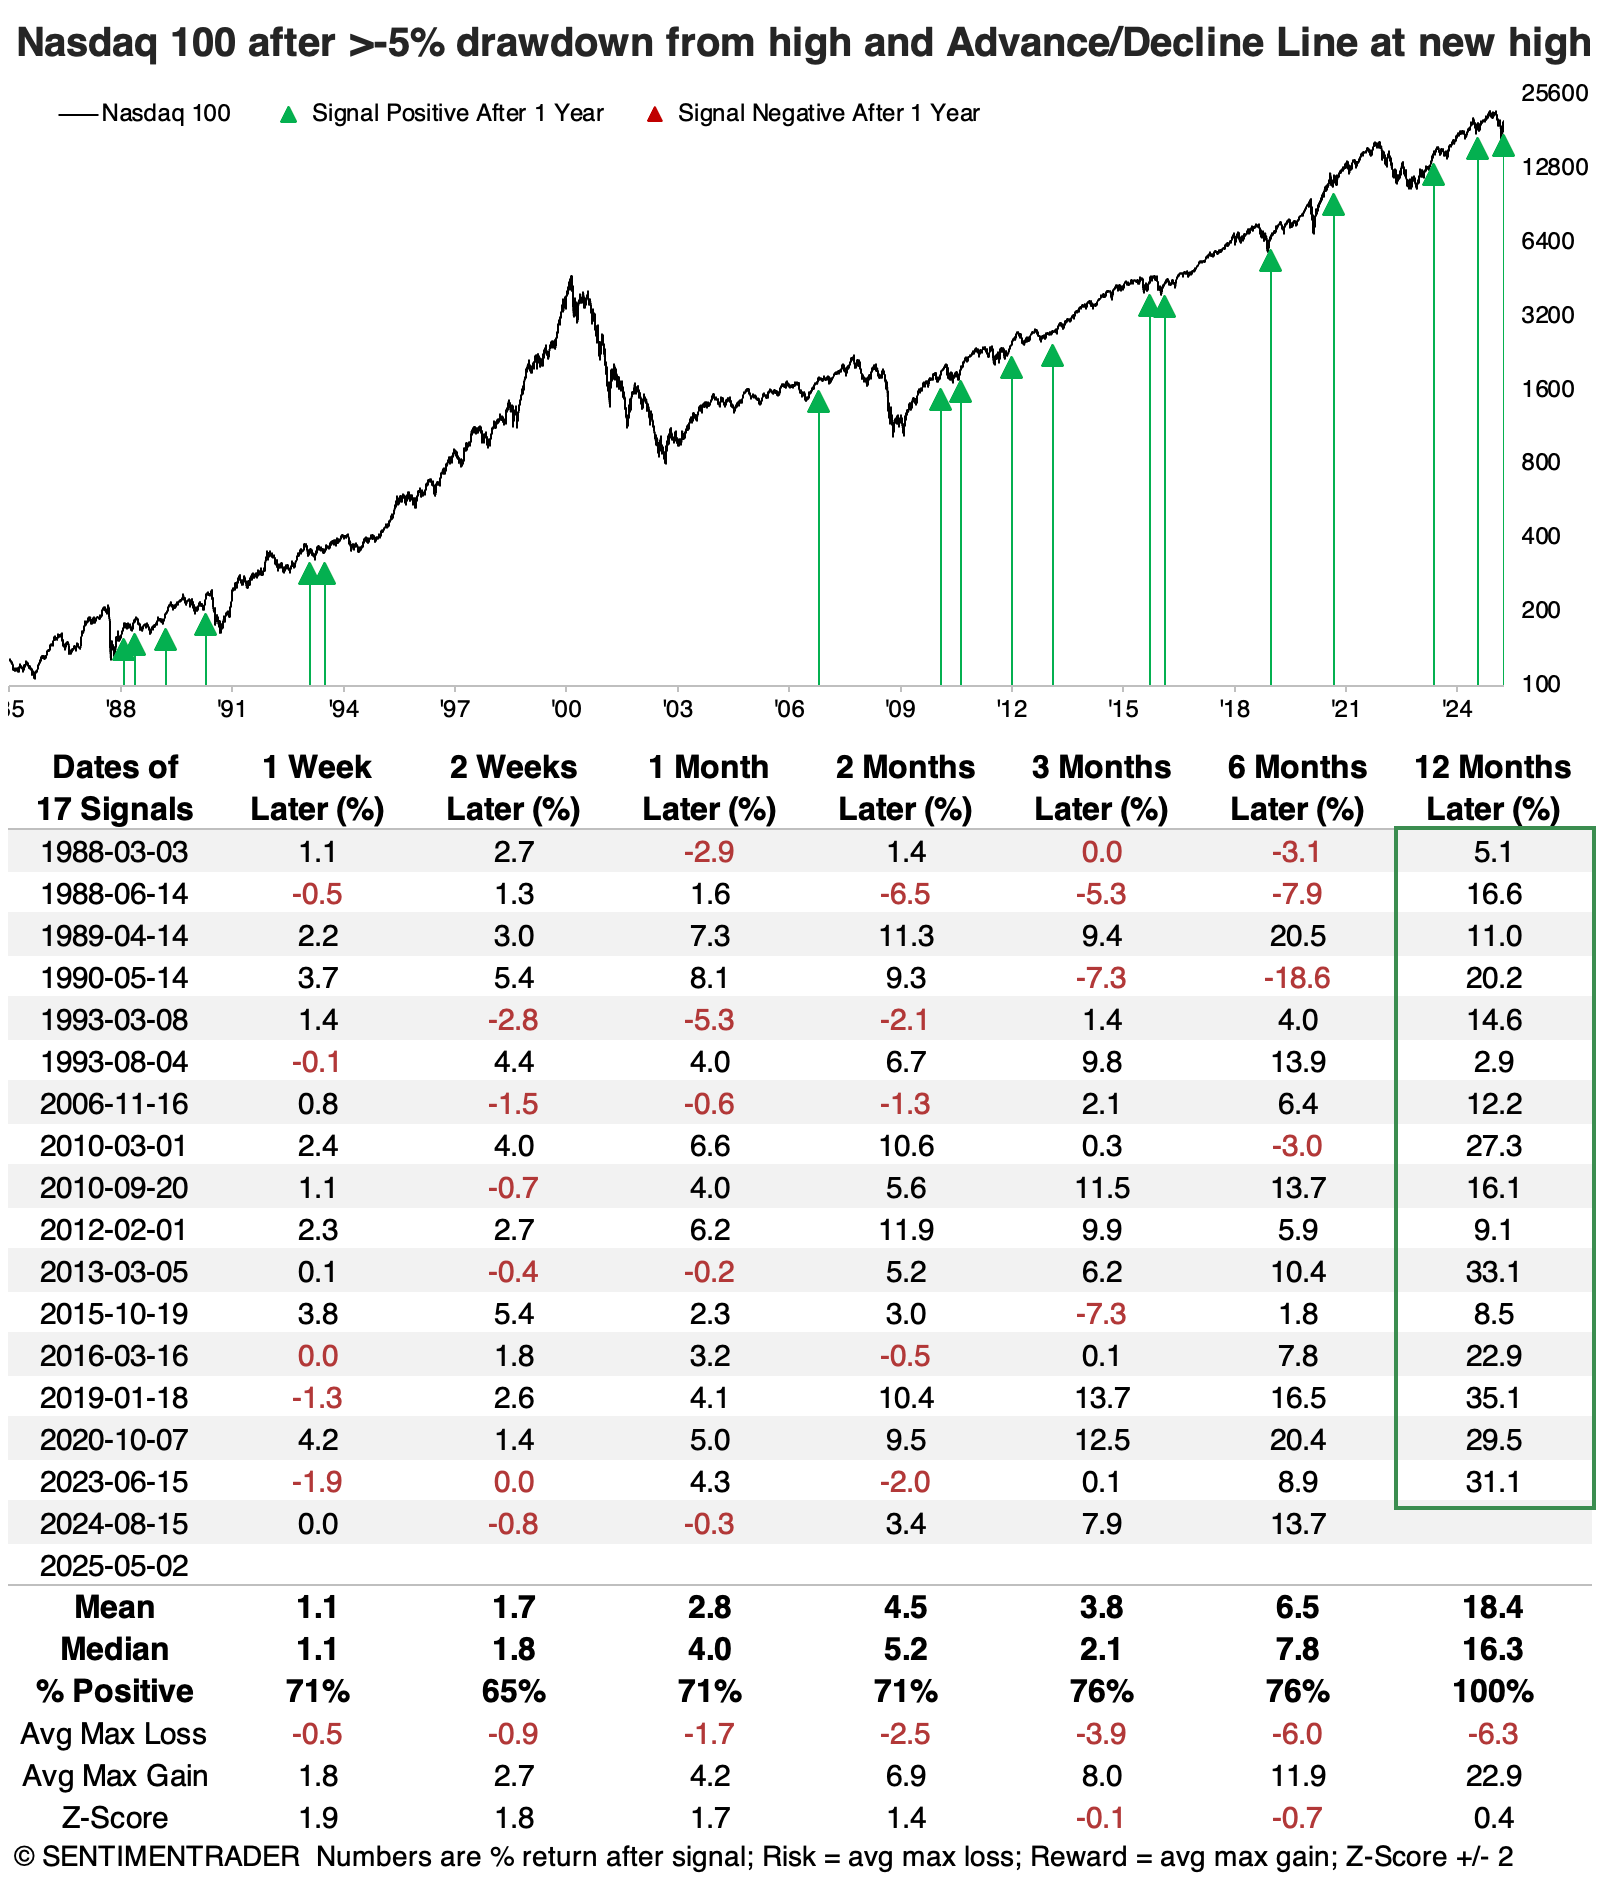
The table below shows that when the NDX's A/D Line reached a new high while the index was at least 5% off its high, its future returns were excellent across most time frames, with a 100% win rate a year later. Only 3 signals suffered more than a -10% drawdown within the following year, while 14 signals enjoyed a drawup of more than +10%.
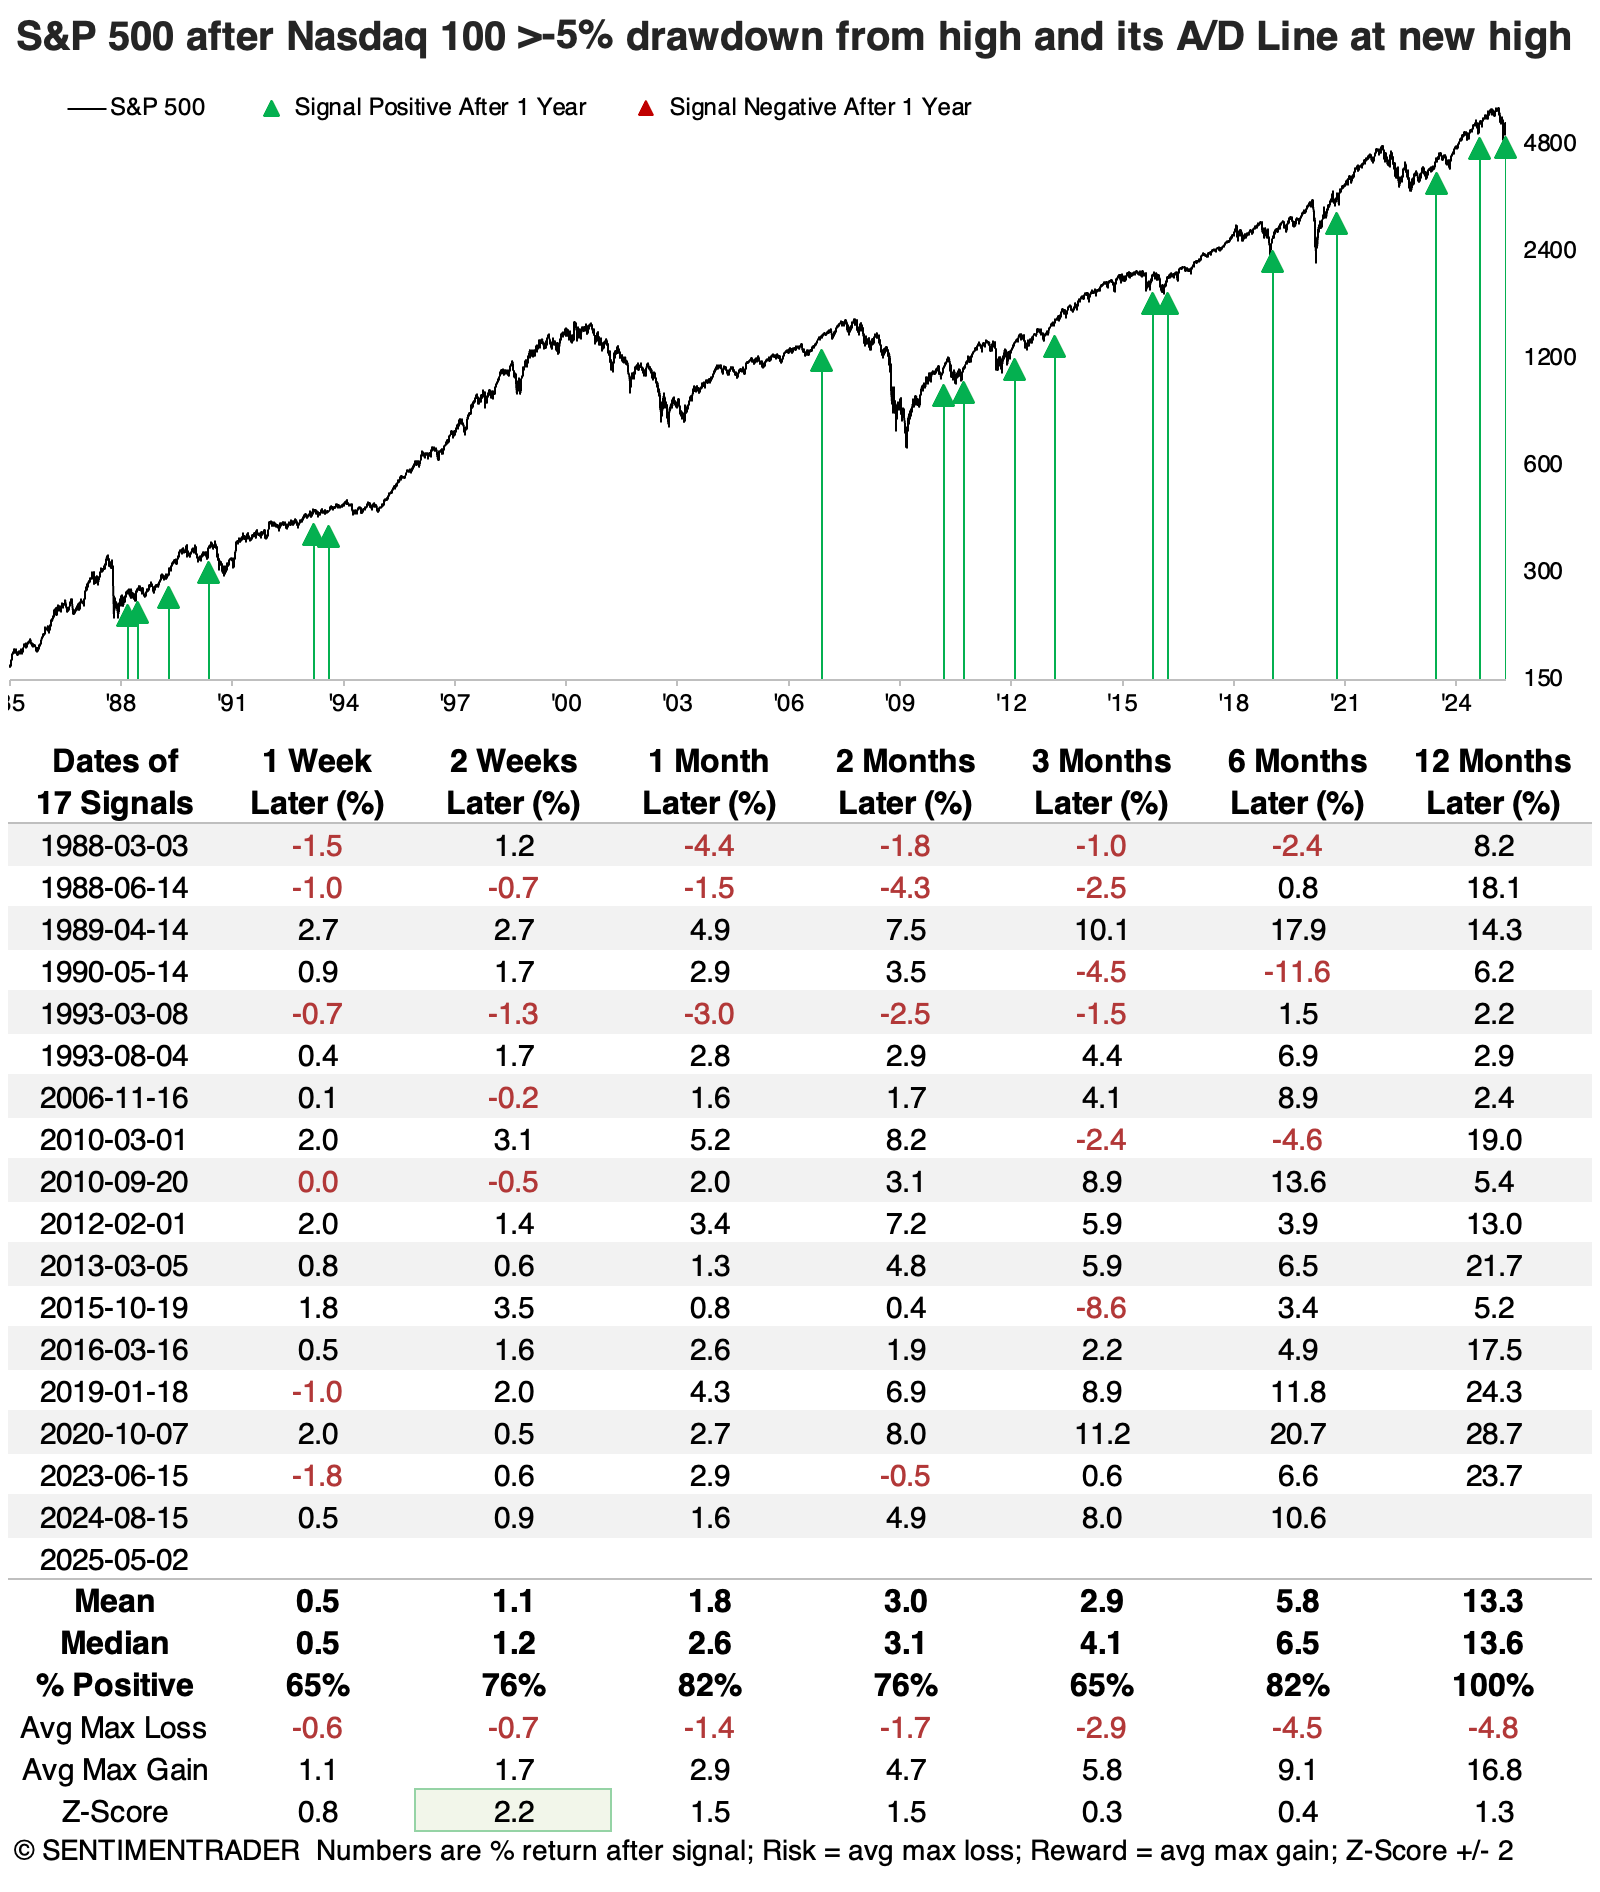
Good performance from big tech stocks also helped drive the S&P 500. Following the NDX signals, its returns were similarly impressive, with only 2 drawdowns larger than -10% within the following year.
What the research tells us...
Financial media headlines often focus on the most widely followed stocks and can generate the most attention. That leaves an opportunity for those who can rip their eyeballs away from what's most popular and look at what less-followed stocks or even the average stock are doing.
When we do that, we can see clearly that among the major indices, most stocks have been holding up well and have fully recovered from the initial round of the tariff tantrums. These signals tended to precede new highs in the indices themselves, though it often took a while. Most drawdowns tended to be limited, with few losses greater than -10% within the year. And it was rare to see a loss of any magnitude a year later. In fact, not a single signal preceded one.