Products
SentimenTrader Trading Tools
‍
Backtest Engine
My Trading Toolkit
Correlation Analysis
Seasonality
Indicators & Data API
‍
Proprietary Indicators & Charts
Market Data API
Strategies & Scanner
‍
50+ Trading Strategies
Smart Stock Scanner
Research Reports
‍
Research Solutions
Reports Library
Free Resources
Simple Backtest Calculator
Simple Seasonality Calculator
The Kelly Criterion Calculator
Sentiment Geo Map
Public Research Reports
Pricing
Company
About
In the News
Testimonials
Client Success Stories
Contact
Log inLoginSign up
< BACK TO ALL REPORTS

Bond sentiment turns sour

Jason Goepfert
2020-11-12
Sentiment on the bond market is starting to wane. The Optimism Index for that market just dropped below 50% for the first time in more than 6 months, which has tended to lead to further losses (and rising interest rates). Stocks held up well after these signals.

In a blurb in yesterday's Daily Report, we noted that for the first time in more than 6 months, investors pulled money out of bond mutual funds and ETFs. That's according to the Investment Company Institute, which monitors flows a bit differently than other organizations.

The flows are just one piece of evidence that sentiment toward the bond market has soured. That can also be seen in the Bond Optimism Index (Optix) which just dipped below 50 for the first time since the spring.

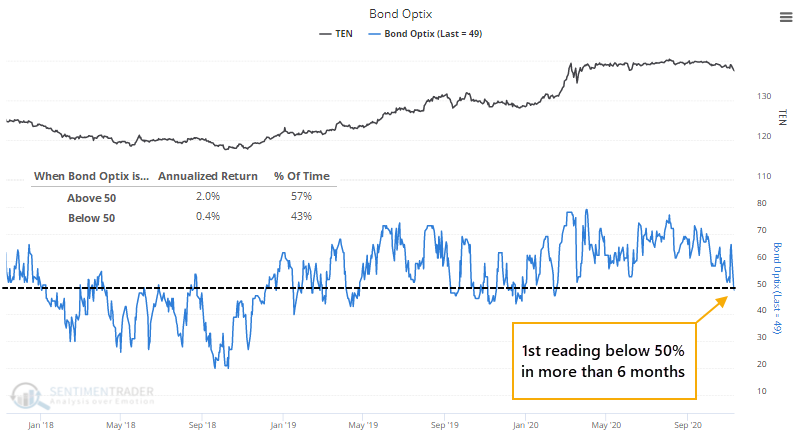
Like most of our Optimism Indexes, a market tends to do better when there is risk-on behavior, which typically just means the Optix is above 50. It's only when optimism gets extremely high that forward returns tend to suffer. For the Bond Optix, the 10-year Treasury note futures contract showed an annualized return when the Optix was above 50 that was 5x the return when it was below 50.

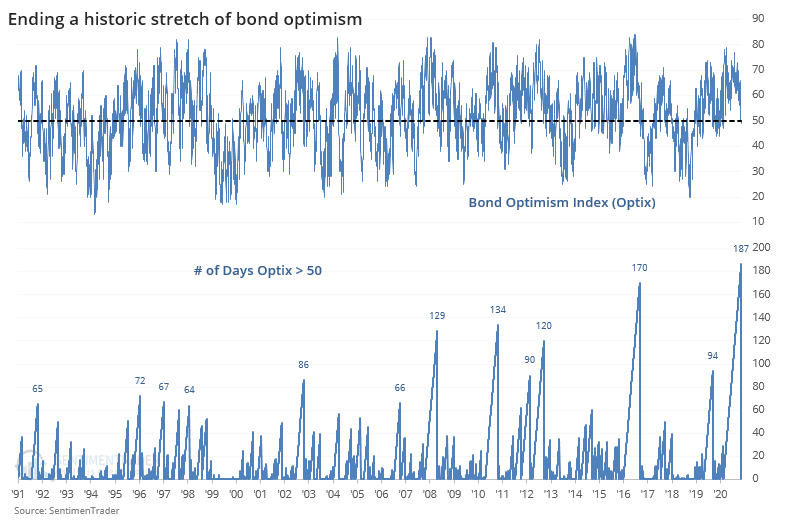
The drop in the Optix below 50 ends a record stretch for the model. It held above that threshold for 187 sessions, exceeding the prior record from 2016.

The table below shows every time the Bond Optimism Index held above 50 for at least 3 months, then fell below.

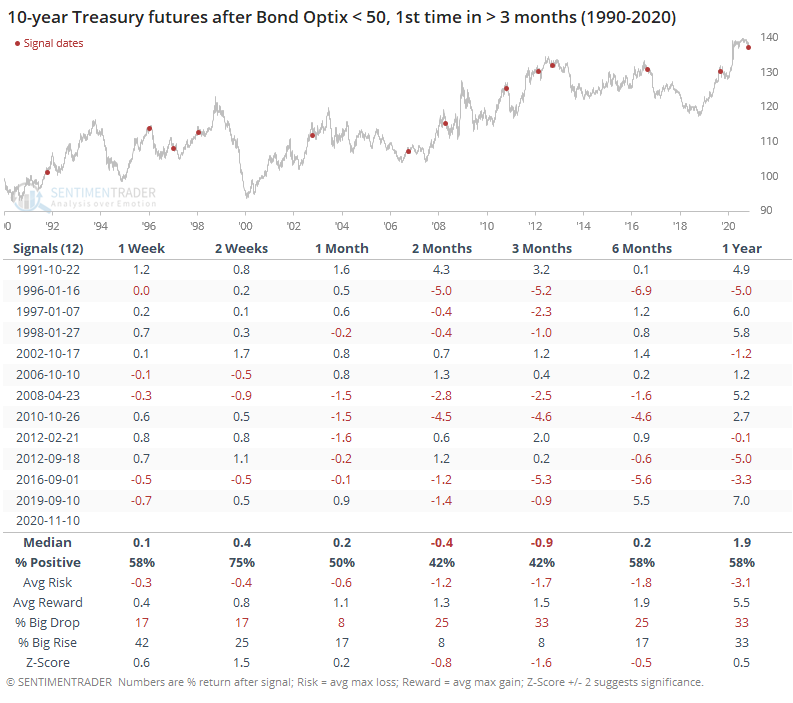
While the 10-year contract rebounded most of the time over the short-term, it fell back over the next 2-3 months, with a poor risk/reward and much larger probability of a big drop than a big rise (see this Knowledge Base article for more detail about the terms). Every one of the signals showed either a loss or less than a 1% gain sometime between 2-6 months later.

These drops in the bond market meant rising interest rates, but that wasn't much of a headwind for the stock market.

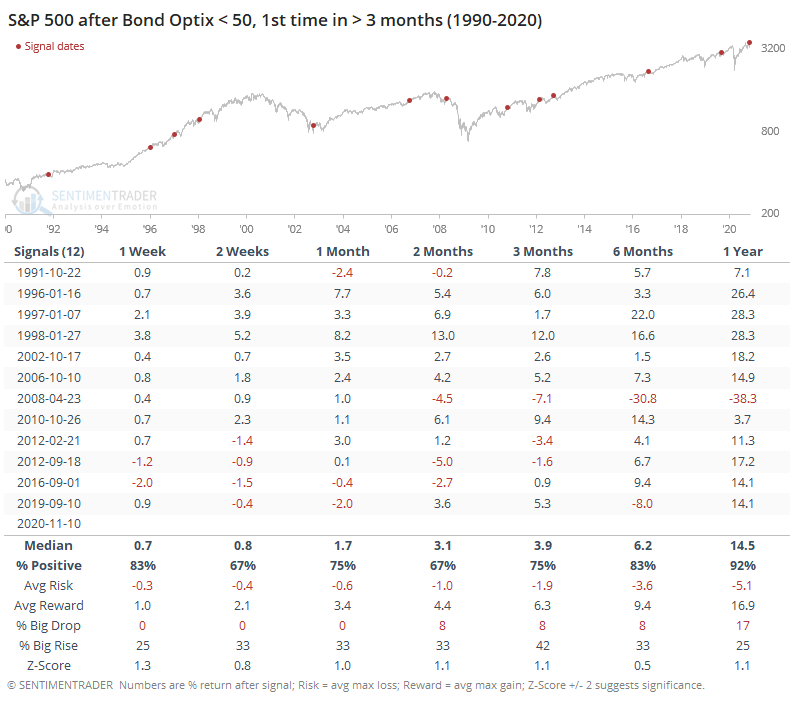
After these displays of waning optimism for bonds, the S&P 500 fared well in the months ahead. Over the next 3 months, the S&P rallied 8 out of 12 times, with really one a single loss of any consequence. Its overall risk/reward was good, and there was a 42% chance of a big rise versus only an 8% chance for a big drop within the first 3 months.

Note and bond prices have shown a modest tendency to rise when there is an outflow from mutual funds and ETFs focused on that market. But a wider perspective shows that other measures are weakening too, and aren't yet to a point that would indicate widespread pessimism. Under these conditions, bond prices have a stronger tendency to decline than rise. If Thursday's bond rally holds and turns the Optimism Index back above 50, then it will be a better sign, but the fact that it's already dipped below 50 suggests a tougher slog ahead.

Sorry, you don't have access to this report

Upgrade your subscription plan to get access
Go to Dasboard
PRODUCTS
SentimenTrader
Trading Tools
Indicators & Data API
‍
Strategies & Scanner
‍
Research Reports
FREE
RESOUrCES
Simple Backtest
Calculator
Simple Seasonality
Calculator
The Kelly Criterion
Calculator
Sentiment Geo Map
‍
Public Research Reports
‍
Pricing
Bundle pricing
‍
Announcements
‍
FAQ
COMPANY
‍
About
‍
In the News
‍
Testimonials
‍
Client Success Stories
CONTACT
‍
General Inquiries
‍
Media Inquiries
‍
Financial Professionals Inquiries
‍
© 2025 Sundial Capital Research Inc. All rights reserved.
Setsail Marketing
TermsPrivacyAffiliate Program
Risk Disclosure: Futures and forex trading contains substantial risk and is not for every investor. An investor could potentially lose all or more than the initial investment. Risk capital is money that can be lost without jeopardizing ones’ financial security or life style. Only risk capital should be used for trading and only those with sufficient risk capital should consider trading. Past performance is not necessarily indicative of future results.

Hypothetical Performance Disclosure: Hypothetical performance results have many inherent limitations, some of which are described below. No representation is being made that any account will or is likely to achieve profits or losses similar to those shown; in fact, there are frequently sharp differences between hypothetical performance results and the actual results subsequently achieved by any particular trading program. One of the limitations of hypothetical performance results is that they are generally prepared with the benefit of hindsight. In addition, hypothetical trading does not involve financial risk, and no hypothetical trading record can completely account for the impact of financial risk of actual trading. for example, the ability to withstand losses or to adhere to a particular trading program in spite of trading losses are material points which can also adversely affect actual trading results. There are numerous other factors related to the markets in general or to the implementation of any specific trading program which cannot be fully accounted for in the preparation of hypothetical performance results and all which can adversely affect trading results.

Testimonial Disclosure: Testimonials appearing on this website may not be representative of other clients or customers and is not a guarantee of future performance or success.