
Bond Risk Levels send a message

Key points:
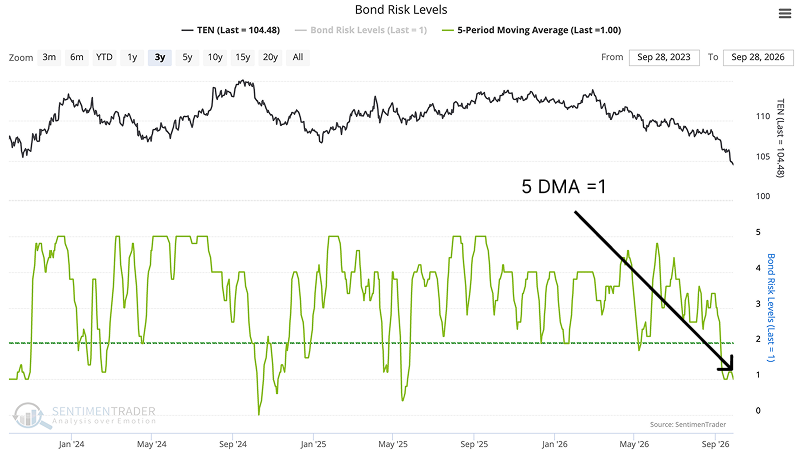
- The 5-day average of Bond Risk Levels is back at a low level.
- Historically, SPX weakness after these readings clustered in the first month.
- Six-month median returns recovered toward ordinary levels, but the interim adverse paths were deeper.
- Yet after the same readings, the 10-year Treasury data offered no clear direction.
Bond Risk Levels return to a low level
Bond Risk Levels is derived from bond market data to assess the current state of the bond market. The chart below displays the 5-day moving average of our Bond Risk Levels indicator (green line). The 5-day average of Bond Risk Levels has fallen to exactly 1, a low reading that has appeared only intermittently. The study identifies the first date of each new episode in which the average reaches that level.
A low risk reading sounds like reassuring news for the market, and we looked to history for the answer.
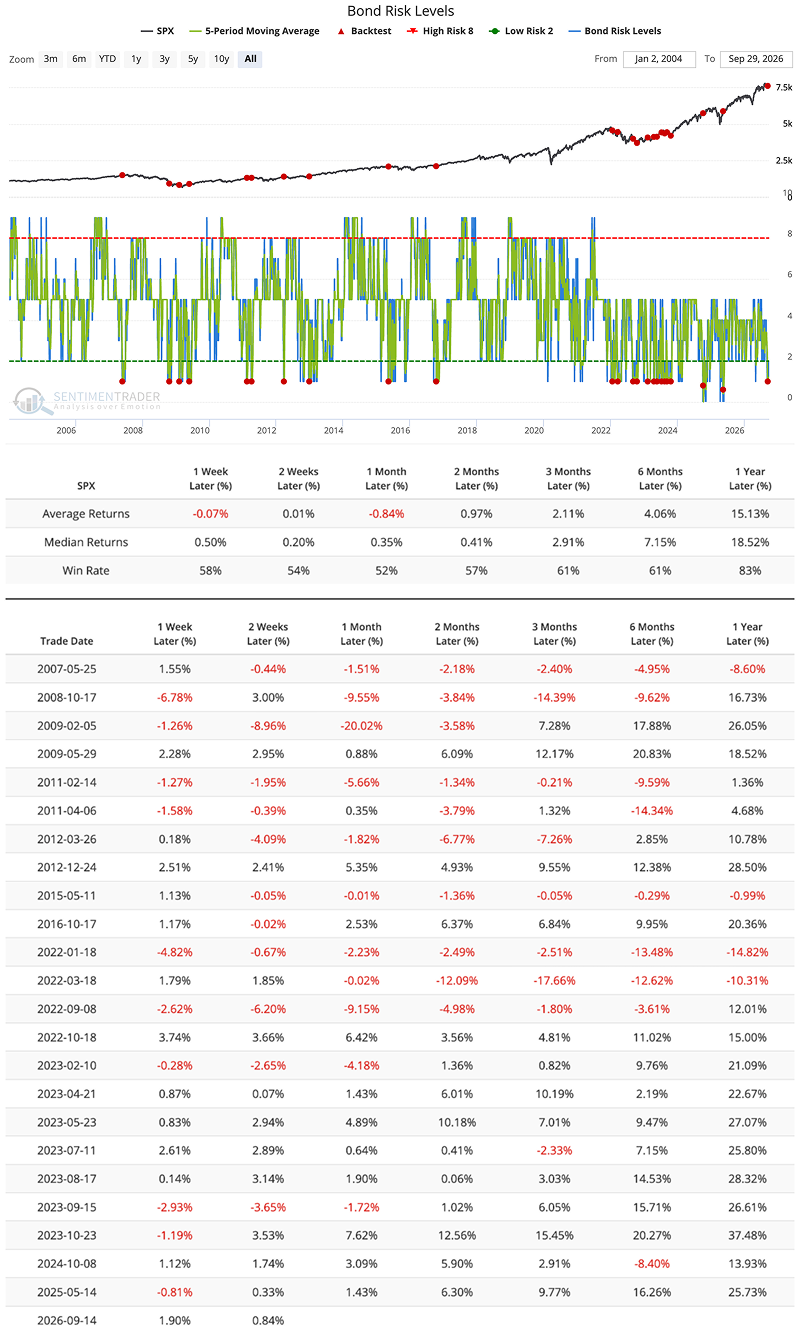
The one-month average was negative, but the median remained slightly positive and 52% of cases gained. The short-term warning therefore came mainly from a minority of larger losse