
Bond Option Sentiment Signals Short-Term Crowding Risk

Key Points:
- The 50-day moving average of the 10-year Treasury bond option Put/Call Ratio (PCR) has hit a 3-year low.
- TLT (20+ Year Treasury Bond ETF) has achieved a technical breakout, with prices moving above the 50-day moving average.
- There is a divergence between institutional capital flows and retail sentiment, as hedge funds are reducing their bond exposure.
- Under similar condition, the bond market faces short-term pullback pressure.
Bond Option Technical Indicator Breakout
The fixed income market has recently experienced a long-awaited rally, and technical indicators have confirmed this positive shift. As TLT successfully broke above its 50-day moving average, market attention on bonds has increased significantly. In this context, we analyzed the historical signal performance of several sentiment indicators on our platform under current conditions.
Institutional Investors' Cautious Exit
Professional investors seem to have maintained a relatively restrained attitude towards this rally and tend to use it as an opportunity to adjust positions. Hedge funds' bond exposure indicator is falling below the 0.6 threshold, indicating a decline in institutional interest.
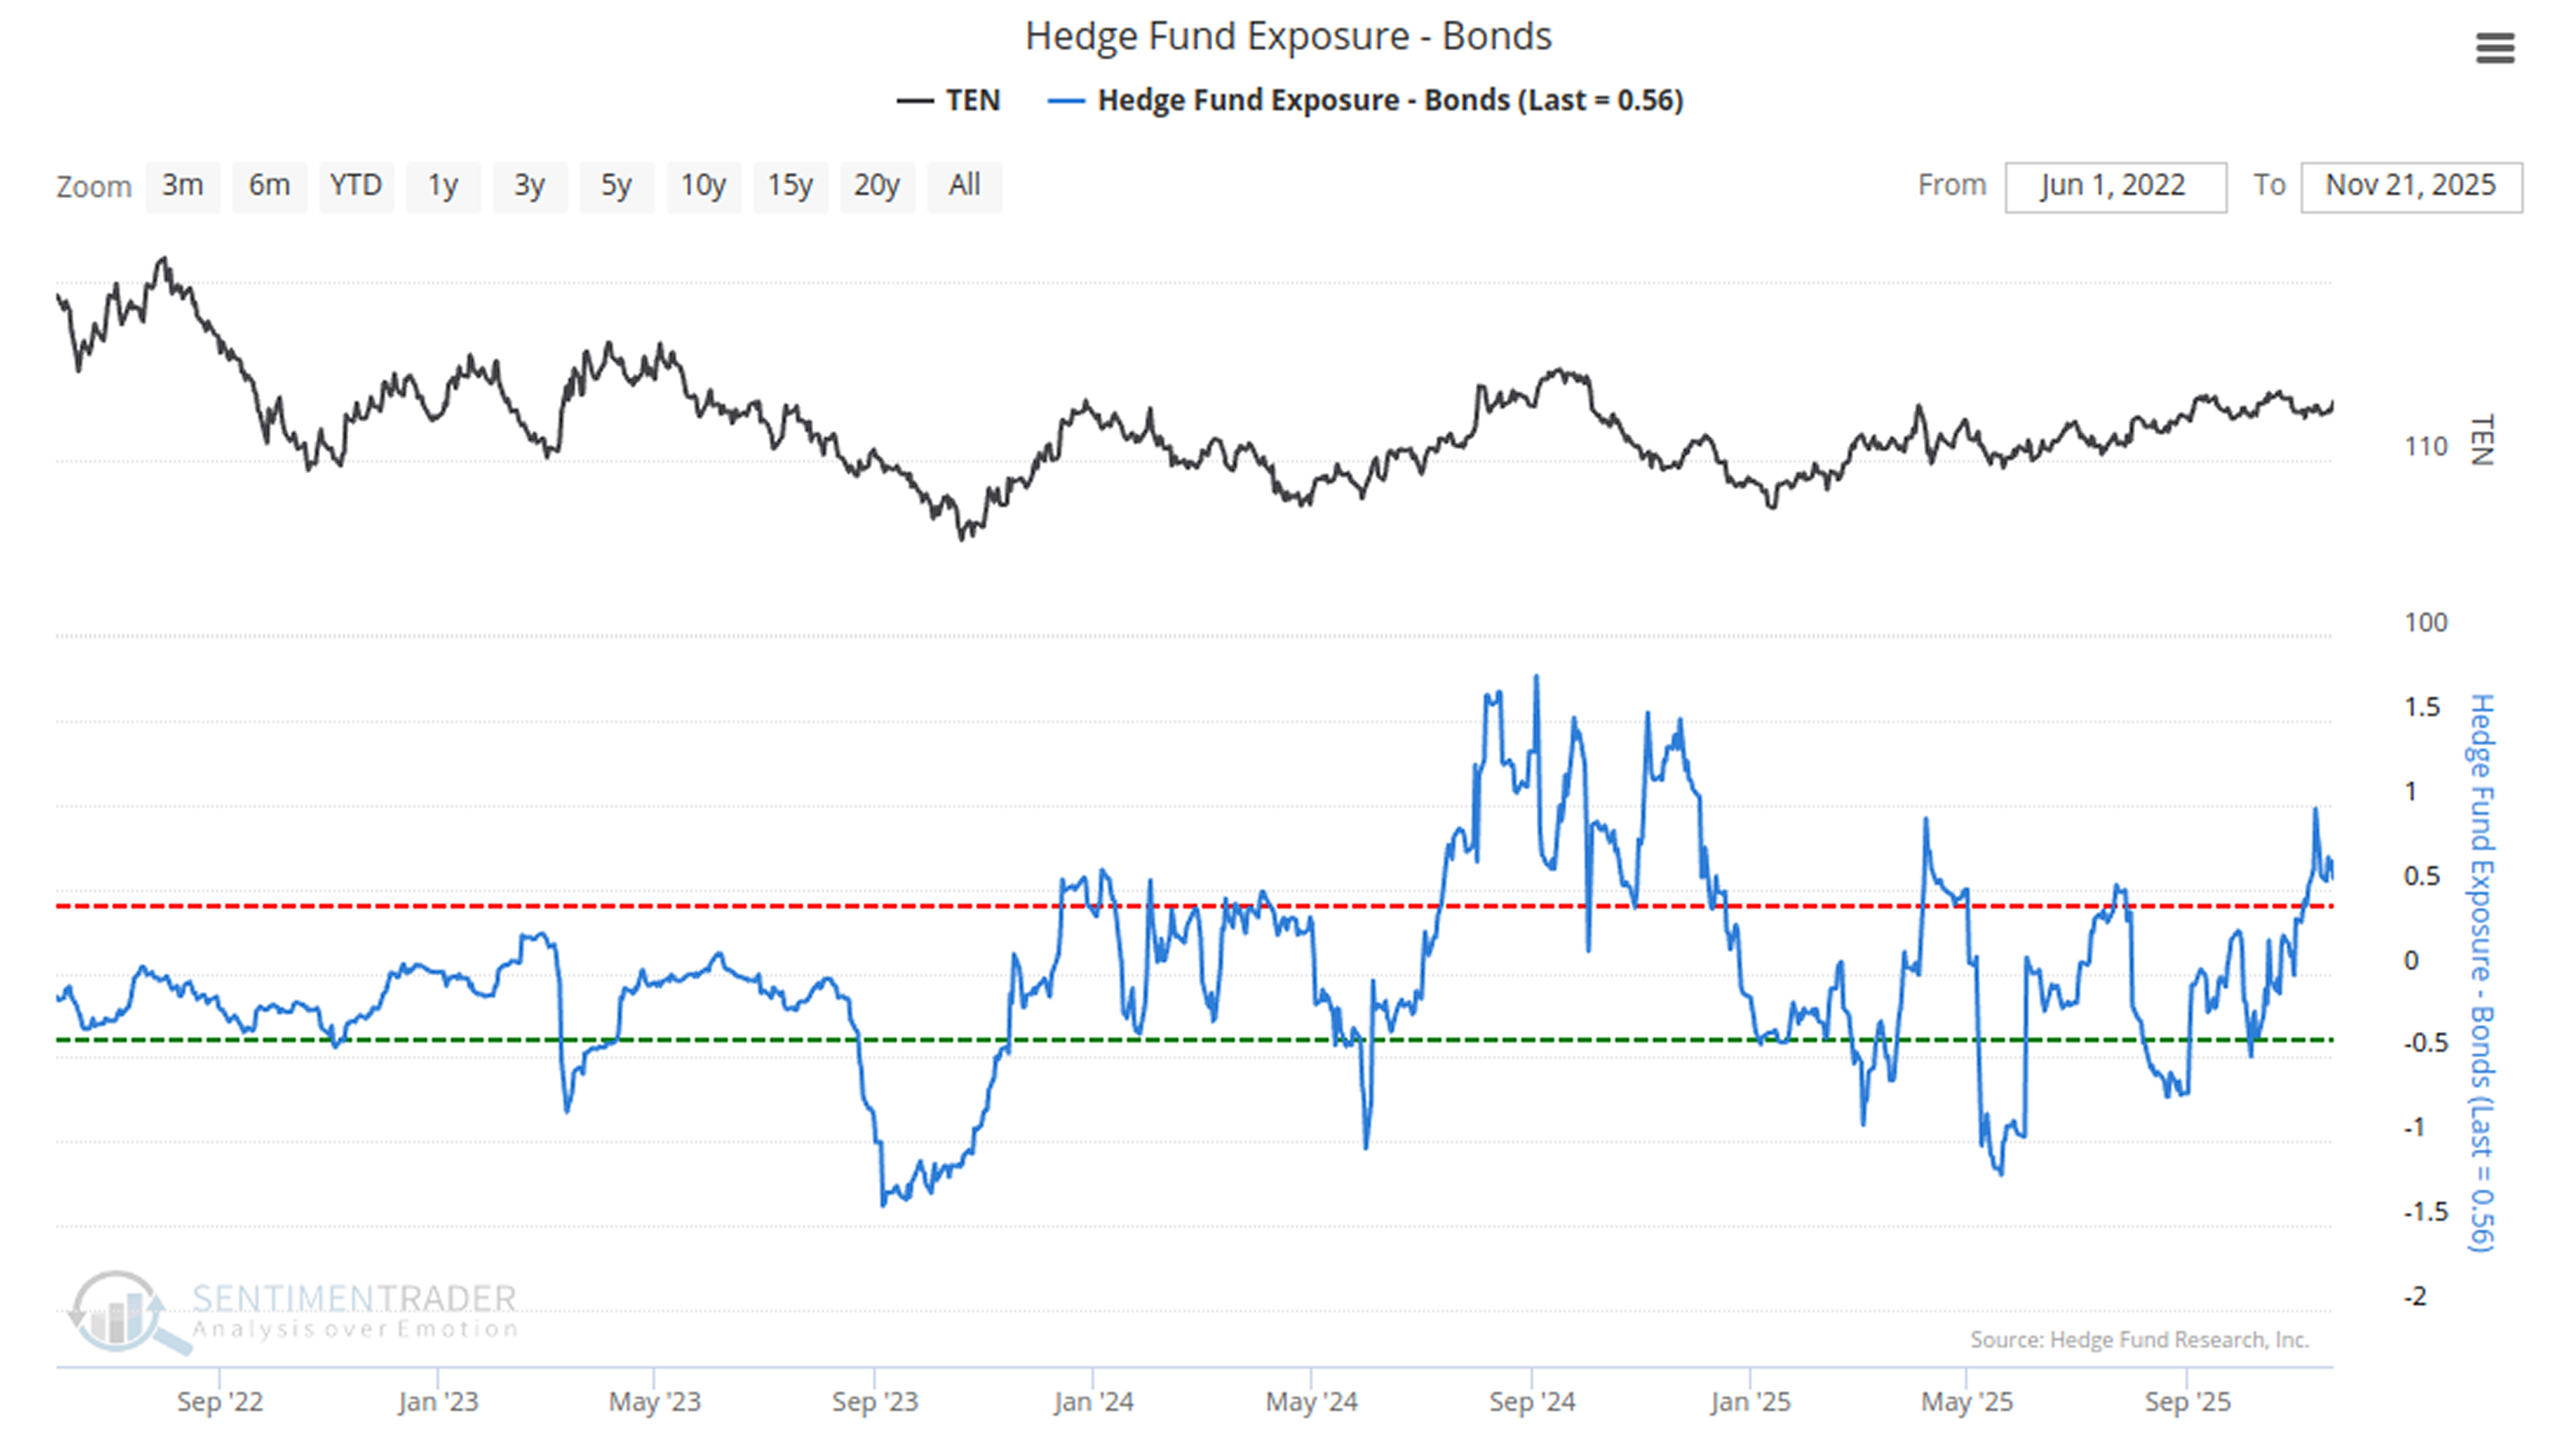
Historical performance corresponding to this signal is as follows:Related Backtest Click Here.
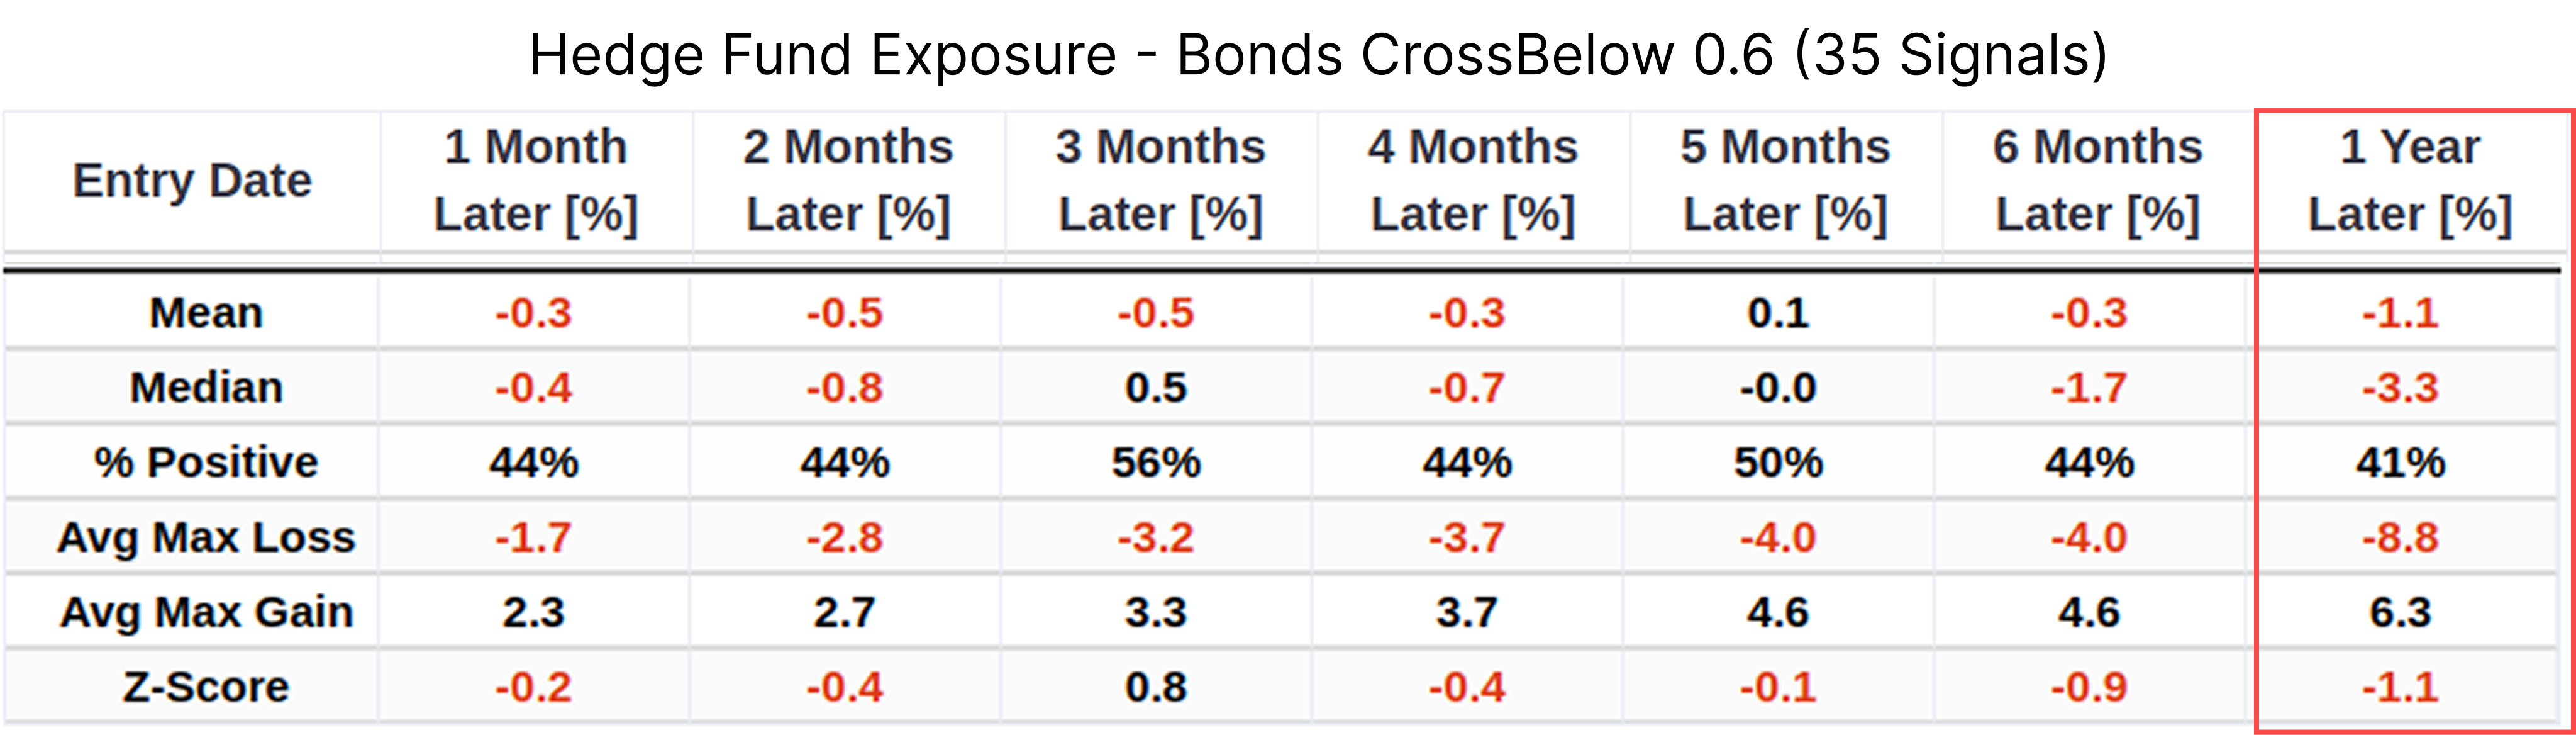
Within one year after the signal is triggered, the average return of bonds is -1.1%, and the median return is -3.3%. This typical bearish divergence between institutional capital outflows and price increases suggests that the sustainability of the rally may face challenges.
Crowding Signals in the Option Market
Meanwhile, the option market, an area highly sensitive to sentiment, shows signs of trading crowding.
The 50-day moving average of the 10-year Treasury bond Put/Call Ratio (PCR) has dropped to an extremely low historical level (756 Low). This means market participants are currently highly inclined to bet on price increases through call options, while demand for downside protection has fallen to a minimum.
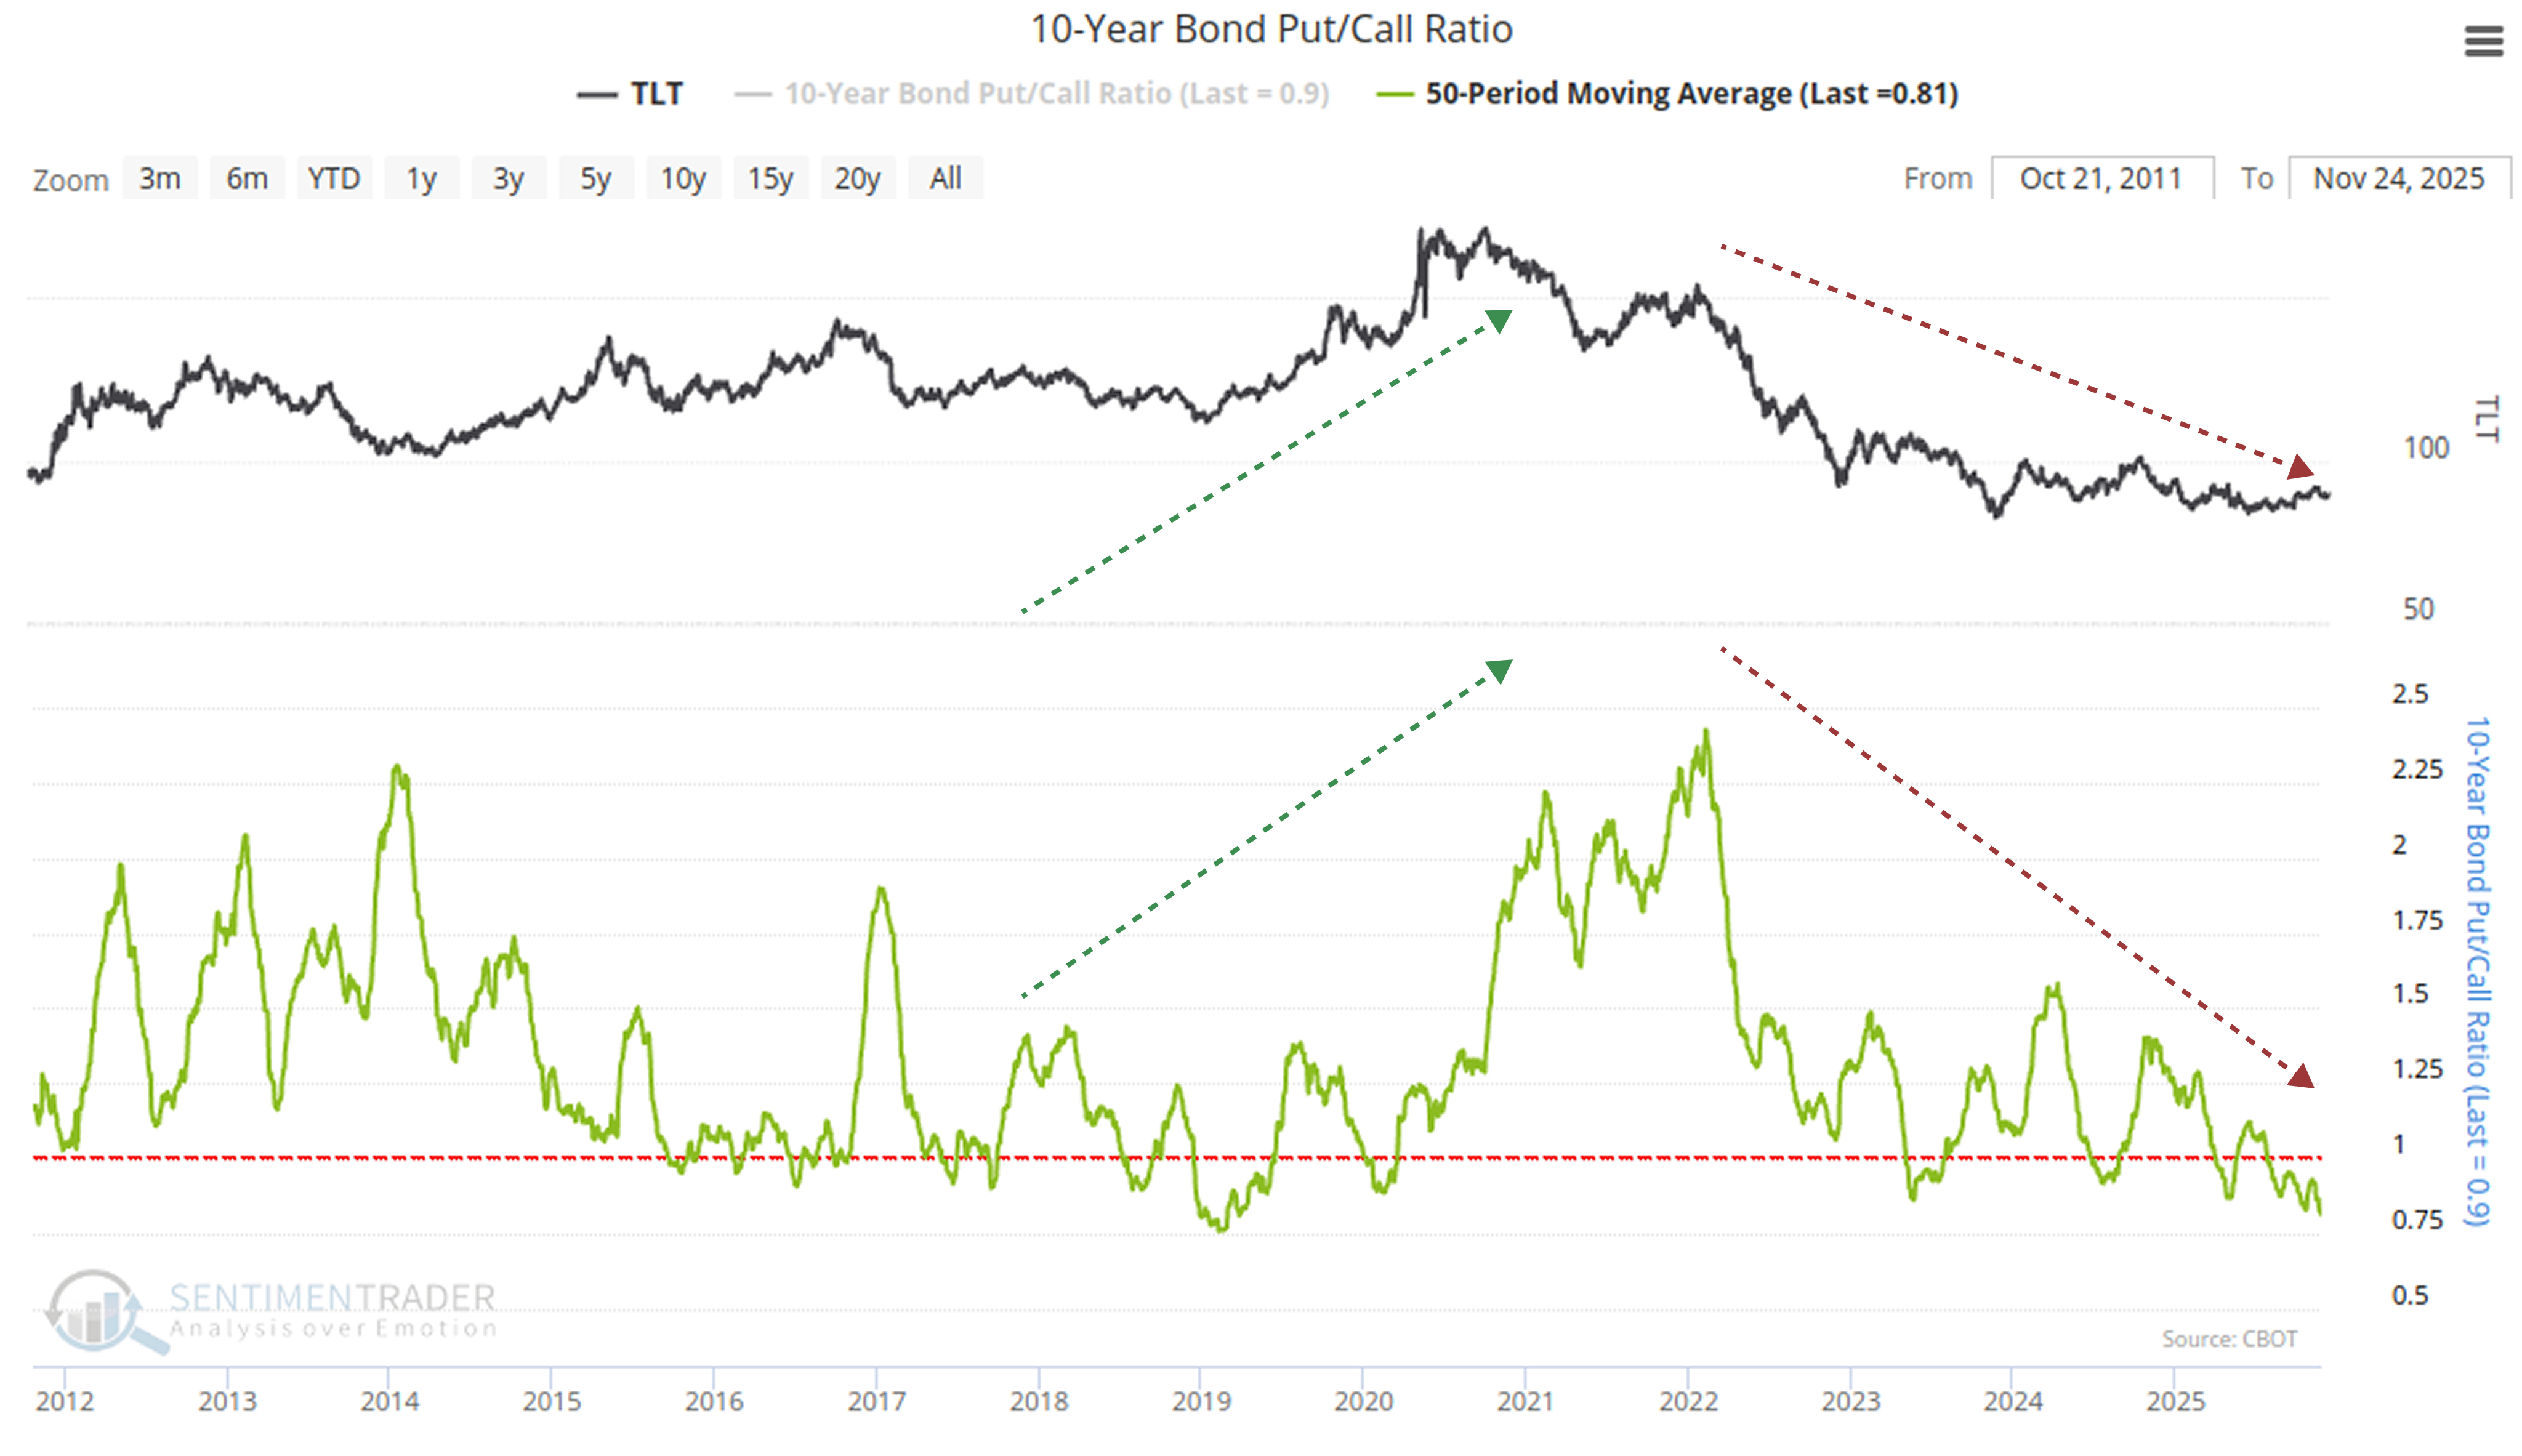
This is not a completely healthy sign. Sentiment in the bond option market often exhibits reflexivity. While extremely low PCR may persist in a handful of strong trends, in most cases, it marks periodic sentiment extremes.
Historical data from similar periods suggests we need to exercise patience. When the PCR moving average reaches the current low level (as newly triggered on November 24, 2025), TLT often faces headwinds in the medium to short term.Related Backtest Click Here.
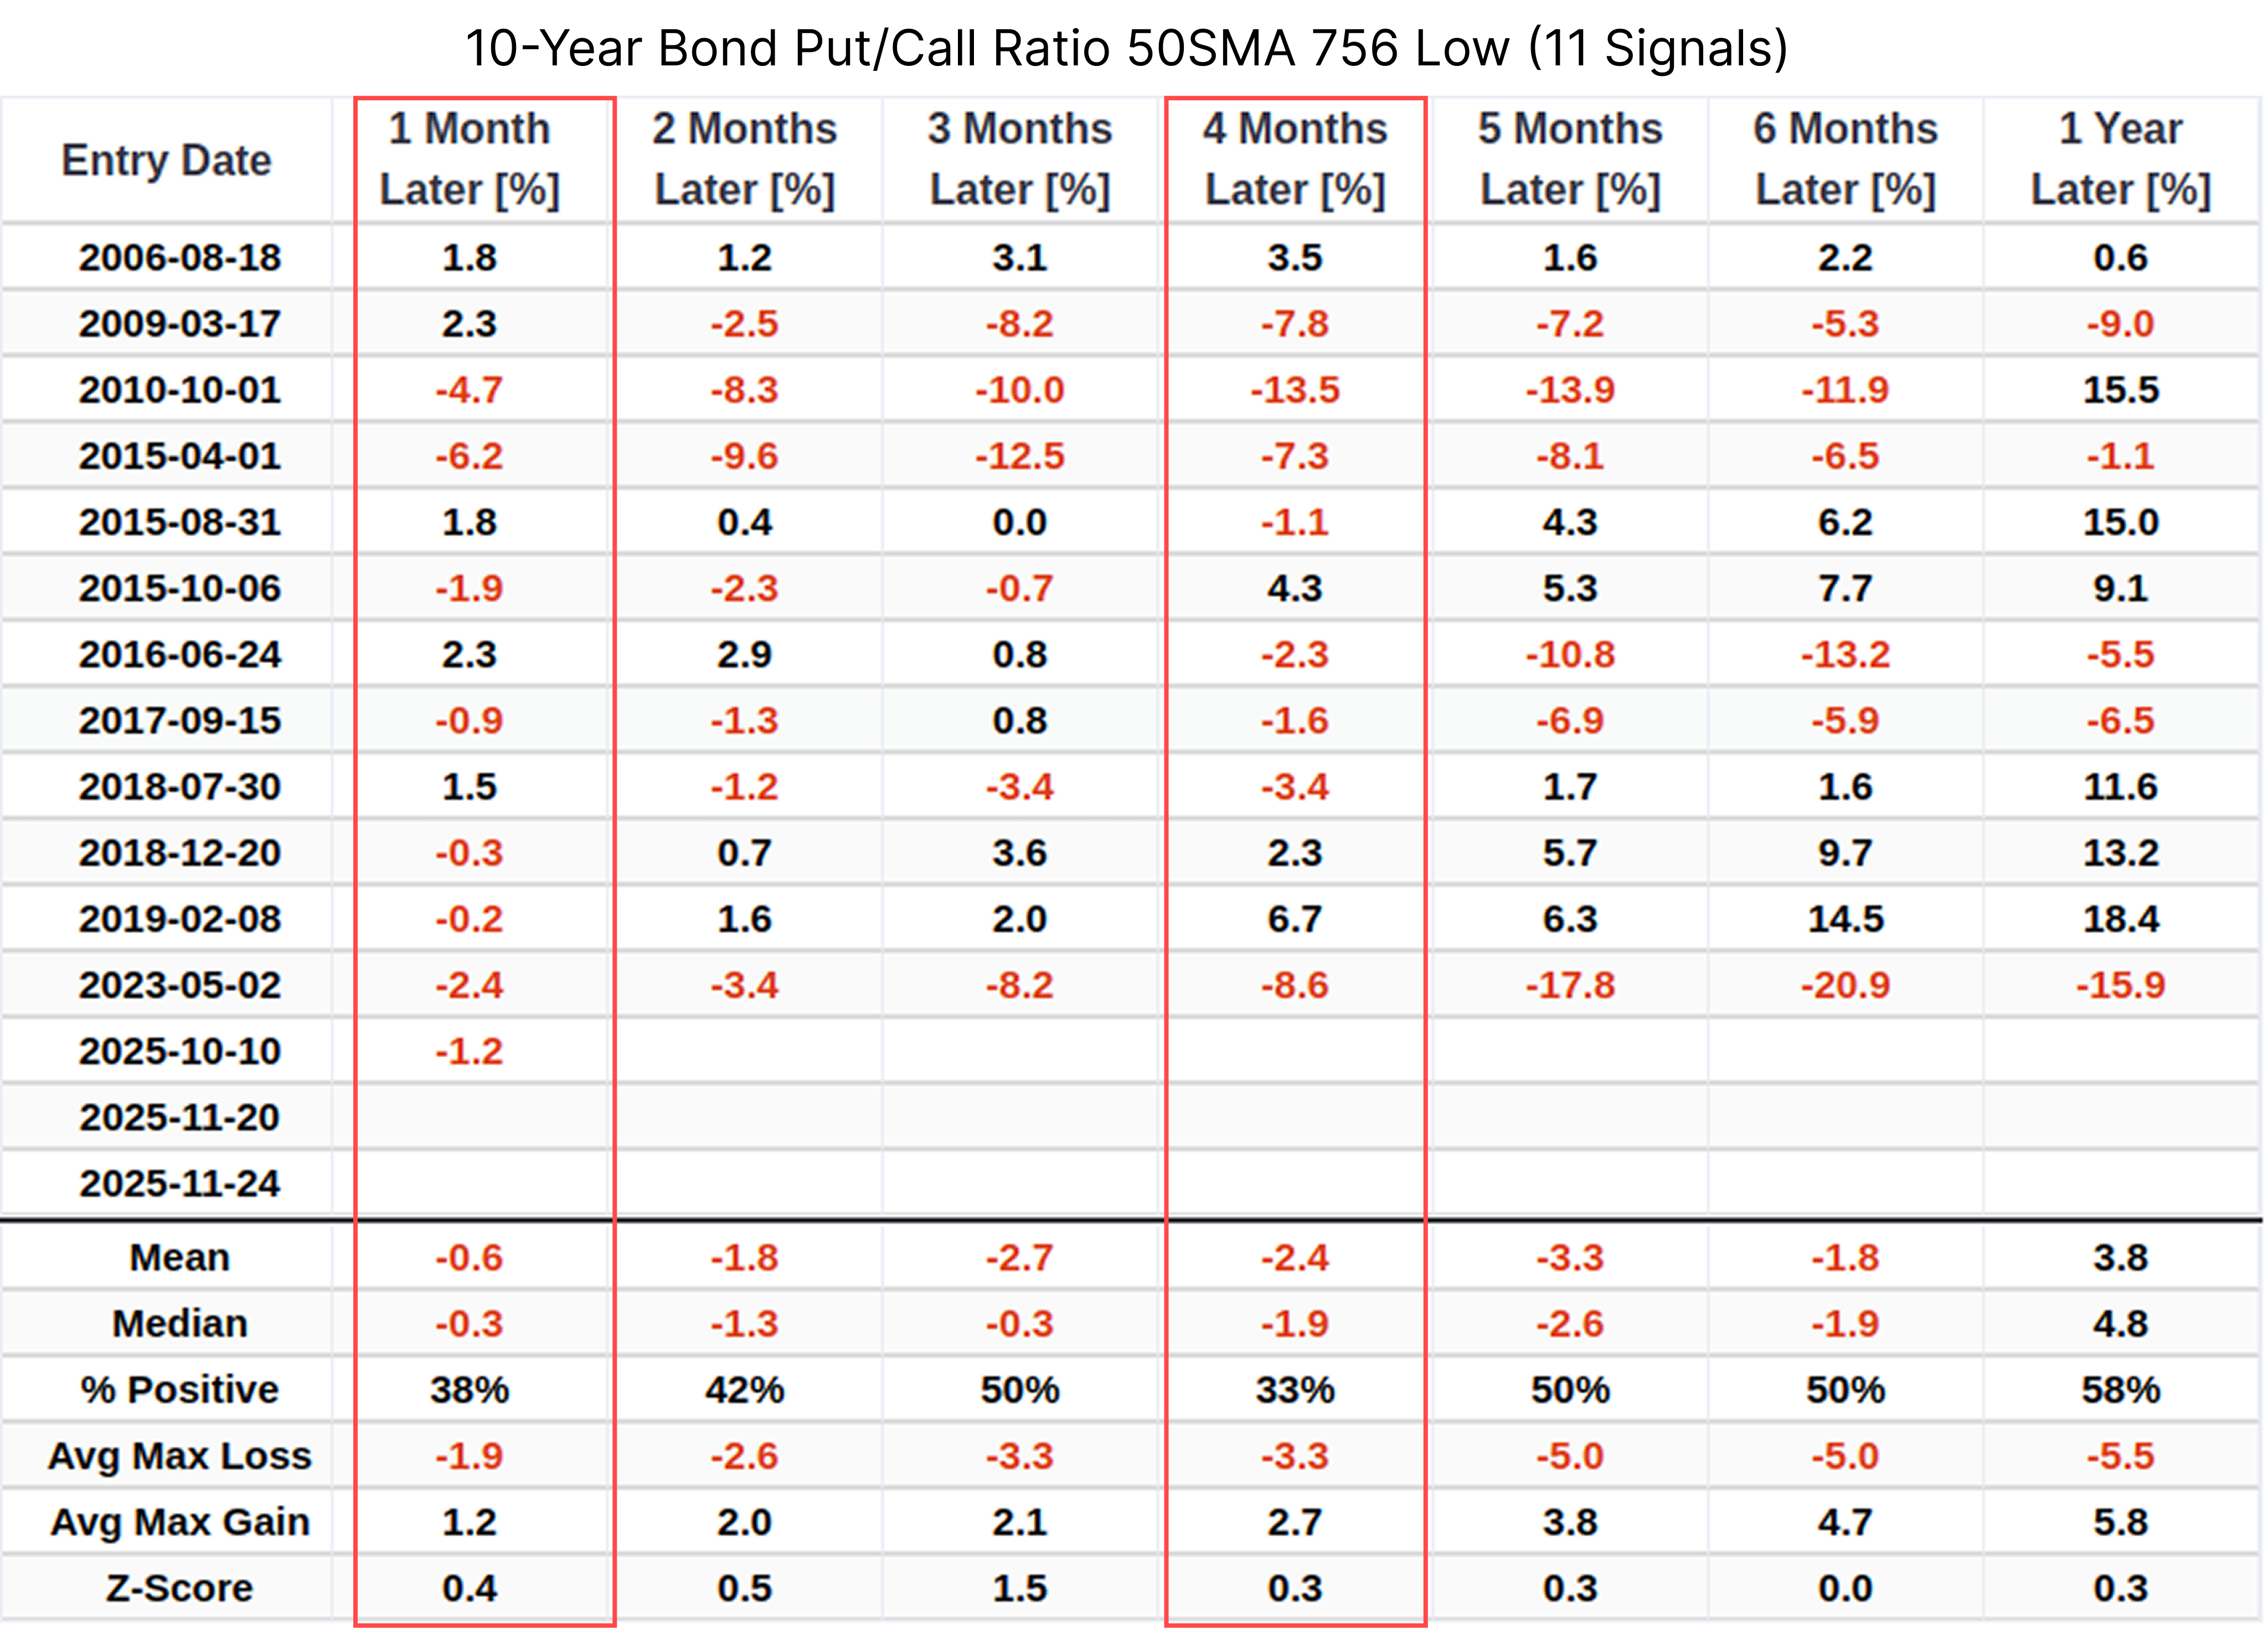
In particular, the win rate after 1 month and 4 months is a dismal 30-odd percent. These data do not imply a collapse, but they indicate that investors entering at this node of heightened sentiment may need to endure short-term volatility and unrealized losses.
Considerations on Technical Patterns and Capital Flows
Returning to TLT's own technical pattern, it has triggered a momentum signal of "breaking above the 50-day moving average with CCI greater than 100 and PCR greater than 0.9."Related Backtest Click Here.
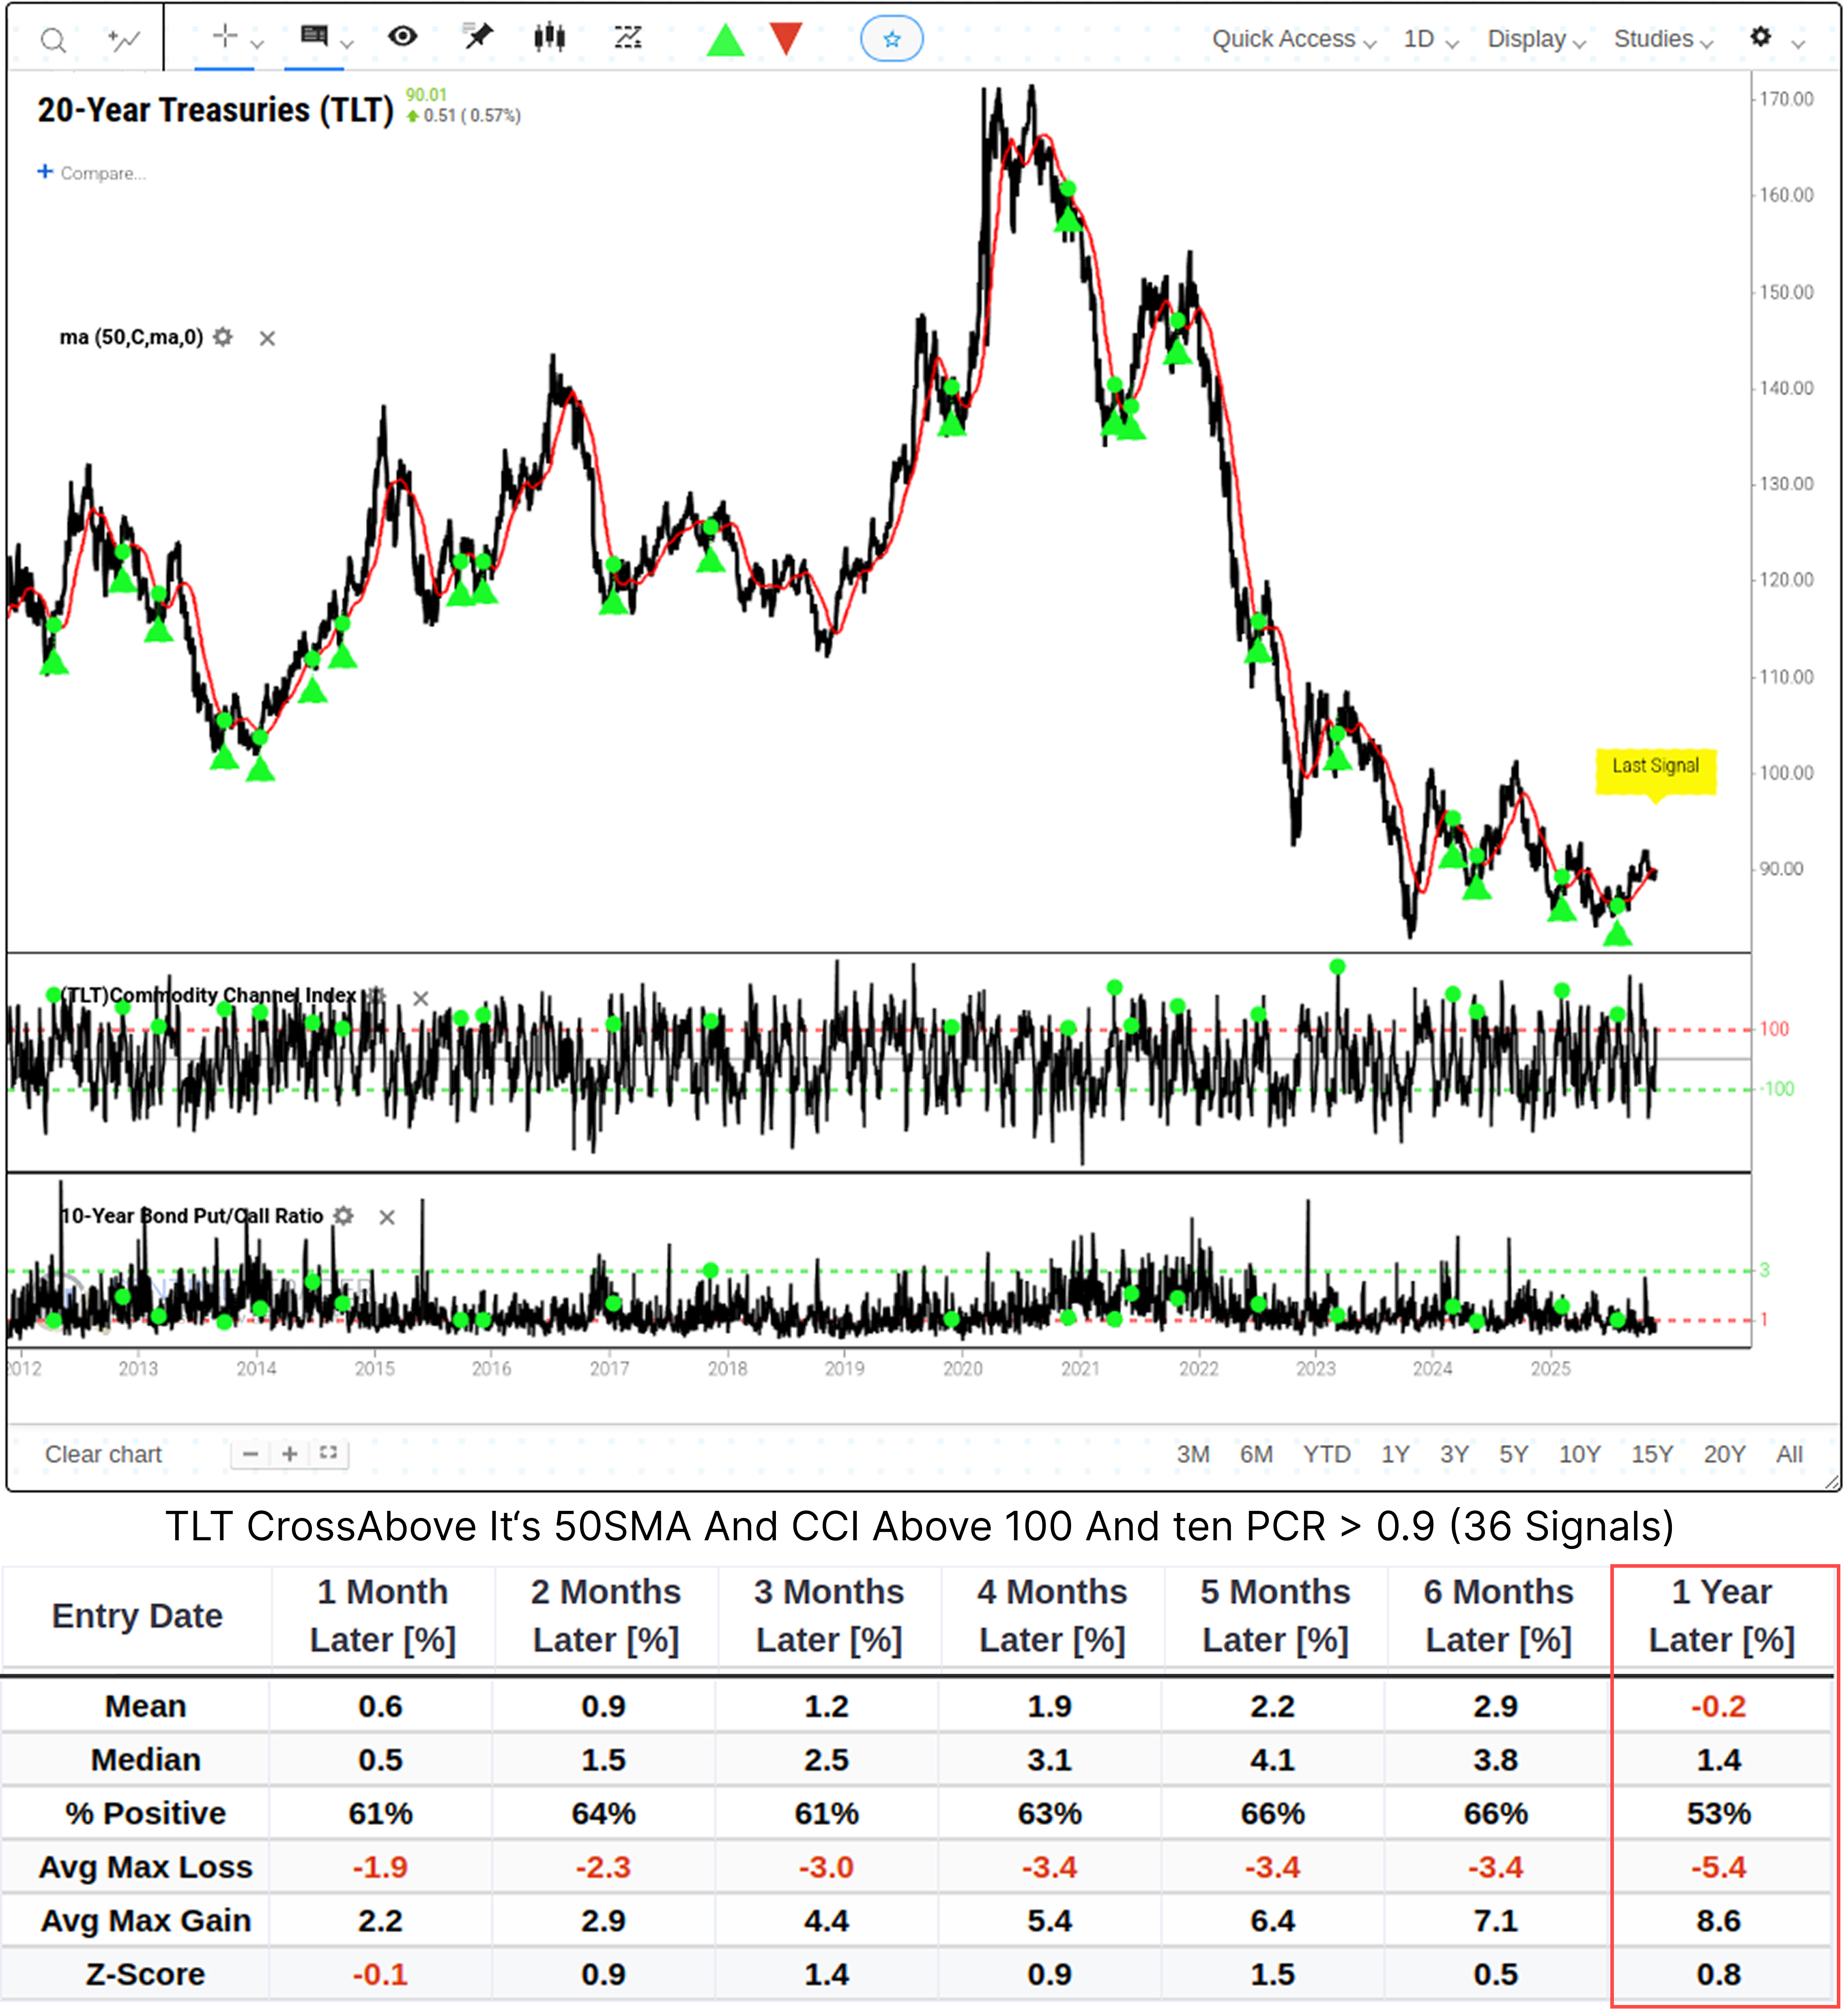
On the surface, this appears to be a positive buying opportunity. However, we need to view this signal dialectically. Although the average return one month after the signal is triggered is a slight 0.6%, extending to one year, the average return turns negative at -0.2%. This suggests that the current breakout is driven more by short-term momentum, and for long-term investors, the current entry point may not be in a cost-advantaged zone.
Capital flows also fail to provide sufficient confidence. While TLT's capital flow indicator has remained above the 0-axis for consecutive periods, indicating inflows, this has not translated into significant excess returns.Related Backtest Click Here.
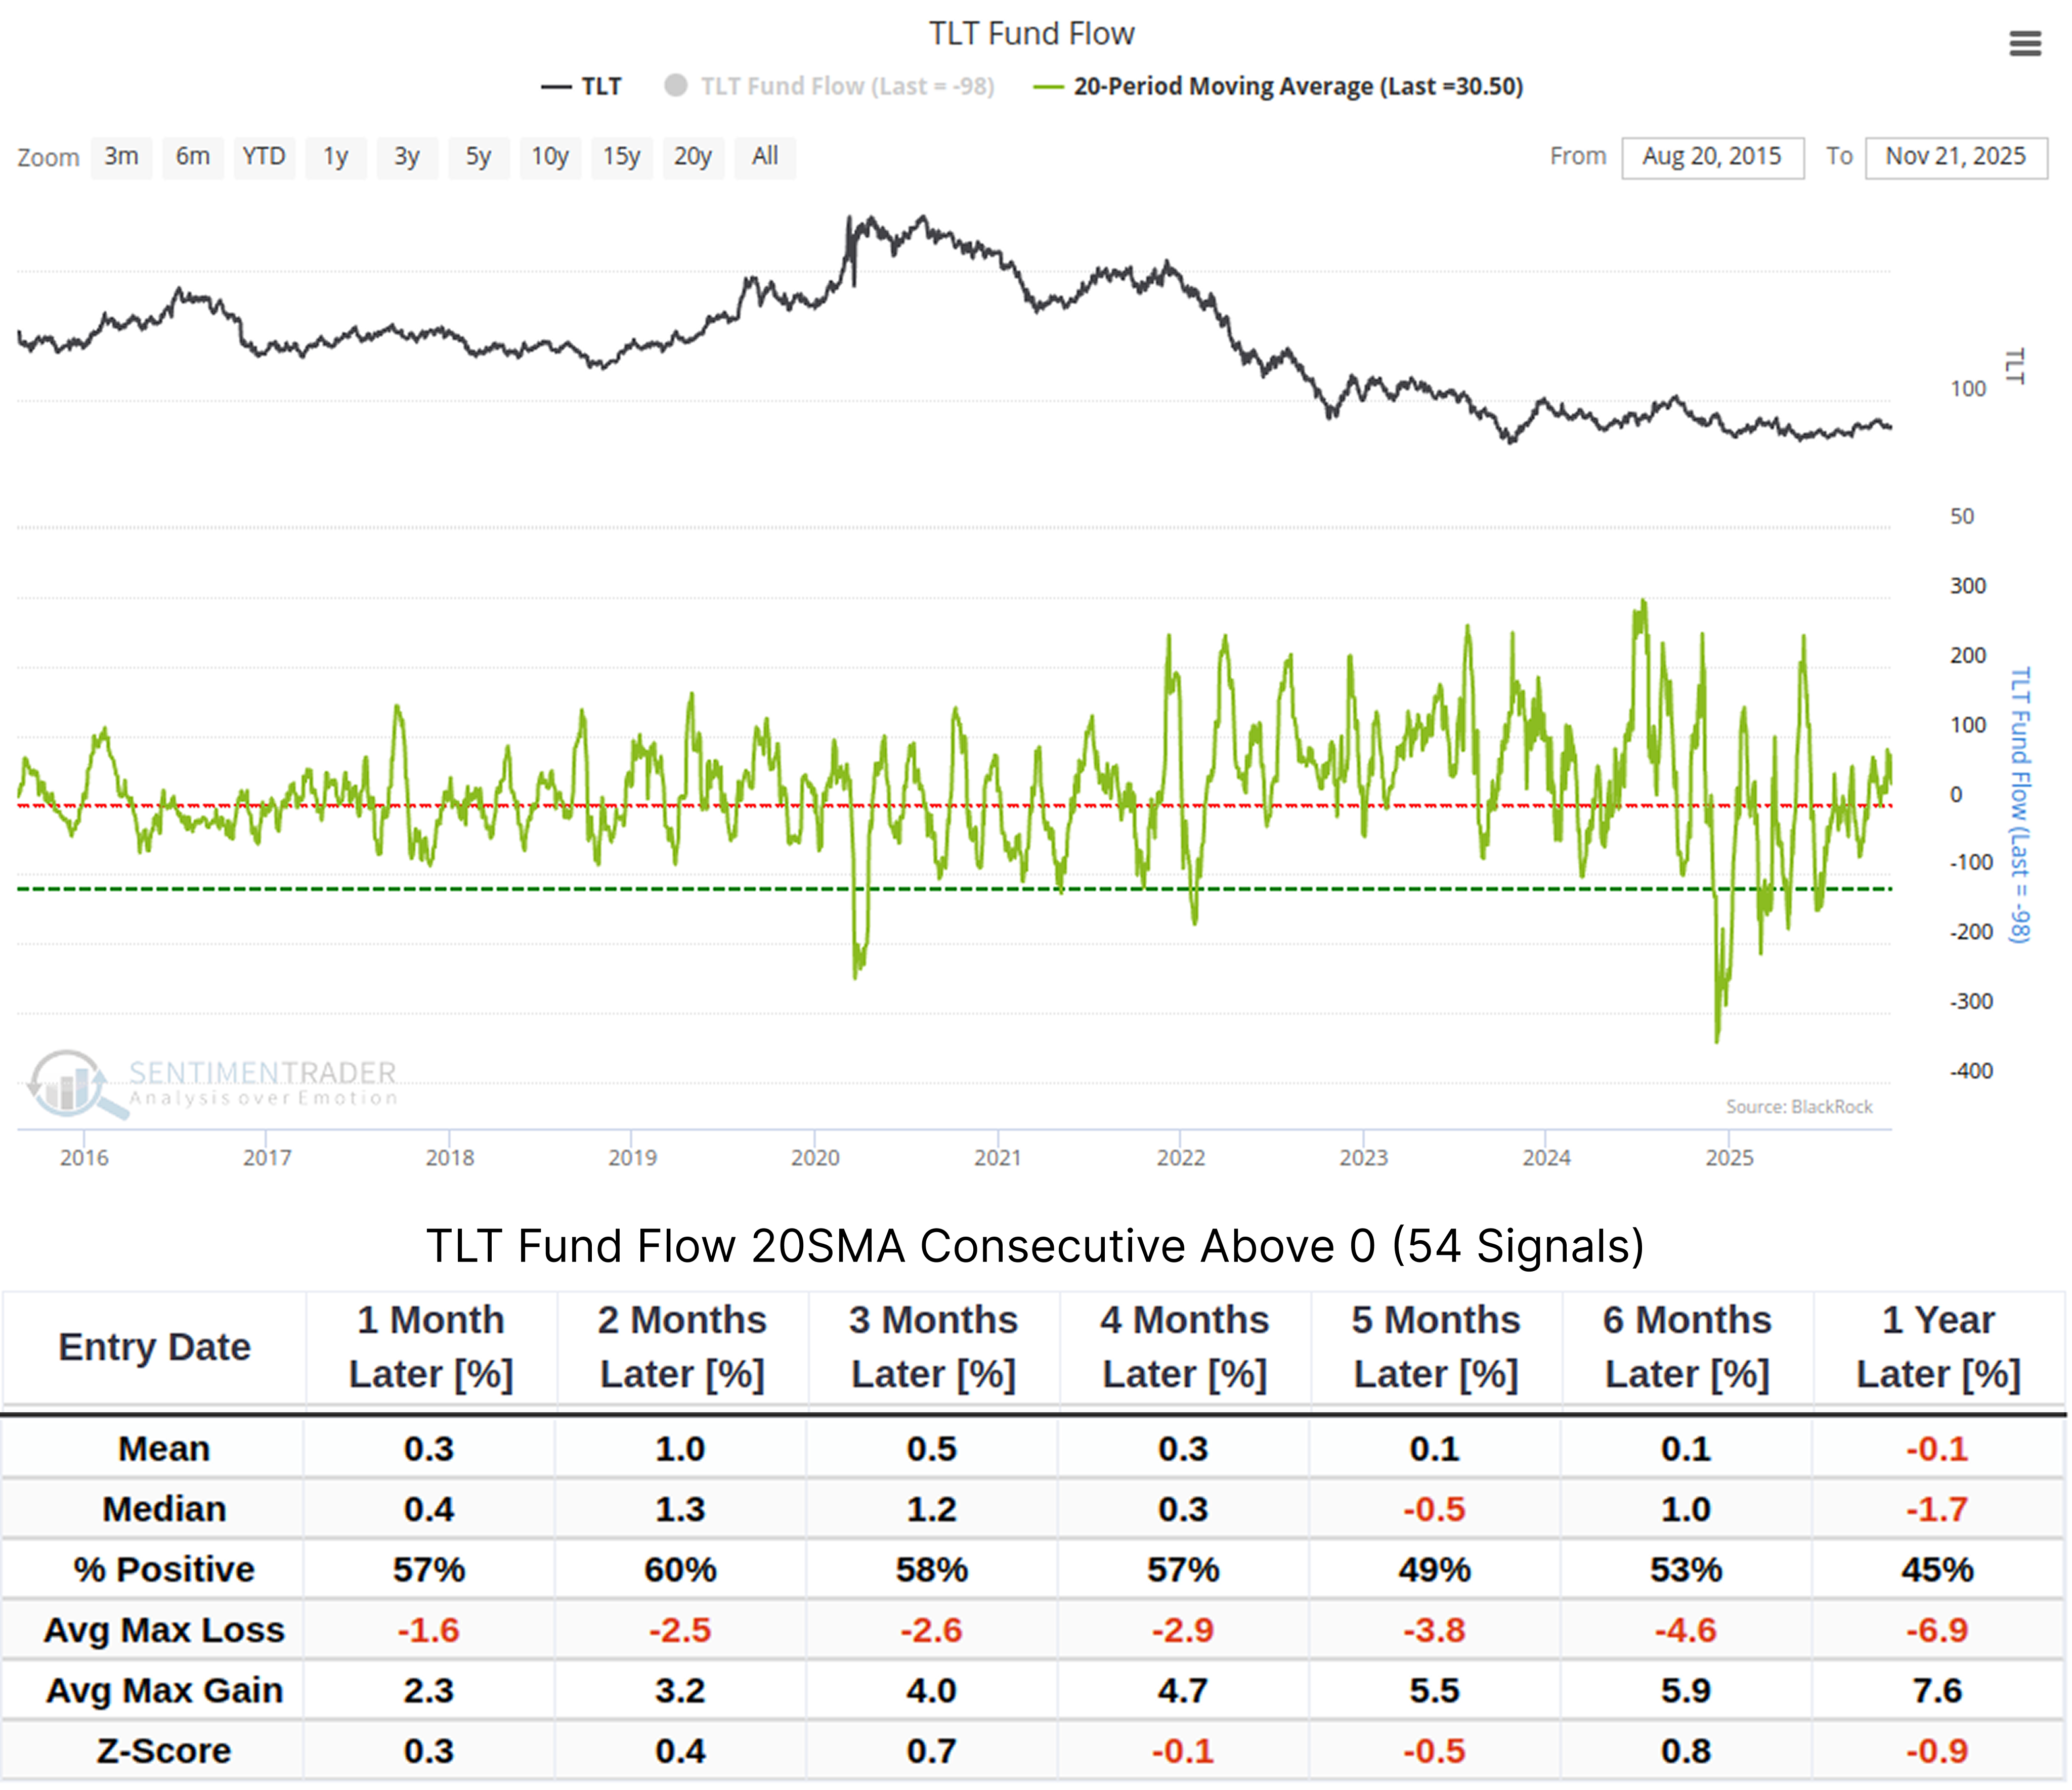
Backtesting shows that the average return one year after the signal is triggered is only -0.1%, with a win rate of less than 50%. This further confirms that the current rally is mainly driven by sentiment rather than a fundamental reversal.
As for the stock/bond ratio, while a drop below 0.92 is usually seen as a sign of rising safe-haven sentiment (beneficial for bonds), the current data is not prominent.Related Backtest Click Here.
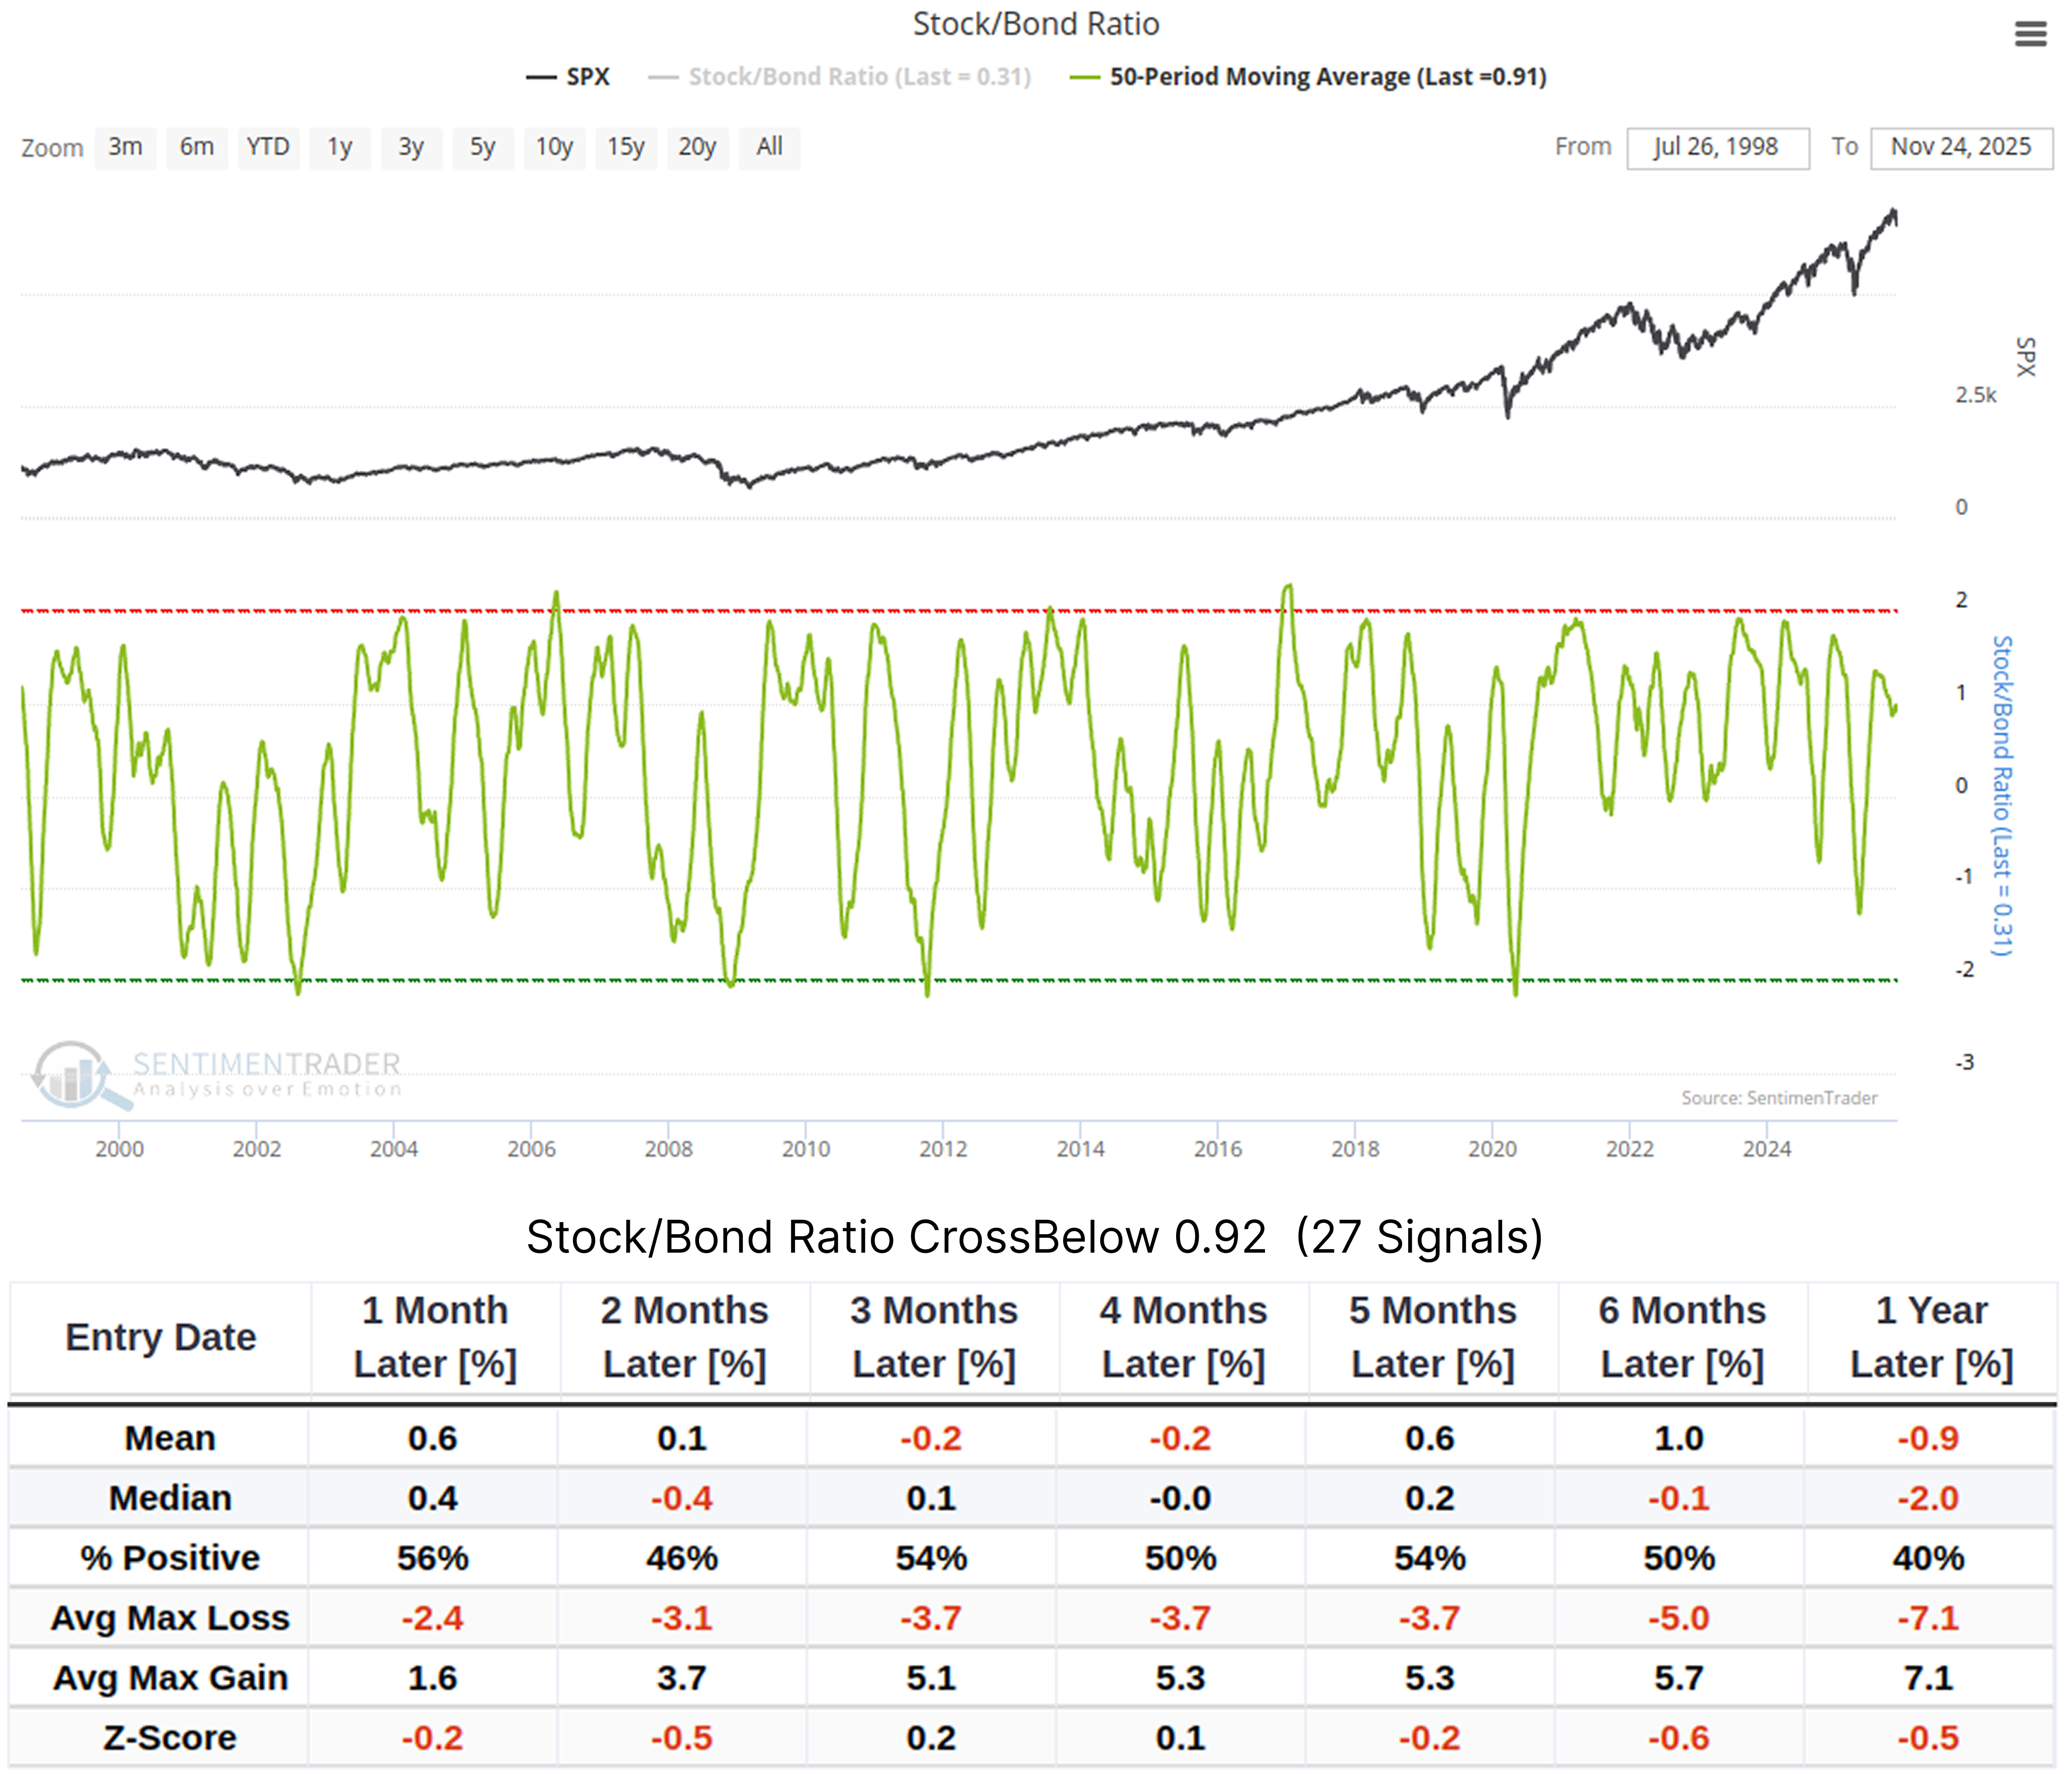
Subsequent returns fluctuate between positive and negative, failing to provide clear directional guidance.
Seasonal factors are also a consideration at present.
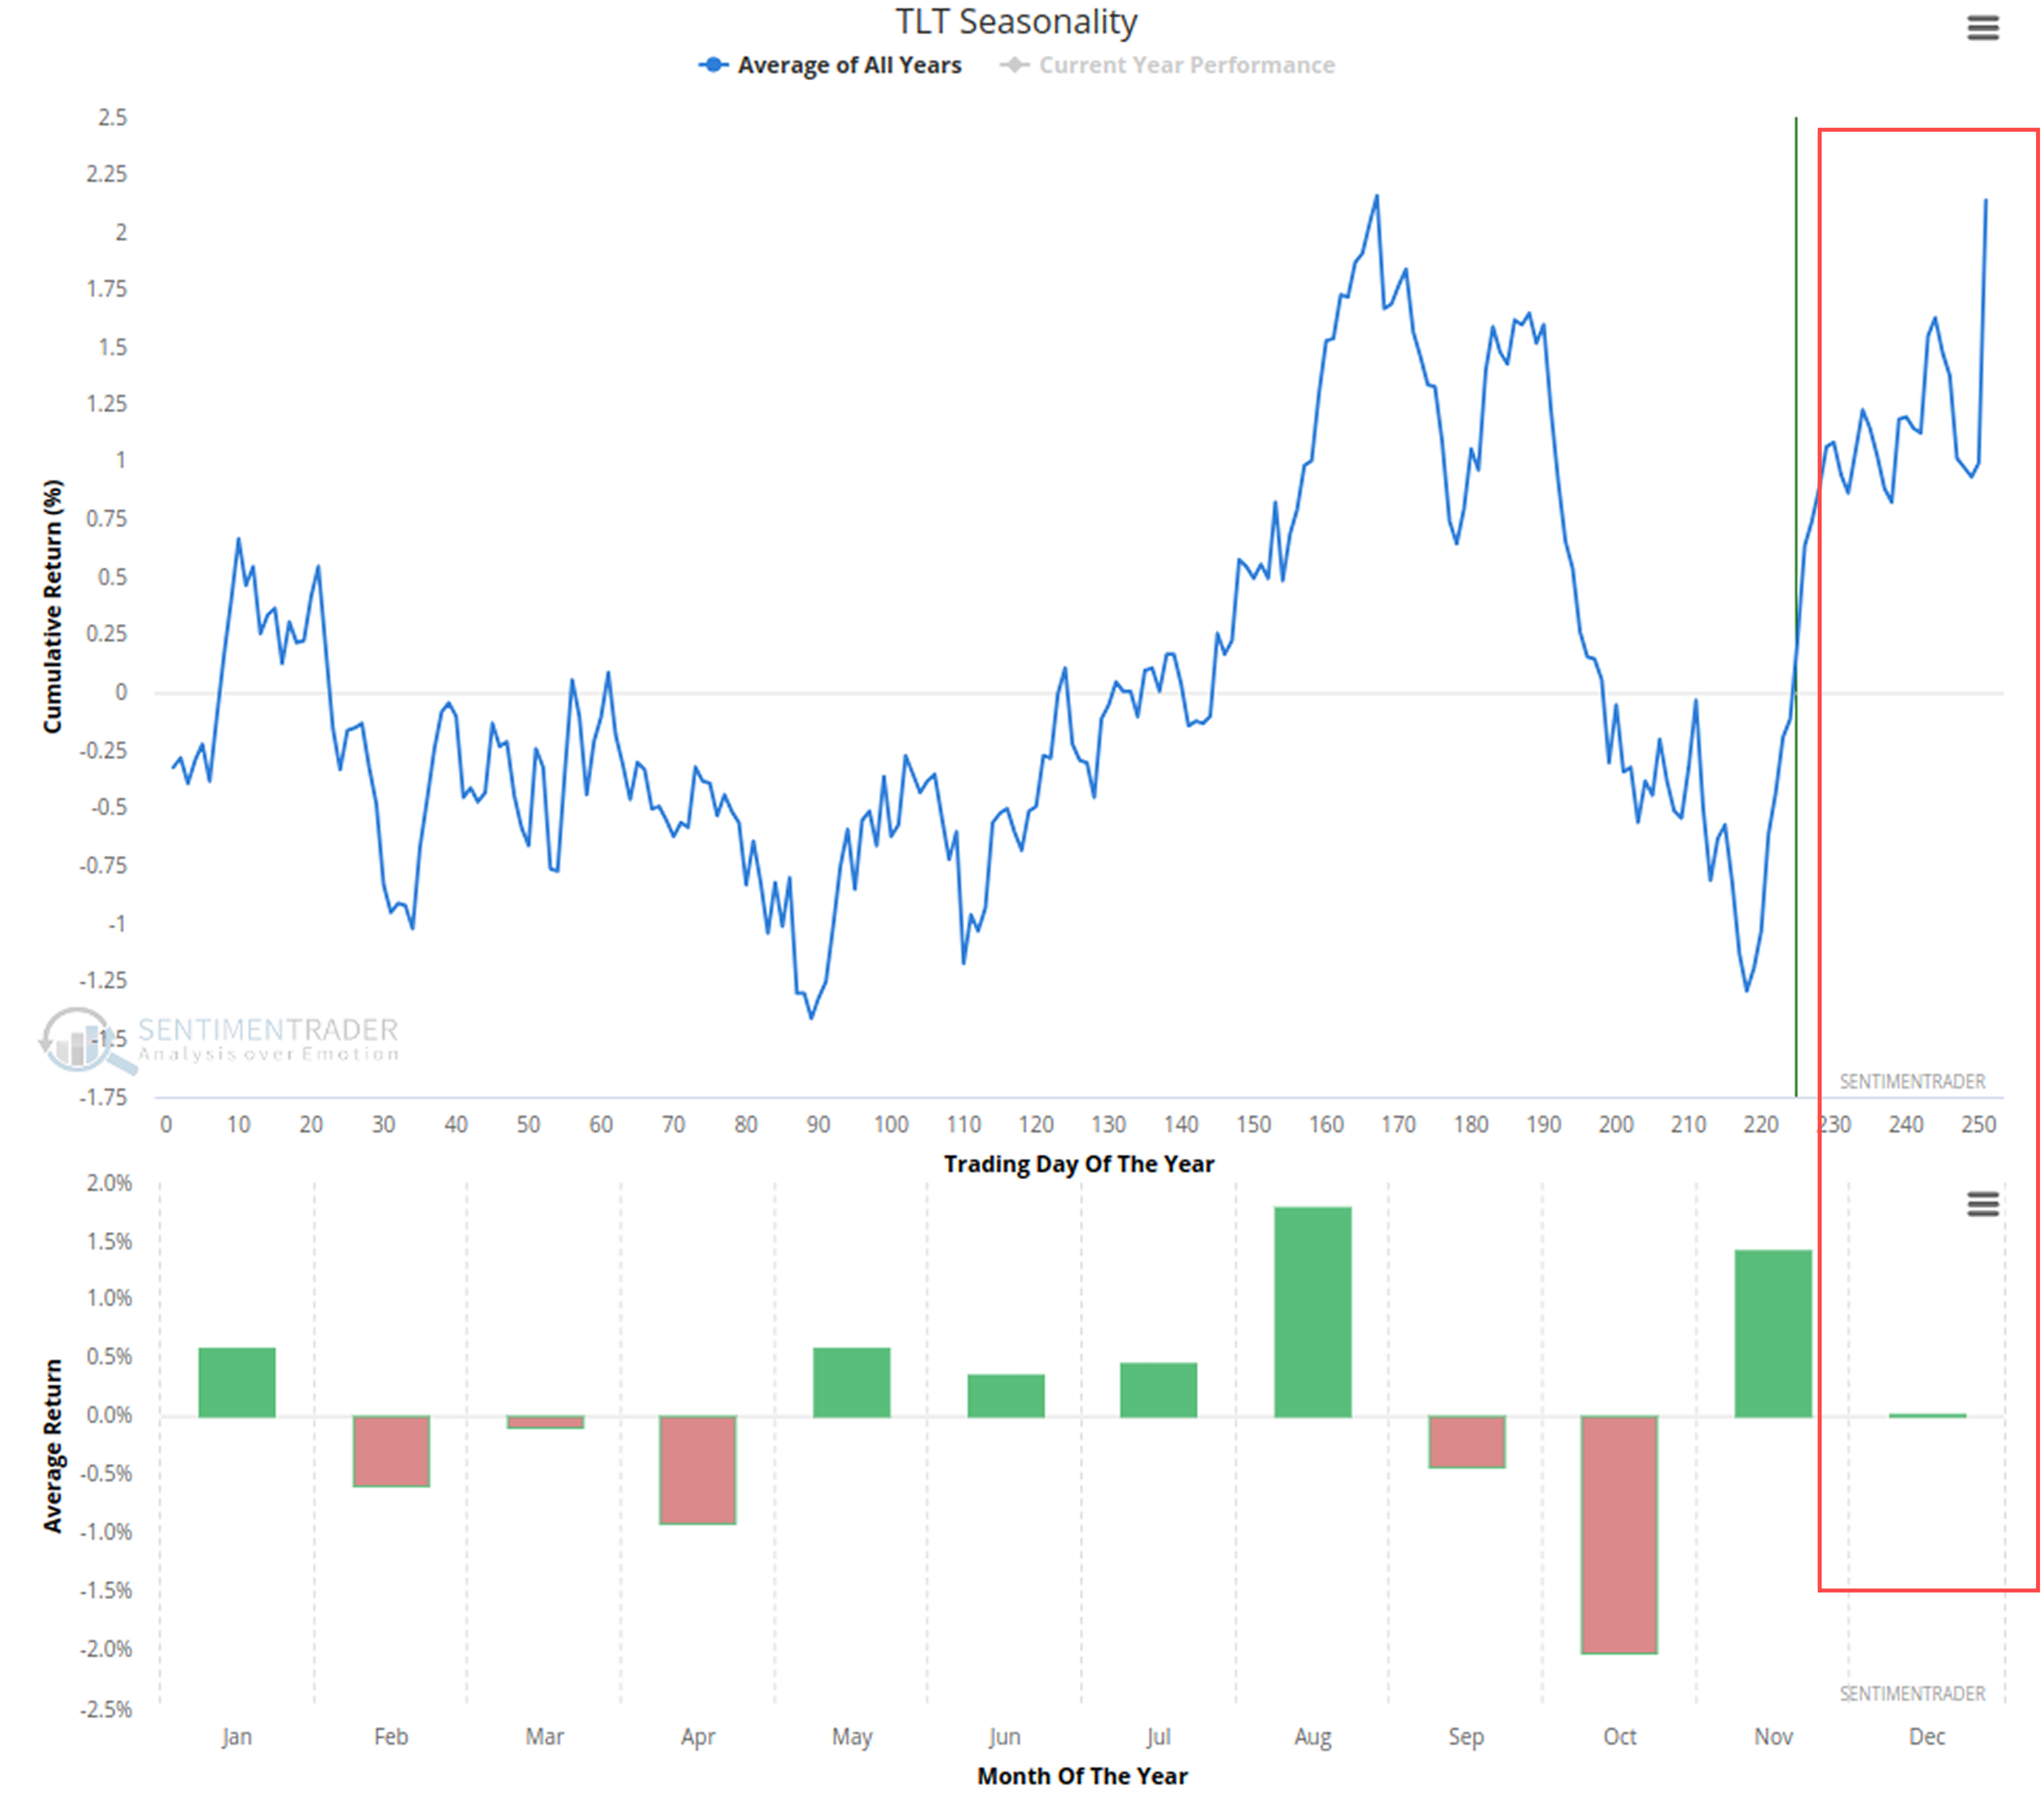
November's average monthly return is one of the best-performing months of the year. However, when seasonal support fades in a few weeks, the market will face the realistic pressures of overcrowded option positions and institutional capital outflows.
What the Research Tells Us...
The historical low of the 10-year Treasury Put Call Ratio 50-day moving average reminds us that long positions may have become overly crowded in the short term. Data objectively demonstrates the potential cost of this crowding: within the next 1 to 6 months, the market may need to digest excessive optimism through consolidation or pullbacks.
Although the long-term allocation value of bonds remains, blindly chasing gains in the short term may not be the optimal strategy. For prudent investors, waiting for the frenzy in the option market to cool (PCR rebound) and for institutional capital to flow back before deploying positions may be a more risk-reward favorable choice. The current rally is more of a sentiment release during a long-term bottoming process rather than the start of a one-sided trend.
Based on historical backtests. While history often rhymes, past performance is no guarantee of future results. Historical correlations may temporarily break down during rare macro paradigm shifts (e.g., global deflation or geopolitical shocks).