
Bond Market Observation

Key Points:
- Hedge funds' long bond exposure has reached a one-year high, which historically has corresponded to low medium-term win rates.
- ETF capital outflows have hit a seven-month low.
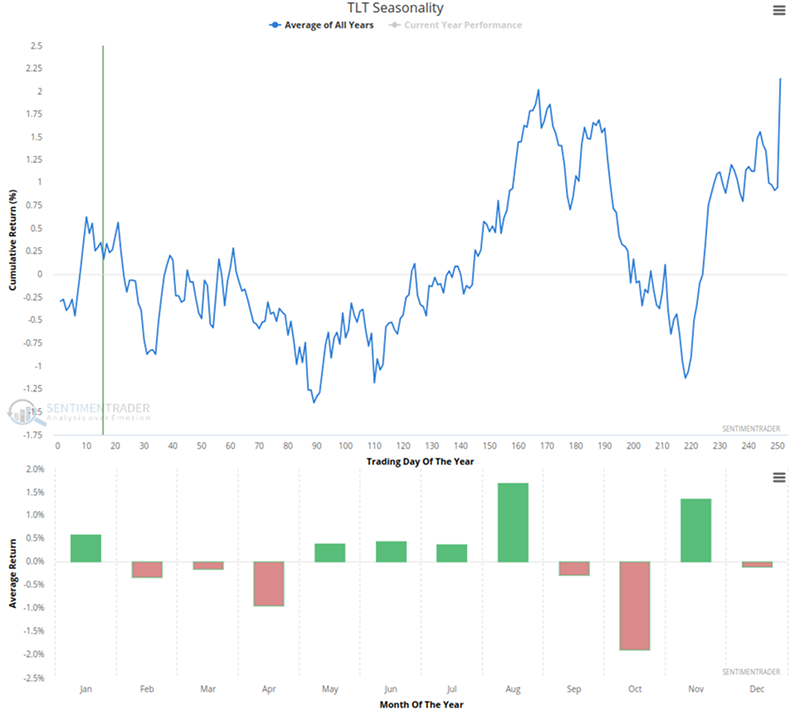
- Seasonal factors show that the market is entering a traditionally weak window period of the year.
Bond Market Sentiment
Unlike a typical market bottom, the sentiment in the current bond market is not pure panic, but more like a "resignation" to the high interest rate environment. Mainstream financial media are no longer keen on predicting when the Federal Reserve will "rescue the market", and instead have begun to publish numerous analyses on why inflation is difficult to return to 2%. The forecast data from the Cleveland Fed's Nowcasting model (January core PCE at 2.76%) is frequently cited by major terminals, becoming the last straw that dashed the bullish hopes. More crucially, despite sticky inflation expectations, credit spreads remain at extremely low levels, which confirms that the market is not pricing in recession risks in a panic, but is merely being forced to reprice the interest rate pivot.
Extreme Crowding of Institutional Chips
A noteworthy structural change comes from the position status of the "smart money". According to the latest survey data, hedge funds' exposure in the bond market has climbed to the highest level in a year, with its ranking score hitting an extreme value. Under normal circumstances, we would look to institutional trends as a guide, but at extreme levels, this indicator often has a contrarian warning significance.
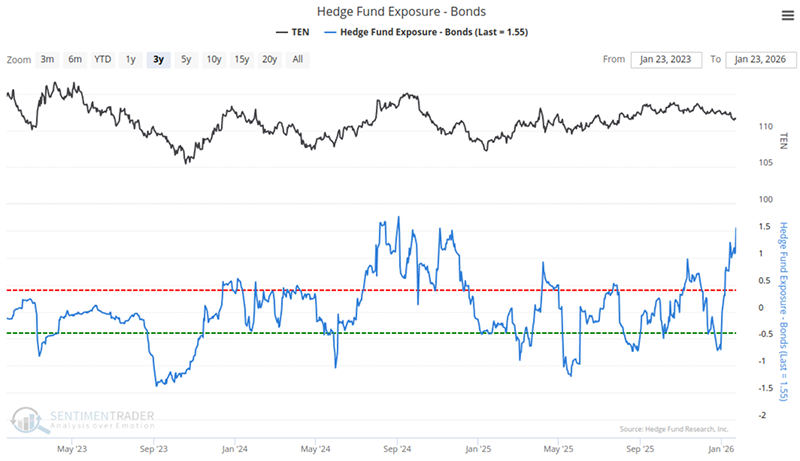
Historically, the chart below shows the performance of the 10-year Treasury note in various periods after hedge fund exposure reached similar high extreme values.Related Backtest Click Here.
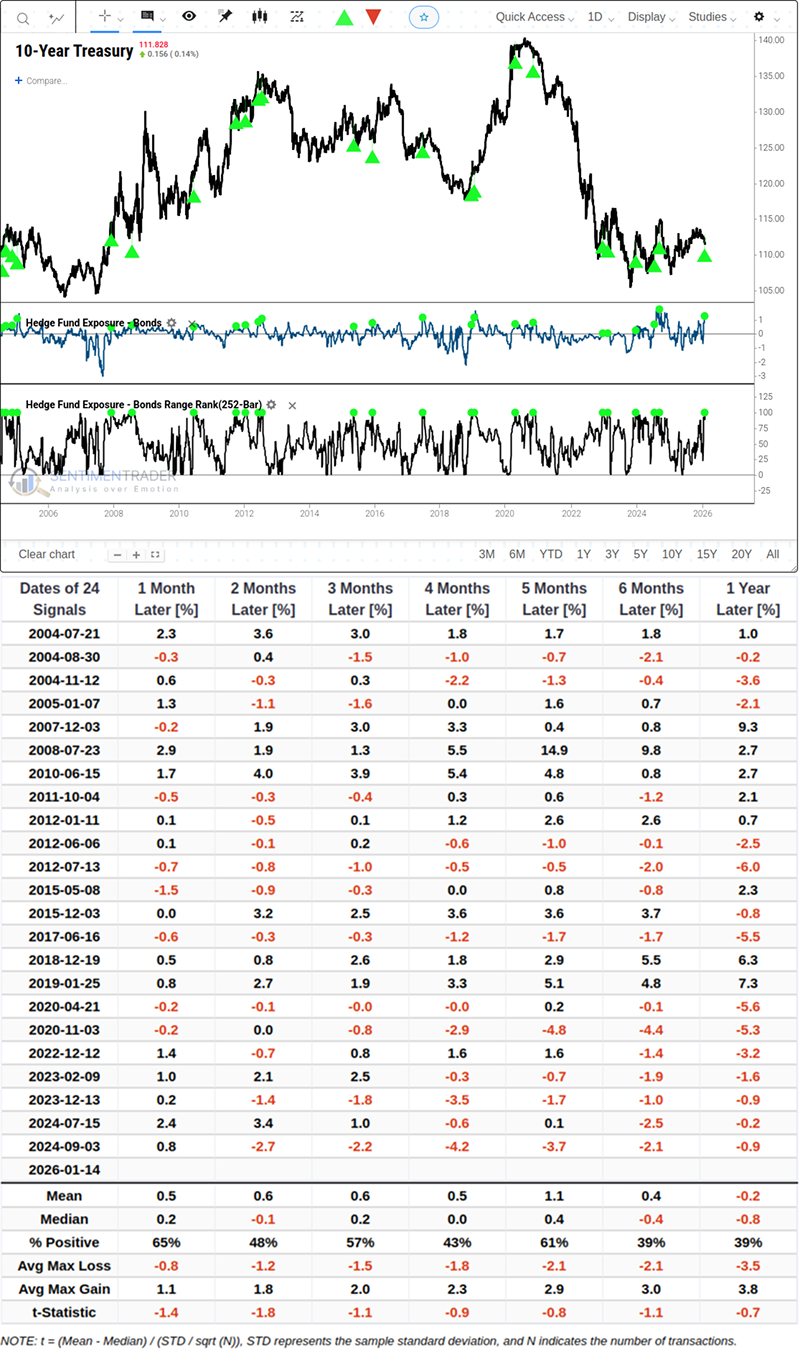
Looking at the performance 6 months and 1 year after the signal, the median return was negative in both periods, and the win rate of positive returns only remained at around 39%.
Inertial Risk After Capital Outflows
In stark contrast to institutional enthusiasm, the capital flow of TLT (iShares 20+ Year Treasury Bond ETF) shows obvious weakness. The 20-day average capital flow indicator has dropped to a seven-month low.
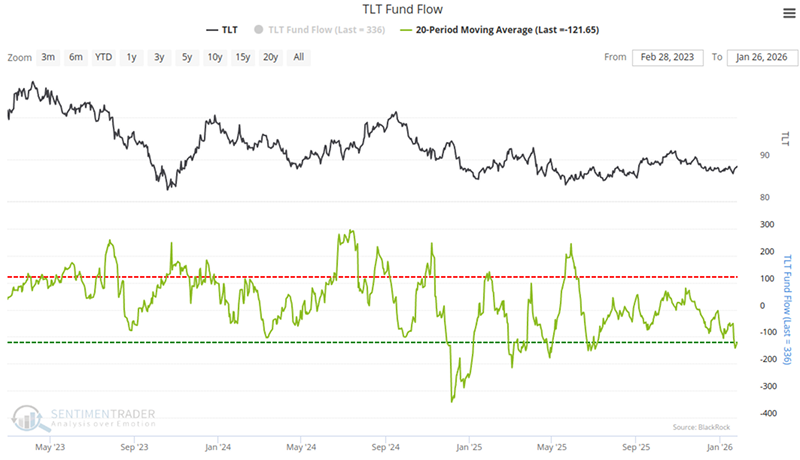
Although contrarian investors tend to look for opportunities when capital flees in panic, the data tells us that we need to be more patient.Related Backtest Click Here.
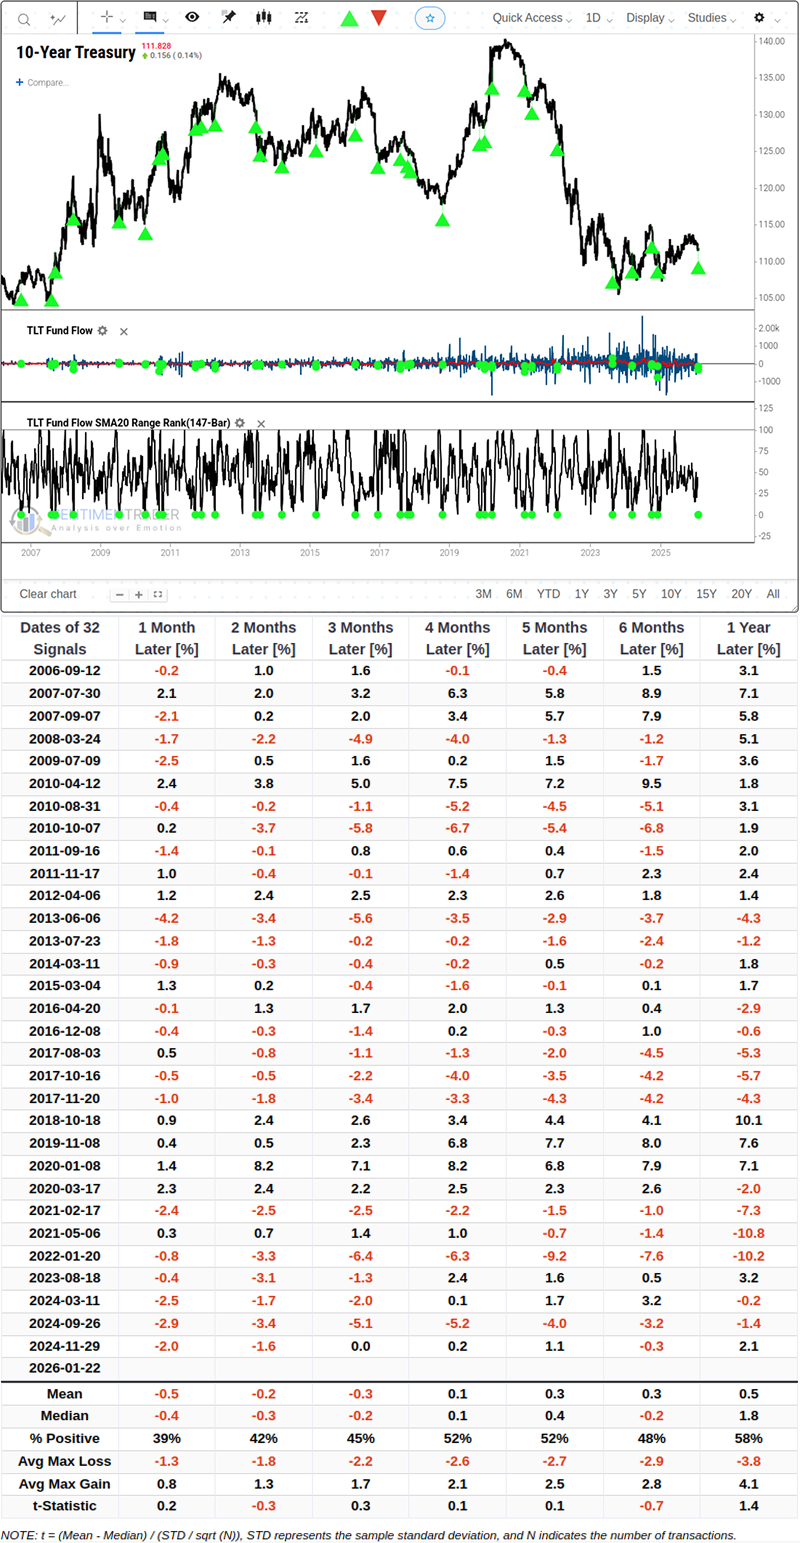
Historical data shows that within 1 to 3 months after capital outflows hit similar extreme values, the average return of the 10-year Treasury note benchmark was still negative, and the win rate failed to exceed 50%. This means that even for the less volatile Treasury benchmark, retail capitulation is often accompanied by inertial price declines, and for the high-duration TLT, the pullback amplitude brought by this inertia will be more severe.
TLT's Open Interest Ratio
TLT's Open Interest Ratio directly reflects the degree of chip crowding within the ETF. As can be seen from the chart, this indicator has reached the maximum value in a year, which means an abnormally large number of open contracts have accumulated in the current market.
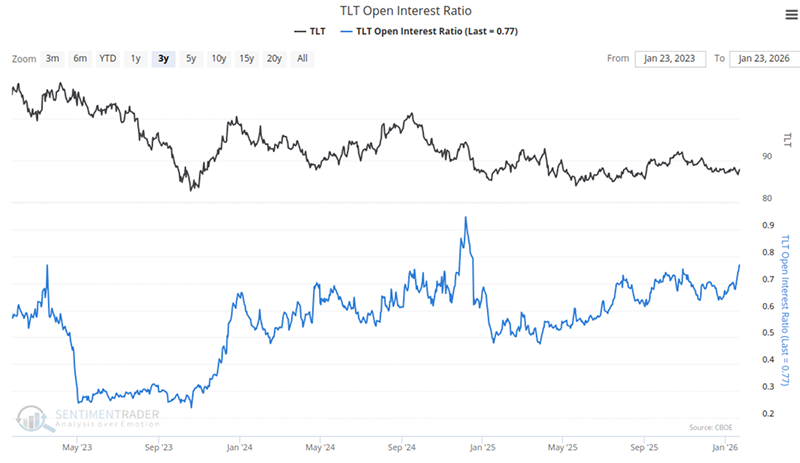
Historical data shows TLT's performance in such situations in the past.Related Backtest Click Here.
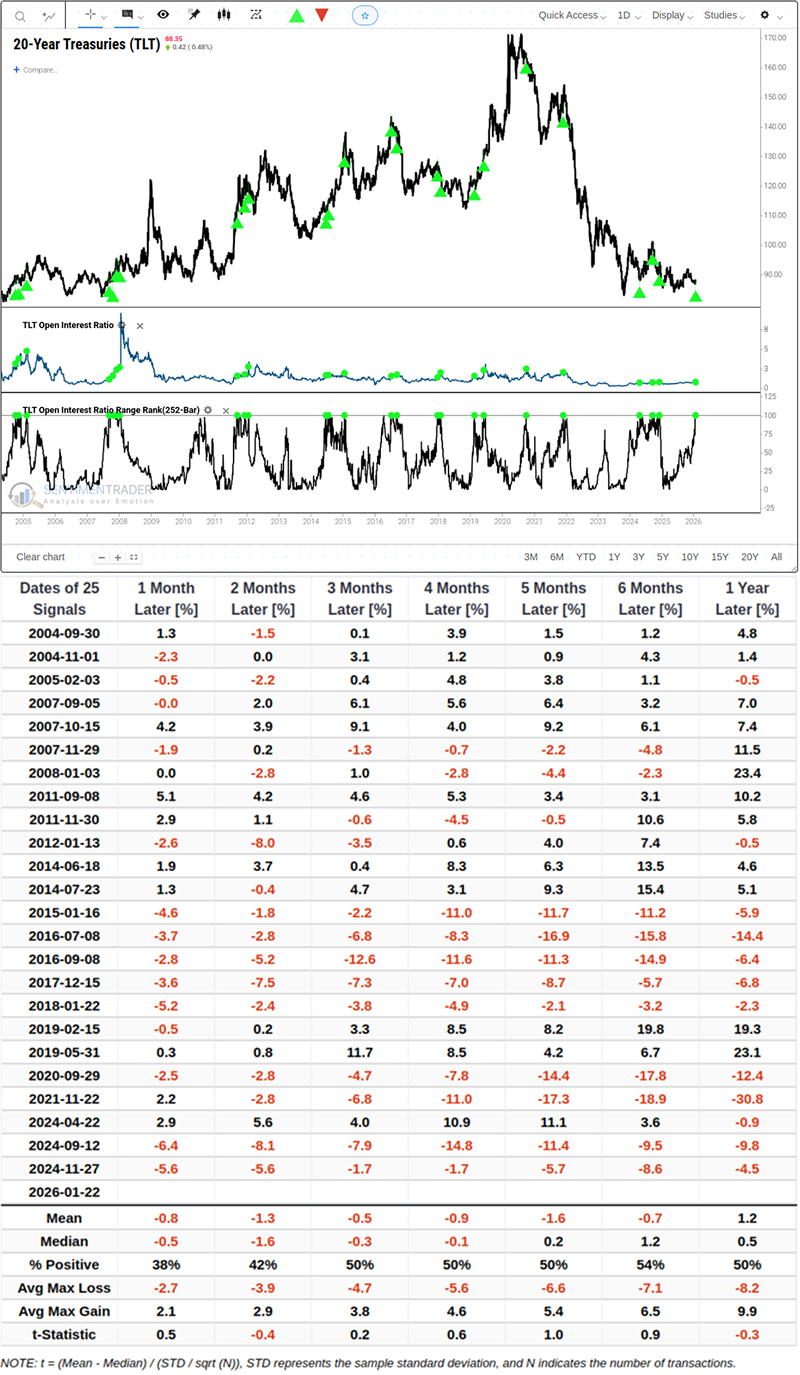
Based on the backtest of the past 25 similar extreme signals, it is worth noting that 1 month after the signal, TLT fell by an average of -0.8%, with a win rate of only 38%.
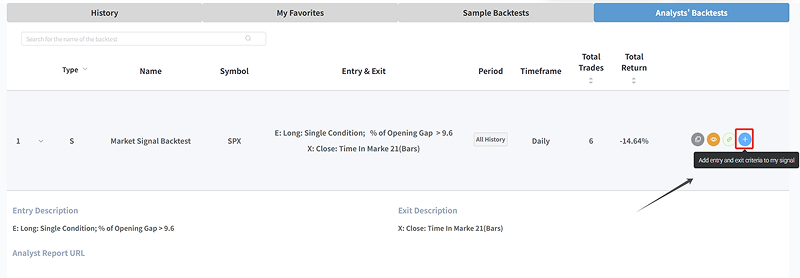
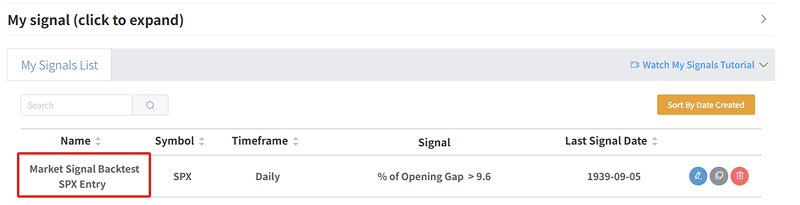
Never miss a crucial signal again. The Analysts' Backtests interface now features a "+ Add to My Signals" button that lets you instantly import entry and exit criteria from any analyst's backtest (e.g., a Trend Tracking Backtest, Market Signal Backtest, or other strategy) into your personal My Signals List.
Seasonal Factors and the Silence of Asset Allocation
Seasonal factors are another worrying issue, and for TLT, this impact is about to become very unfavorable, especially as the market enters the traditionally worst-performing February-April window period of the year. Such seasonal headwinds, in the absence of major positive catalysts, may amplify the downward pressure on the market.
What the Research Tells Us...
Overall, the current data does not support an aggressive long strategy. What we are facing is a combination of "extreme crowding of institutional long positions" and "seasonal weakness". Although capital outflows may be one of the characteristics of the bottom in the long run, the probability of inertial price declines in the short term is still statistically high. The market seems to be punishing funds that enter the market too early, while also providing patient investors with a better observation window in the next few months.
Based on the observation of various recent indicators, short-term risks in the bond market seem to be accumulating. The high crowding of institutional positions limits the upside space, while seasonal factors and the inertia of capital outflows may drag prices further down. For traders, this may be a period that requires a defensive mindset. A more attractive entry opportunity may need to wait for the unwinding of hedge funds' extreme exposure and the arrival of the seasonal low (usually after April), when multiple indicators can form a resonance, and the win rate may be significantly improved.