Products
SentimenTrader Trading Tools
‍
Backtest Engine
My Trading Toolkit
Correlation Analysis
Seasonality
Market Prediction
Indicators & Data API
‍
Proprietary Indicators & Charts
Market Data API
Strategies & Scanner
‍
50+ Trading Strategies
Smart Stock Scanner
Smart Option Scanner
Research Reports
‍
Research Solutions
Reports Library
Free Resources
Simple Backtest Calculator
Simple Seasonality Calculator
The Kelly Criterion Calculator
Sentiment Geo Map
Public Research Reports
Education
Sentiment Indicators
Technical Indicators
Pricing
Company
About
In the News
Testimonials
Client Success Stories
Contact
Log inLoginSign up
< BACK TO ALL REPORTS

Bond Market Moves

Jason Goepfert
2018-09-19
null

Bonds are getting hit again today, after already suffering a few weeks of declines. The move has been enough to push the Optimism Index for bonds down to one of its lowest levels in 15 years.

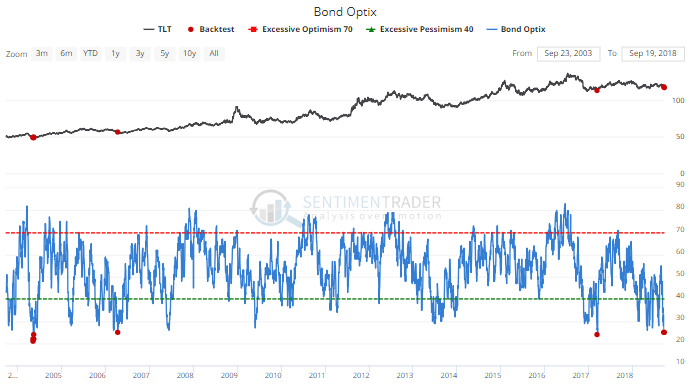
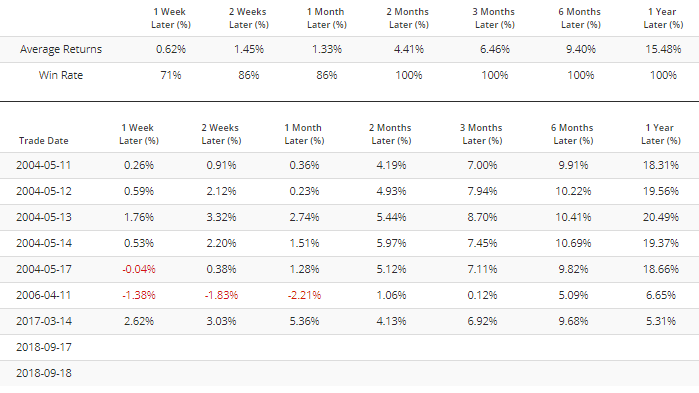
Forward returns in the TLT exchange-traded fund have been excellent the few other times sentiment got this stretched to the downside.

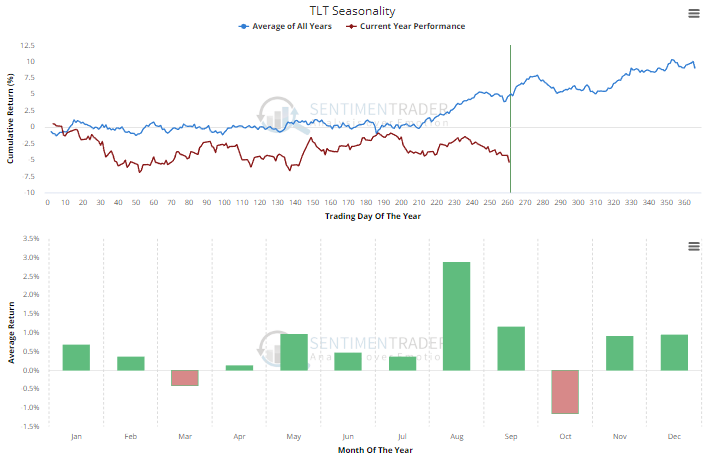
It's occurring at an interesting point in the year. TLT has followed it seasonal tendencies pretty closely this year, and it has tended to rally into early October before a rough stretch in the latter part of October-November.

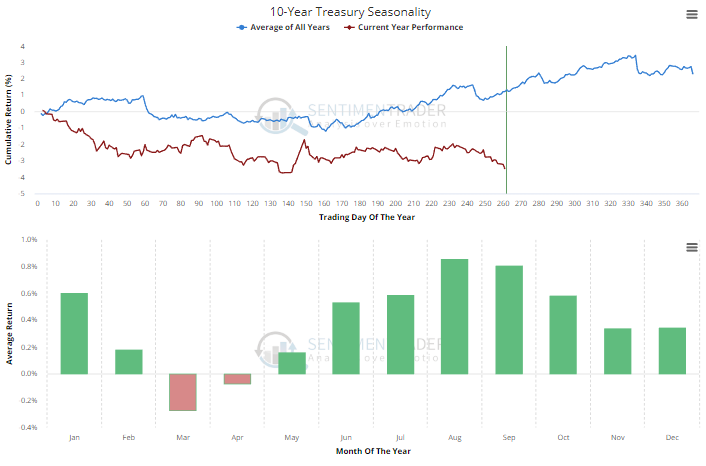
The 10-year Treasury doesn't show quite as pronounced a pattern, though.

What's also notable is the sudden jump in assets in TLT. Over the past few weeks, assets in the fund have jumped nearly 30%.

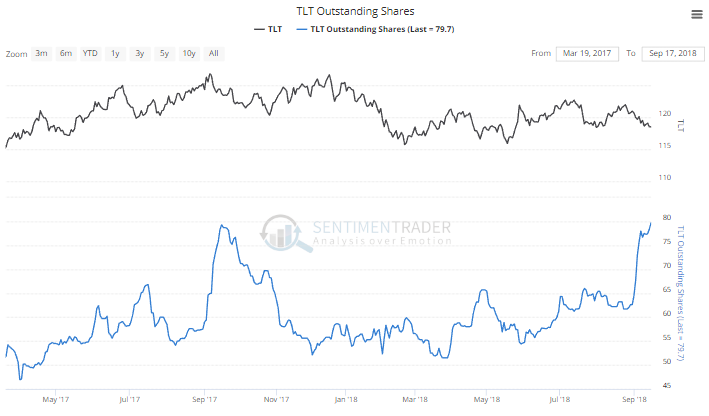
The automatic assumption is that this is bottom-fishers trying to time a rebound. But it could just as easily be short-sellers, with the fund company creating new shares to meet the demand of those selling the fund hoping to buy it back later at a lower price. Usually with TLT, rising fund assets correlate with rising price, so there's a good chance this is short-sale behavior. The only other time in the past 5 years that TLT lost more than 2% over a 3-week period while assets rose more than 25% was in late June 2013. TLT sold off a bit more, then rebounded strongly.

The setup isn't quite perfect, though. There is still no evidence of options traders betting heavily on a decline.

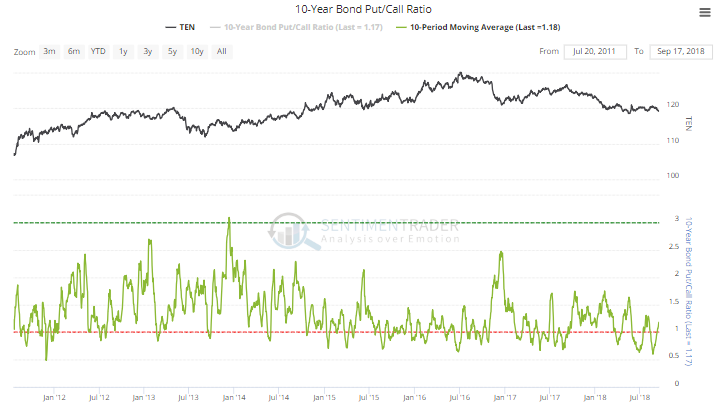
Options indicators on bonds aren't as consistently useful at extremes as they are in stocks, but it's still a worthy indicator. Past bottoms in bonds have usually coincided with a pickup in put option activity, which we're not seeing yet. In fact, the 10-day average of the 10-Year Treasury Put/Call Ratio is only now coming out of overbought territory.

That's also in line with extremely low implied volatility in bonds.

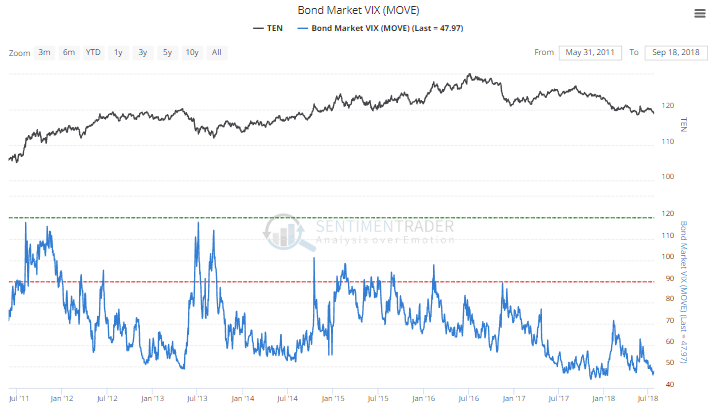
The "VIX" for the bond market is ticking along near all-time lows. This doesn't behave like the VIX for stocks, though. Volatility in bonds is just as likely to rise when bonds rally hard as when they fall, unlike stocks where stocks and volatility move almost exactly in opposite lockstep. There seems to be a slight bias toward lower prices in bonds when the MOVE index is low, but I'm not reading too much into it.

Most compelling is the Optimism Index, which takes into account a number of factors noted above. The fact that it's near the lowest level in 15 years is notable. There have been bold predictions that the decades-long bull market in bonds is over. If bonds (and TLT) continue to decline in the weeks ahead despite this negative sentiment, then those arguments will have some good support.

PRODUCTS
SentimenTrader
Trading Tools
Indicators & Data API
‍
Strategies & Scanner
‍
Research Reports
FREE
RESOUrCES
Simple Backtest
Calculator
Simple Seasonality
Calculator
The Kelly Criterion
Calculator
Sentiment Geo Map
‍
Public Research Reports
‍
Education
Sentiment Indicators
‍
Technical Indicators
‍
Pricing
Bundle pricing
‍
FAQ
‍
Announcements
‍
COMPANY
‍
About
‍
In the News
‍
Testimonials
‍
Client Success Stories
CONTACT
‍
General Inquiries
‍
Media Inquiries
‍
Financial Professionals Inquiries
‍
© 2026 Sundial Capital Research Inc. All rights reserved.
Setsail Marketing
TermsPrivacyAffiliate Program
Risk Disclosure: The information and tools provided are for research and analytical purposes only and are not intended as investment advice. Market analysis involves uncertainty, and outcomes may differ from expectations. Users should conduct their own due diligence and consider their individual circumstances before making any financial decisions. Past performance is not necessarily indicative of future results.

Hypothetical Performance Disclosure: Hypothetical performance results have many inherent limitations, some of which are described below. No representation is being made that any account will or is likely to achieve profits or losses similar to those shown; in fact, there are frequently sharp differences between hypothetical performance results and the actual results subsequently achieved by any particular trading program. One of the limitations of hypothetical performance results is that they are generally prepared with the benefit of hindsight. In addition, hypothetical trading does not involve financial risk, and no hypothetical trading record can completely account for the impact of financial risk of actual trading. for example, the ability to withstand losses or to adhere to a particular trading program in spite of trading losses are material points which can also adversely affect actual trading results. There are numerous other factors related to the markets in general or to the implementation of any specific trading program which cannot be fully accounted for in the preparation of hypothetical performance results and all which can adversely affect trading results.

Testimonial Disclosure: Testimonials appearing on this website may not be representative of other clients or customers and is not a guarantee of future performance or success.