
Bond market calm supports equities

Key points
- Credit default swaps show that bond traders are not anxious about widespread defaults
- Historically, when the CDX is in a downtrend (below its average), the S&P 500 generates significantly higher risk-adjusted returns compared to when credit stress is rising.
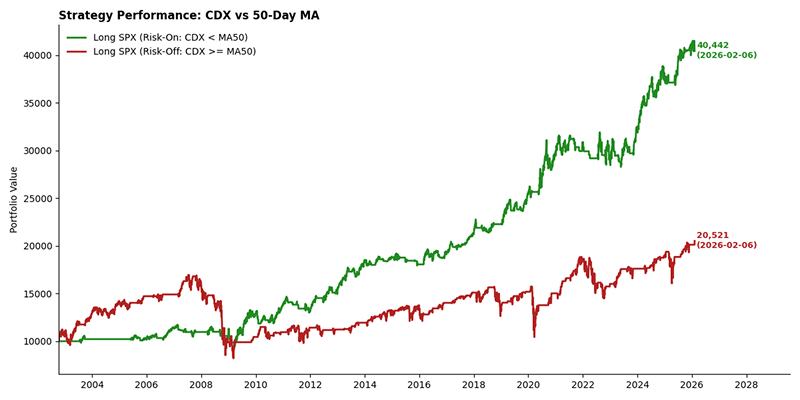
- A regime-switching strategy based on this trend has historically turned a $10,000 investment into nearly $40,000 with low drawdowns, versus only $20,000 with massive drawdowns when ignored.
Credit spreads remain well-behaved
One of the cornerstones of a healthy stock market environment is a lack of bond market anxiety. Whether the bond market is "smarter" is up for debate; it's not something we've ever been able to prove with consistency. However, it is undeniably a vital signal for risk assets.
A good proxy for bond market anxiety is bond traders' pricing of credit default swaps (CDX). As long as traders are not paying up for protection against bond defaults, especially if they're not rapidly re-pricing that risk, things are usually okay in the stock market.
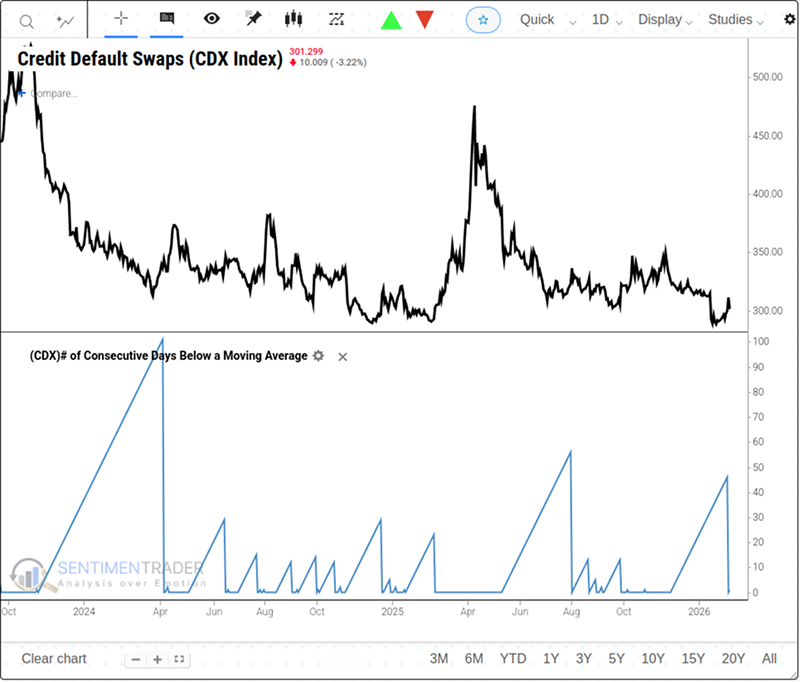
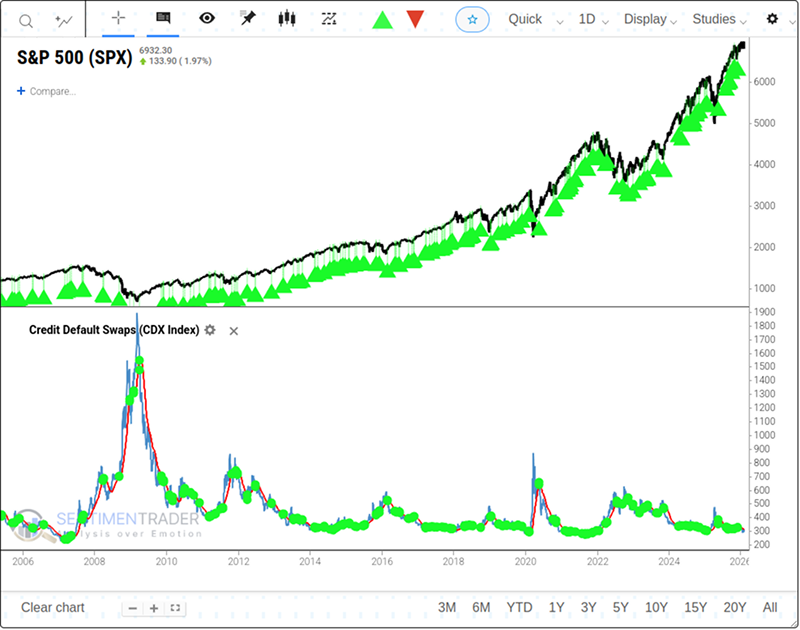
By this measure, bond traders haven't been concerned. A primary indicator showing the prices traders pay for default protection has been holding below its 50-day moving average for nearly 46 sessions. The index acts like the VIX for bonds: if traders are concerned, the CDX Index will rise.
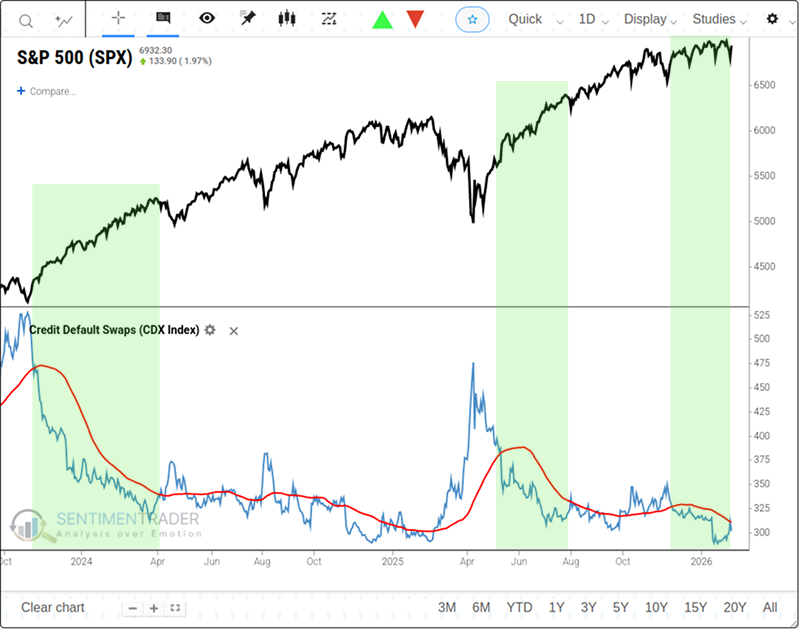
If we overlay the S&P 500 against the CDX Index, it's apparent that long streaks of calm in the bond market have coincided with favorable periods for stock market investors.
The impact of credit trends on returns
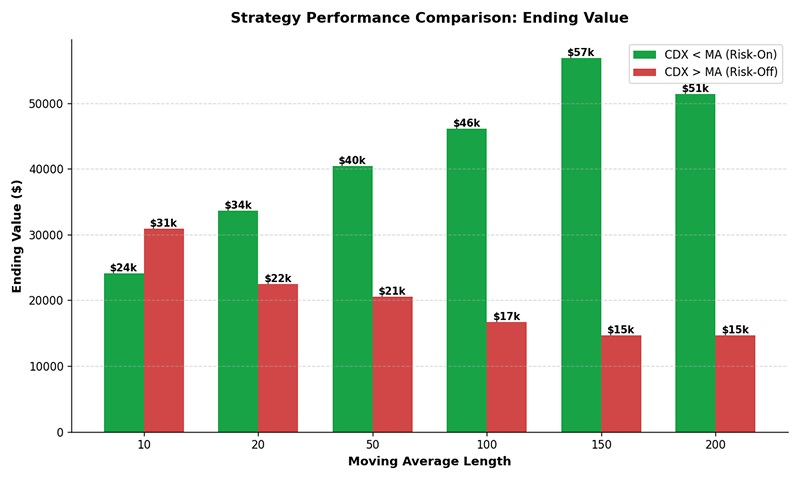
Over the past 20 years, trends in credit default pricing have had a massive impact on equity returns. Calculated on a next-day basis, when the CDX Index was below its 50-day moving average, a hypothetical $10,000 investment in the S&P 500 grew to nearly $40,000, with a maximum drawdown of just 19%. Conversely, if invested only when the CDX was above its average (indicating rising stress), that same $10,000 would have grown to only about $20,000, while suffering a drawdown exceeding 50%.
The 50-day moving average strikes a good balance between a system that responds quickly and one that is over-optimized. However, strictly for optimization purposes, the 50-day isn't necessarily the "perfect" choice.
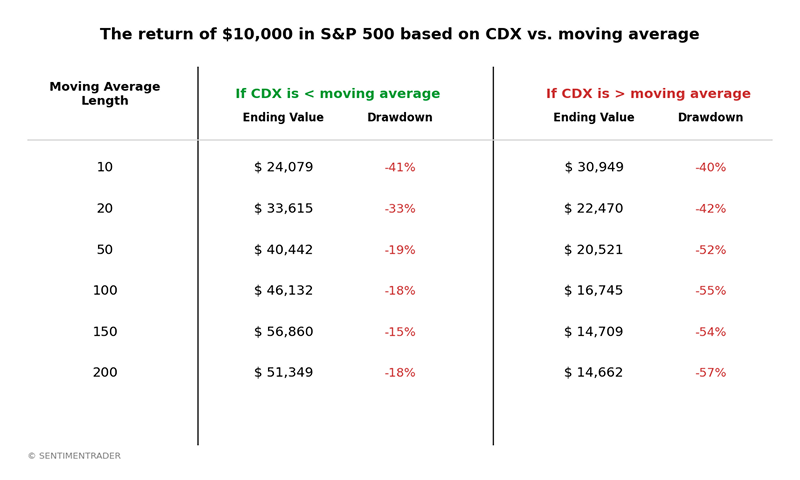
If an investor focused on the 150-day moving average of the CDX rather than the 50-day, returns for the S&P 500 would have been slightly higher with slightly smaller drawdowns. The key, however, lies in balancing historical optimization with providing investors sufficiently timely warning signals regarding changing market conditions.
Current signals and the "3-Day Rule"
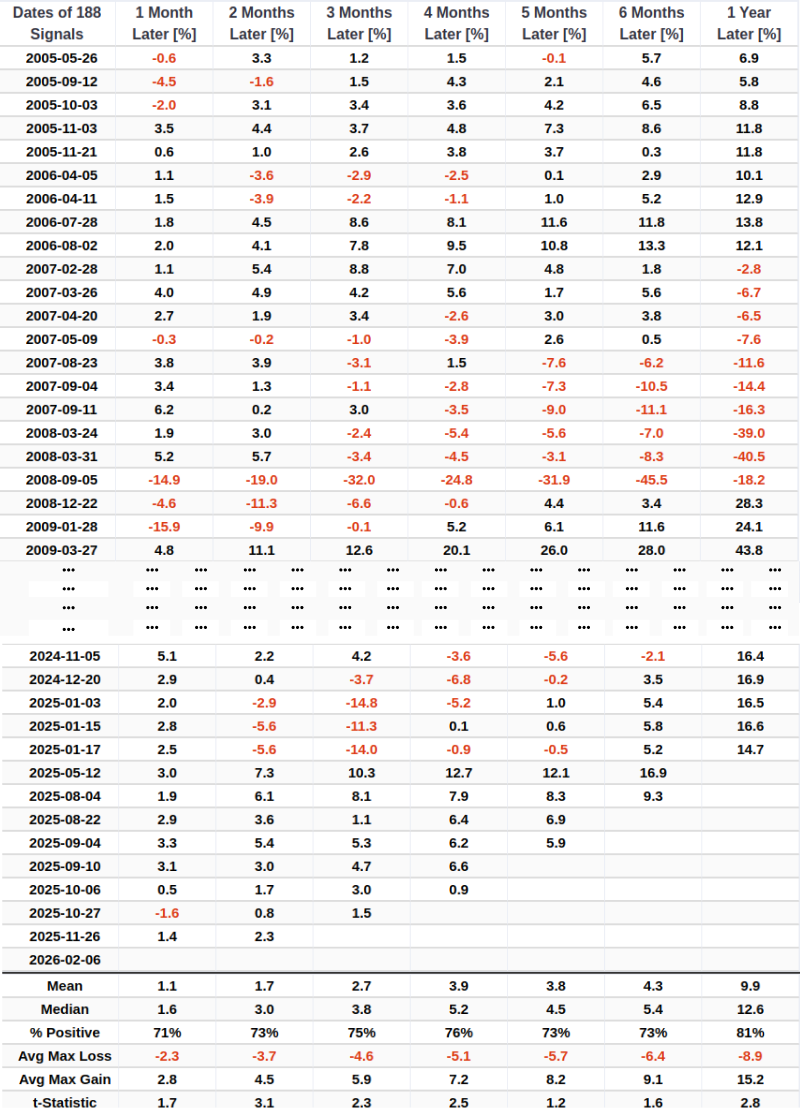
When the CDX Index is below its 50-day moving average, it is generally a positive sign for the stock market. Therefore, a strategy can be employed to establish long positions when the CDX crosses below its 50-day moving average (Death Cross) and sell when it crosses above (Golden Cross). A signal based on this logic appeared on February 6th.
The chart below summarizes the subsequent performance of the S&P 500 following these signals. As the world's most representative index, the S&P 500 has historically shown positive win rates and returns following these signals, with benefits becoming more pronounced over longer timeframes.
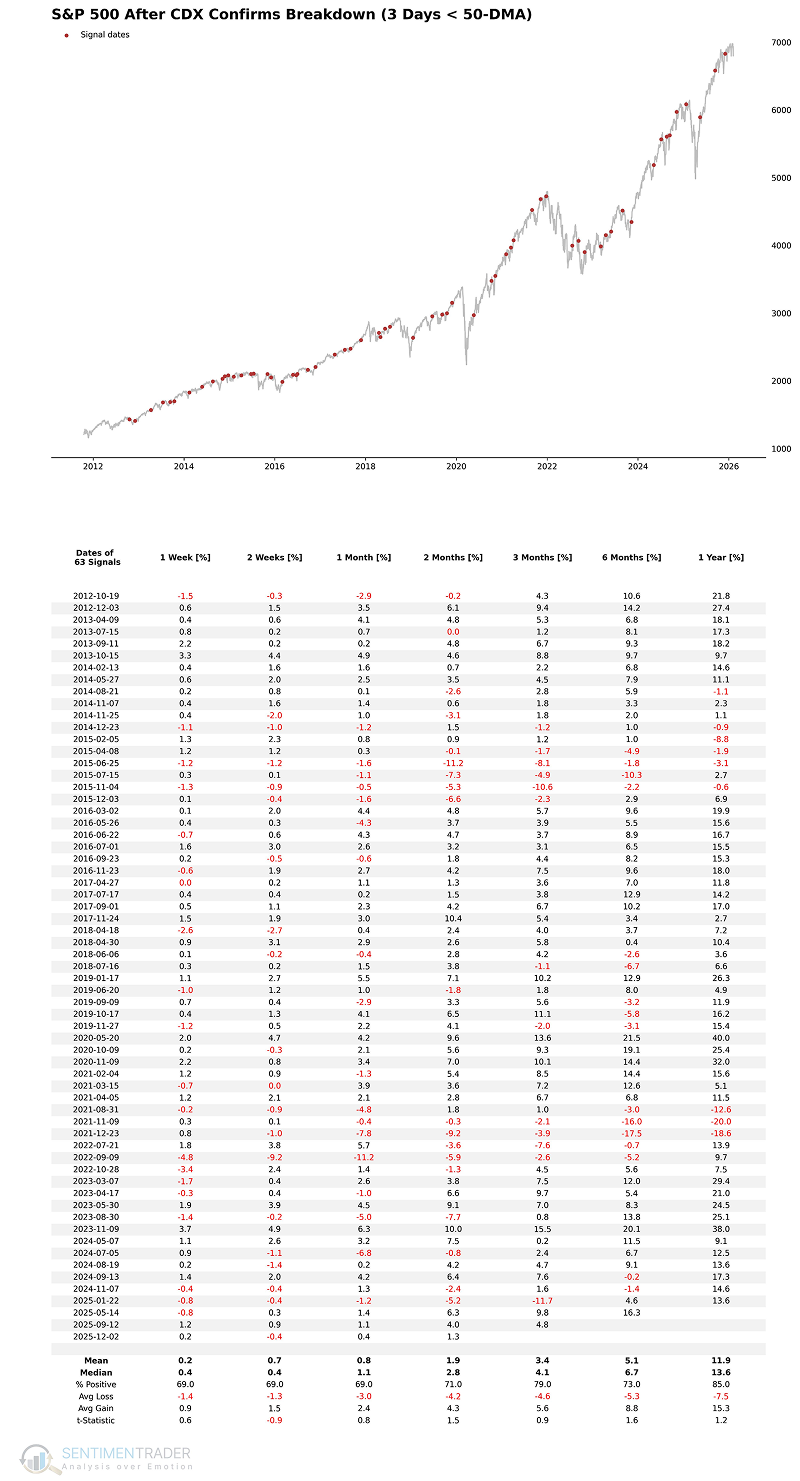
Given that the CDX broke above the 50-day moving average last Thursday but fell back below it on Friday, we can apply a "3-day confirmation rule" to filter out noise. This involves establishing a long position only when the CDX remains below the 50-day moving average for three consecutive trading sessions, and conversely, selling when it remains above for three sessions.
The chart below summarizes the performance of the S&P 500 using this smoothed criteria. As seen, the signal delivers remarkably robust returns.
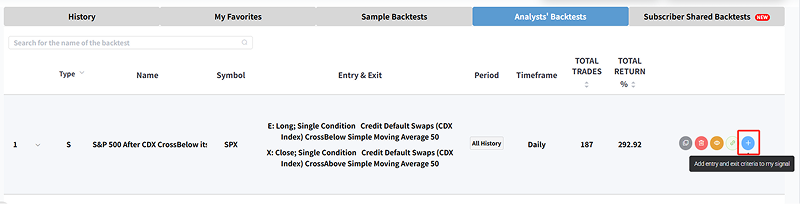
Feature Note: Never miss a crucial signal again. The Analysts' Backtests interface now features a "+ Add to My Signals" button that lets you instantly import entry and exit criteria from any analyst's backtest into your personal My Signals List.
- Go to the Analysts' Backtests tab of the Backtest Engine
- Click the + button at the far right to add it to your signals
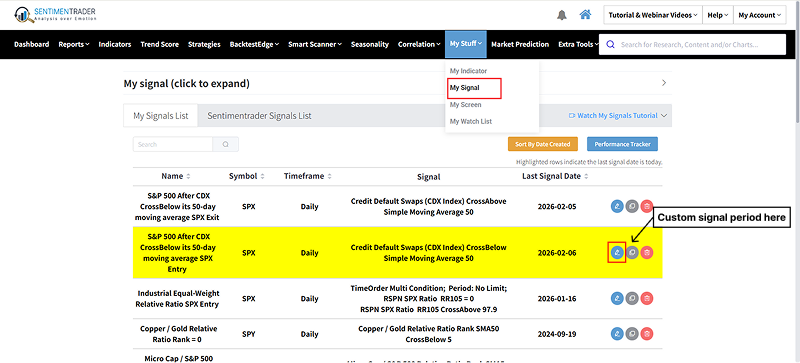
- If you wish, go to the My Signals page to confirm it has been added
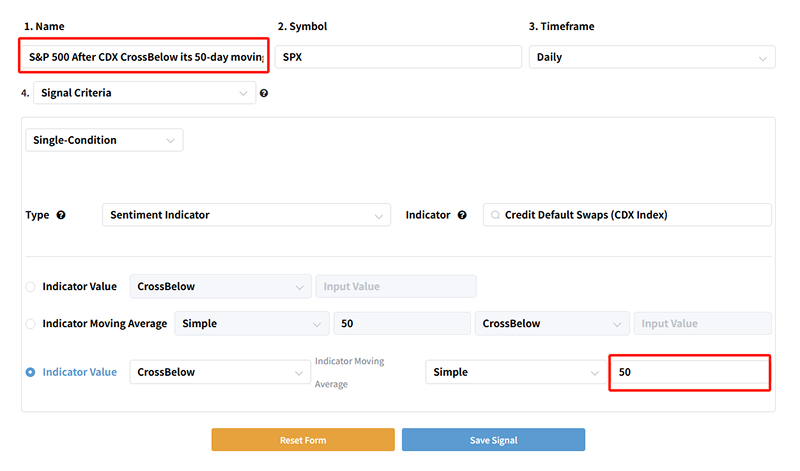
- You can edit your signal's period on the My Signal interface.
What the research tells us...
The credit market acts as a critical filter for equity risk. When bond traders are calm-evidenced by the CDX Index trading below its trend line-the stock market operates in a "safe zone" that historically produces superior risk-adjusted returns. Conversely, rising credit stress is a potent warning sign that often precedes significant equity drawdowns. Currently, despite brief intraday volatility, the CDX remains in a downtrend below its 50-day average. This confirms that the systemic stress required to derail the equity bull market is currently absent, supporting a continued "risk-on" stance for stocks.